
 ?Mathematical formulae have been encoded as MathML and are displayed in this HTML version using MathJax in order to improve their display. Uncheck the box to turn MathJax off. This feature requires Javascript. Click on a formula to zoom.
ABSTRACT
Tebuconazole is widely applied for controlling pathogenic fungi of crops and proved hazardous to human being. To better measure tebuconazole residues, an enzyme-linked immunosorbent assay for screening tebuconazole residues in aqueous samples was established using an innovative hapten (hapten1) designed via molecular model. The work concentration of calibration standard curves based on aqueous matrices ranged from 0.51 to 10.71 ng mL–1. The cross-reactivities of other analogs were less than 6%. The detection limits of the assay were in the range of 0.197–0.297 ng mL–1 for tebuconazole in water samples. The average recoveries of tebuconazole in the spiked water samples varied from 76.76% to 107.52% with the variation coefficient scope of 4.54–13.26%. The obtained immunoassay was verified by gas chromatography coupled to mass spectrometry with high correlation coefficients (r > 0.9868). Herein, the proposed immunoassay offers a cost-effective, convenient, reliable tool for the determination of tebuconazole residues in aqueous samples.
Introduction
Tebuconazole (TEB, see ), [(RS)-1-p-chlorophenyl-4,4-dimethyl-3-(1H-1,2,4-triazol-1-yl-methyl) pentan-3-ol], as a broad-spectrum triazole fungicide, was used extensively in fruits, vegetables and grains for controlling soil-borne and plant pathogenic fungi (Woodward, Brenneman, Kemerait, Culbreath, & Smith, Citation2010; Zhou, Zhang, Li, & Liu, Citation2016). The action mechanism of TEB is that cell membrane cannot exert function through inhibiting the biosynthesis of ergosterol, which causes fungal cells death. However, TEB has been proved to be an endocrine disruptor (Poulsen, Luong, Hansen, Styrishave, & Hayes, Citation2015), which may cause detrimental effects on the reproductive (Yu, Chen, Liu, Gui, & Zhu, Citation2013), nervous and immune systems (Bernardes, Andrade Vieira, Aragao, Ferreira, & da Silva Ferreira, Citation2015) of human being. To effective surveillance of TEB residues in agricultural products, the European Union has set the maximum residue limits (MRLs) in citrus fruits at the level of 0.05–3 μgkg−1 and in various grains at the level of 0.2–2.0 μgkg−1 for tebuconazole (Marin, de Ory, Cruz, Magan, & Teresa Gonzalez-Jaen, Citation2013). Additionally, TEB could persist in soil and water for many years (Bordagaray, Garcia-Arrona, & Millan, Citation2014; Kahle, Buerge, Hauser, Mueller, & Poiger, Citation2008; Saha, Pipariya, & Bhaduri, Citation2016) because of its high chemical and photochemical stability (Wang, Wu, Wu, & Wang, Citation2011). TEB gives rise to environmental pollution in a long time, which indirectly affects people’s health. Therefore, it is very urgent to establish a sensitive, rapid and green approach for the detection of TEB residues in environment water samples.
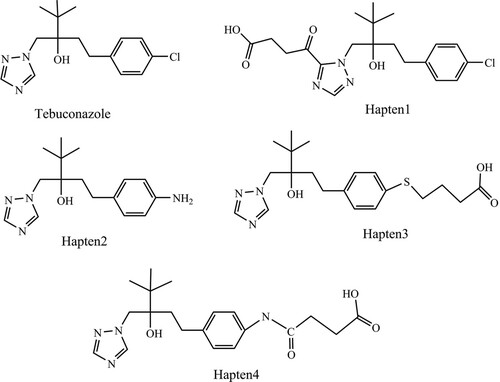
Figure 1. Chemical structures of tebuconazole and four haptens.
During the past two decades, several analytical methods have been developed to monitor TEB residues in various matrices, such as gas chromatography coupled to nitrogen–phosphorous selective detector (GC-NPD) (Deng, Hu, Qin, & Li, Citation2010; Singh, Padmaja, & Pandey, Citation2014), gas chromatography coupled to mass spectrometry (GC-MS) (Dong & Hu, Citation2014; Liu et al., Citation2011; Munitz, Medina, & Montti, Citation2017), as well as high-performance liquid chromatography (HPLC) with ultraviolet detector (Wang et al., Citation2016; Wu et al., Citation2014). These analytical assays were sensitive and accuracy, however, their inherent drawbacks lie in sophisticated instruments, highly quality personnels and tedious pretreatment procedure. Hence, these analytical approaches could not meet the requirement of rapidly screening amount large of samples in routine. So far, few enzyme-linked immunosorbent assays (ELISA) for TEB analysis were reported (Danks, Chaudhry, Parker, Barker, & Banks, Citation2001). Danks et al. (Citation2001) developed a competitive ELISA for the determination of TEB with the work range of 0.02 to 20 μg mL–1 based on a polyclonal antibody.
In the present study, we generated a specific monoclonal antibody against TEB using the innovative hapten, and then established a sensitive ELISA for the detection of TEB residues in water samples. Moreover, the detection performance of ELISA was verified with GC-MS.
Materials and methods
Chemicals and reagents
Tebuconazole and its analogs (triadimenol, triadimefon, diniconazole, myclobutanil and bitertanol) used for cross-reactivities were acquired from Hengshui Dingshang Trading Co. (Hebei, China). Various carrier proteins including keyhole limpet haemocyanin (KLH), bovine serum albumin (BSA) and ovalbumin (OVA) were obtained from OTWO Biotechnology Co. (Shenzhen, China). Complete Freund’s adjuvant, incomplete Freund’s adjuvant, hypoxanthine-aminopterin-thymidine (HAT), hypoxanthine-thymidine (HT), polyethylene glycol 1500 (PEG 1500, 50%) were purchased from Sigma Chemical Co. (St. Louis, MO). N-Hydroxysuccinimide (NHS), 1-(3-dimethylaminopropyl)-3-ethyl carbodiimide (EDC) and 3, 3, 5, 5-tetramethylbenzidine (TMB) were purchased from Aladdin Reagent Co. (Shanghai, China). RPMI-1640 culture medium and fetal calf serum were purchased from Shanghai Bioengineering Co. (Shanghai, China). Goat anti-mouse IgG horseradish peroxidase conjugate (HRP-IgG) was obtained from Amyjet Scientific Co. (Wuhan, China). Other chemical reagents were purchased from Crownbo Trade Co. (Luoyang, China).
Molecular model
Molecular model was carried out using the Gaussian 09W program and Gaussian view 5.0(Li et al., Citation2017). And geometry conformations and electronic distributions for tebuconazole, hapten 1, hapten 2, hapten 3, and hapten 4 (structures see ) were evaluated in our studies.
The conformation energies and atomic charges were calculated using the DFT B3LYP method (Vass, Diblikova, Cernoch, & Franek, Citation2008). The common atoms were defined by a triazole ring, a carbon chain and a benzene ring linked a chlorine atom (see ). Ultimately, the lowest energy conformation and electronic distribution for each compound were obtained.
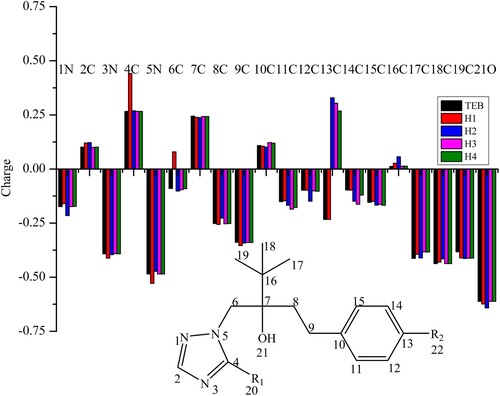
Figure 2. Computed atomic charges results of TEB and hapten1 (H1), hapten2 (H2), hapten3 (H3) and hapten4 (H4). The common atoms of TEB and four hapten structures are depicted and hydrogens are not included.
Hapten synthesis and characterization
Hapten1 (H1), 4-((1-(2-(4-chlorophenethyl)-2-hydroxy-3,3-dimethylbutyl)-1H-1,2,4-triazol-3-yl) -4-oxobutanoic acid, was firstly reported in our work. The synthetic route of H1 was illustrated in .
Figure 3. The synthetic route of hapten1.
Note: DCM: Dichloromethane; Et3N: Triethylamine; MeOH: Methanol; THF: Tetrahydrofuran.
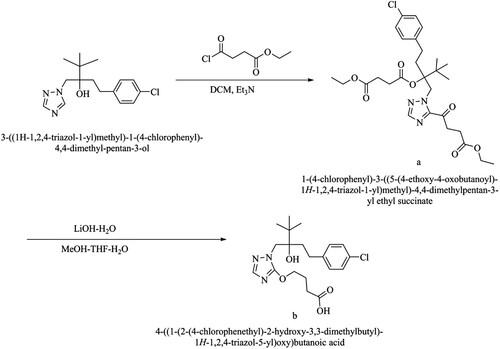
1-(4-chlorophenyl)-3-((5-(4-ethoxy-4-oxobutanoyl)-1H-1,2,4-triazol-1-yl)methyl)-4,4-dimethylpentan-3-yl Ethyl succinate (compound a in )
Tebuconazole (184 mg, 0.6 mmoL) dissolved in 15 mL of anhydrous CH2Cl2 was added into triethylamine (730 mg, 7.2 mmoL) and stirred for 5 min under ice-bath conditions. Then single ethyl succinate monoyl chloride (988 mg, 6 mmoL) was added into the reaction mixture and stirred at ambient temperature overnight. Subsequently, the mixture was rinsed with distilled water and NaCl saturated solution in turn. The organic phase was dried over anhydrous Na2SO4, and filtration, and followed evaporating to dryness under vacuum to yield the desired product (compound a, 400 mg). The crude product was used for the next hydrolysis.
4-(1-(2-(4-chlorophenethyl)-2-hydroxy-3,3-dimethylbutyl)-1H-1,2,4-triazol-3-yl)-4-oxocbutanoic acid (compound b in )
Compound a (400 mg, 0.6 moL) was suspended in the mixture of dry methanol and tetrahydrofuran (18 mL, methanol : tetrahydrofuran = 1:1, v/v). And then LiOH·H2O (252 mg, 6 mmoL) dissolved in water (3.0 mL) was added into the aforementioned mixture. After stirring at room temperature overnight, the reaction mixture was acidified to pH 2.0 with HCl (1 mol L–1) and purified by reversed-phase chromatography. The mobile phase composed of acetonitrile and water (acetonitrile : water = 2:3, v/v). Then, the eluant was evaporated to dryness under reduced pressure to obtain the colourless oil solid (70 mg) with a yield of 29%. The final product (compound b) was characterized by an all-digital nuclear magnetic resonance spectrometer (NMR, AVANCE III, Bruker, Billerica, MA).1H NMR (500 MHz, MeOD) δ 8.11 (d, J = 14.0 Hz, 1H, NCH), 7.21 (d, J = 8.5 Hz, 2H, ArH), 7.07 (d, J = 8.5 Hz, 2H, ArH), 4.87 (d, J = 14.0 Hz, 1H, CH2N), 4.80 (d, J = 14.0 Hz, 1H, CH2N), 3.48 (m, 1H, CH2Ar), 3.34 (m, 1H, CH2Ar), 2.73 (m, 2H, CH2COOH), 2.57 (m, 1H, COCH2CH2), 1.80 (m, 3H, COCH2CH2), 1.08 (s, 9H, 3CH3).
Preparation of immunogen and coating antigen
H1 was conjugated with different carrier proteins (KLH, BSA and OVA) to obtain immunogens and coating antigens using an active ester method (Chen, Li, et al., Citation2017a; Chen et al., Citation2015). A solution of H1 (20.5 mg, 0.05 mmoL) in dry N, N-dimethylformamide (DMF, 2.5 mL) was activated by the 1-ethyl-3-(dimethylaminopropyl)-carbodiimide (EDC, 9.6 mg, 0.05 mmoL) and N-hydroxysuccinimide (NHS, 6.9 mg, 0.06 mmoL). The mixture was stirred at ambient temperature for 12 h and then the colour of solution became dark brown. After the activation solution was divided into five equal parts, one aliquot was added dropwise to 2 mL of KLH solution (5 mg mL–1, 0.01 M PB, pH 7.2 phosphate buffer, NaH2PO4 0.296 g, Na2HPO4·12H2O 2.9 g in 1 L water), two aliquots were added dropwise to 5 mL of BSA solution (5 mg mL–1, 0.02 M BB, pH 8.8 borate buffer, Na2B4O7 13.349 g, H3BO3 3.69 g in 1 L water) and OVA solution (6 mg mL–1, 0.02 M, pH 8.8 borate buffer), respectively. After the mixture was stirred under ice-bath conditions for 6 h. The obtained product was dialysed against eight changes of phosphate buffer saline (0.01 mol L–1 PBS, pH 7.2, NaCl 0.9 g, NaH2PO4 0.296 g, Na2HPO4·12H2O 2.9 g in 1 L water) for 3 days and then stored at –20°C until further use. These conjugates were characterized with a ultraviolet-visible spectrophotometer (Bokin Instruments, Tsushima, Japan).
Production of monoclonal antibodies
The immunization procedure was similar to the previous report (Chen et al., Citation2014; Guo et al., Citation2015). Female Balb/c mice (8–10 weeks old) were bought from the experiment animal centre of Zhengzhou University. Briefly, two immunogens H1-KLH and H1-BSA were administered individually to mice at a dosage of 100 μg protein per mouse. Each mouse was subcutaneously injected at multiple points on the back using the immunogen emulsified with Freund’s complete adjuvant. After 4 weeks, the first booster inoculation was carried out using an emulsion of the same immunogen and Freund’s incomplete adjuvant with a dosage of 50 μg protein per mouse. Subsequent booster inoculations were performed at two-week intervals. Seven to ten days after the fifth immunization, antisera from each mouse were monitored by an indirect competitive enzyme-linked immunosorbent assay (ic-ELISA). The cell fusion programme was conducted using the classical fusion procedure (Peng et al., Citation2017; Wang et al., Citation2017). This mouse was sacrificed with the highest ratio of the maximum absorbance and the fifty percent inhibitory concentration to use its splenocytes fused with SP2/0 myeloma cells at a ratio of 10:1. After fusion, the hybridomas cells will grow in the HAT medium containing 20% fetal bovine serum at 37°C and 5% CO2. After culturing 10 days, the hybridomas cells were screened by ic-ELISA and the absorbances were read at 450 nm using a Multiskan FC microplate reader (Thermo Labsystems Company, Beijing, China). The selected hybridomas cells were subcloned 3 times via the limiting dilution. After the obtained hybridomas cells were propagated in large quantities, half of the cells were collected in frozen tubes and then stored in a liquid nitrogen tank. Another half of the cells were intraperitoneally administered the mice treated with sterilized paraffin. The ascites were purified by the ammonium sulphate precipitation method (Liu, Yan, Zhang, Kuang, & Xu, Citation2015; Wang et al., Citation2017). The purified antibodies were divided into aliquot portions and frozen at –20°C until subsequent use.
Establishment of ic-ELISA
The ELISA approach was performed referring to our previous research (Li et al., Citation2017). Briefly, the 96-well plates were coated with 100 μL per well of coating antigen H1-OVA diluted with carbonate–bicarbonate buffer (0.02 M CB, pH 9.6, Na2CO3 1.59 g, NaHCO3 2.93 g, diluted with 1 L water) and reacted at 37°C for 2 h. The microplates were washed 3 times with 220 μL of PBST (0.01 M, pH 7.2 PBS containing 0.1% Tween20) per well and blocked with 200 μL of CB buffer containing 2% gelatin at 37°C for 2 h. Subsequently, the samples or standard solutions (50 μL/well) and 50 μL of diluted antibodies were successively added into the plates and cultivated at 37°C for 30 min. After washing repeatedly 3 times, 100 μL of horseradish peroxidase-labeled goat anti-mouse IgG (diluted 1:3000) was added and then incubated at 37°C for 30 min. Then, the plates were washed as described previously and cultured with 100 μL of 3,3′,5,5′-tetramethyl benzidine substrate solution at 37°C for 15 min in the dark. Finally, the enzymic reaction was terminated with 50 μL of H2SO4 (2 mol L–1) and the plates were read with a microplate reader at 450 nm.
Optimization of ELISA
The most suitable concentrations of mAb versus coating antigen were determined using a two-dimensional titration assay. Besides, the effects of ionic strength (NaCl content, 0%, 0.4%, 0.8%, 1.2% 1.6%, w/v), pH values (5.2, 6.3, 7.2 and 8.0) and the variety of organic solvent (methanol, alcohol, acetonitrile, N,N-dimethylformamide) in assay buffer (solvent : PBS = 1:9, v/v) and methanol concentrations (1%, 5%, 10%, 20%, 40%, v/v) of assay buffer were evaluated on immunoassay performance of TEB.
Standard curves
Under optimum conditions, the absorbance of the well at zero standard concentration was defined as B0, and the absorbance of the well containing some standard concentration was defined as B. The standard curve for TEB based on the water matrix calibration was obtained by plotting the logarithm of eight TEB standard solutions (0, 0.78, 1.56, 3.12, 6.25, 12.5, 25, 50 ng mL–1) versus percentage of binding (B/B0). The ELISA sensitivity was assessed by the 50% inhibitory concentration (IC50). 20% and 80% inhibitory concentration of monoclonal antibody (mAb) were defined as the scope of quantitative determination of TEB.
Cross-reactivity
To estimate the specificity of assay, the IC50 values of mAb for triadimenol, triadimefon, diniconazole, myclobutanil and bitertanol were determined under optimum conditions to calculate the cross-reactivities of mAb using the following formula (Chen, Liu, et al., Citation2017b):
Spiked test
Two environmental water samples, derived from Qin lake water (Luoyang, China) and Luo river water (Luoyang, China), were filtered to remove any suspended solids prior to analysis. Tap water was directly tested without treatment. A five-point standard curve based on sample matrices was graphed by fitting B/B0 and log [concentration of analyze]. The detection limit (LOD) of immunoassay was based on the mean value of 20 blank samples plus triple average standard deviation (SD). The accuracy and precision of the developed ELISA were represented by recovery rates and coefficient of variation, respectively. Luo river water, Qin lake water and tap water were verified to be TEB-free by GC-MS (Sinha et al., Citation2011) and were fortified with TEB in methanol at three final levels of 0.8, 4.0 and 20 ng mL–1. Intra-assay variation was tested based on 6 replicates and inter-assay variation was measured on 5 consecutive days.
Comparison of the ic-ELISA with GC-MS
The Luo river water, Qin lake water and tap water were artificially contaminated at five levels (0.8, 2.0, 4.0, 10.0, 20.0 ng mL–1) and were subjected to the obtained ELISA and GC-MS referred to a previous report (Sinha et al., Citation2011). Each concentration level set 5 repetitions. The correlations between the ELISA results and those from GC-MS were estimated by the linear regression.
Results and discussion
Hapten design
The production of specific antibodies against TEB requires the hapten which mimics TEB in chemical structure, conformation and electronic distribution (Pinacho, Sanchez-Baeza, & Marco, Citation2012). Taking into account the planar structure of TEB, we designed four potential haptens (see ). The linkers may be placed at position 4 or 13 of the common structure (see ), the characteristic epitope (triazole ring or benzene ring) will exposure to the immunosystem maximized. From the synthesis point of view, H1 can be easily obtained in only two reaction steps using TEB as the synthetic material. The amino group of hapten2 is tethered to benzene ring by replacing the chlorine atom of TEB analyte. Hapten2 was prepared by seven reaction steps and one step reaction was performed to obtain hapten4 based on the hapten2. However, the amino group of hapten2 was directly coupled with benzene ring and then may affect the recognition of immunosystem to benzene ring. Thus, hapten2 is not suitable as an immunogen hapten.
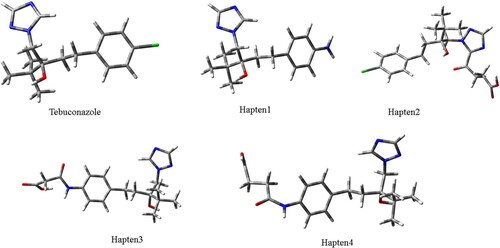
Depending on the described previously, electronic distribution and geometry conformation of targets are always objective criteria to assist hapten design with molecular model. From the perspective of geometric features (see ), triazole ring and benzene ring of TEB form an angel. However, the angle of hapten 3 and hapten 4 seem be bigger than TEB because the introduction of the linker arm made the bond angel rotate to the same side of the 4,4-dimethyl group, which was different from TEB. So hapten 3 and hapten 4 are not also appropriate as immunogen haptens from the point of geometry conformations. Generally, there is no significant vary (see ) between the minimum energetic conformations of hapten1, hapten2 and those of TEB. Finally, the atomic charge distribution of TEB and hapten1, hapten2, hapten3, hapten4 in the common structure can be seen from . On the contrary, charge distribution could play a more important pole according to the description by the Mercader (Mercader, Agullo, Abad-Somovilla, & Abad-Fuentes, Citation2011). The total charge of the common chemical structure for TEB and four haptens was all negative, moreover, hapten1 is the closest to the sum atomic charge of TEB. While hapten4 is not suitable as an immunological hapten to generate the specific antibodies against TEB, since hapten4 has a less negative total charge than TEB. Observing the graphed differences between four haptens and TEB, hapten2 was also not an appropriate immunological hapten because it cannot mimic the atomic charges of TEB. In summary, hapten1 mimicked perfectly the target analyte in geometry conformation and atomic charges, thus hapten1 was selected to raise the specific antibody against TEB.
Figure 4. The lowest energy conformation of Tebuconazole (TEB), Hapten1, Hapten2, Hapten3 and Hapten4 presented using tube display format. The elements are presented in the following manner: grey, carbon; dark blue, nitrogen; light grey, hydrogen; red, oxygen; green, chlorine.
Antigen characterization and antibody production
These conjugates (H1-KLH, H1-BSA and H1-OVA) were continuously scanned at the wavelength range of 200–500 nm using an ultraviolet-visible spectrophotometer. The experimental data showed that the main absorbance peaks of H1 were at 220 nm and 254 nm, and those of carrier proteins were at 210 nm and 278 nm, respectively. There were obvious shifts (5–15 nm) of main absorbance peaks in these conjugates spectrum which demonstrated H1 was successfully coupled to these carrier proteins. The molar rates of hapten1 to various carrier proteins (KLH, BSA and OVA) were calculated as 8:1, 10:1, 12:1, respectively.
Identification of monoclonal antibody
The mouse immunized by the conjugate H1-KLH was chosen to apply for the preparation of mAb due to its antiserum with high titre and low IC50. Ten days after the cell fusion, cell supernatant was collected and tested by ic-ELISA using H1-OVA as a coating antigen. The positive supernatant was rescreened using TEB as the competitor. After 5 hybridomas cells were chosen, subcloned and then screened 3 times, the desired cell line 6E5 was obtained and further used to produce ascites. The protein concentration of the ascite was approximately 4.8 mg mL–1. The experimental data indicated the heavy chain of mAb was IgG2b and the light chain was kappa. The mAb 6E5 manifested low cross-reactivity (less than 6%) to TEB analogs (see ). Herein, the mAb 6E5 showed a good specificity to TEB.
Table 1. Cross-reactivity (CR) of the mAb 6E5.
ELISA development
The checkerboard results demonstrated that the optimal concentrations of mAb 6E5 and coating antigen were 0.36 μg mL–1 and 0.60 μg mL–1, respectively. To estimate the potential interference for real samples, ionic strength, pH values and organic solvent on the assay performance were assessed. Different NaCl contents were used to change ionic strength in phosphate buffer (0.01M PB, pH 7.2, KCl 0.2 g, KH2PO4 0.24 g, Na2HPO4·12H2O 3.62 g in 1 L water). As seen in the , B0 (absorbance with the zero standard) was decreased to 1.443 from 2.478 with increasing of NaCl content, while IC50 value was the lowest (3.97 ng mL–1) when NaCl content in assay buffer was 0.8% (w/v). So 0.8% NaCl in assay buffer was chosen as the subsequent experiment. As showed in , the ELISA had the lowest B0 and the highest IC50 when pH value was 5.2. No obvious changes on B0 and IC50 were found as pH values changed from 6.3 to 8.0. In contrast, the B0 was higher and IC50 was the lowest at pH 7.2. Thus, the optimal pH value was 7.2. TEB as a hydrophobic analyte, it is essential to evaluate the effect of co-solvent species and proportion in assay buffer on the assay performance. Furthermore, low concentration of co-solvent in the assay system could decrease the solubility of TEB in sample buffer, while a high concentration of co-solvent in the assay system could decrease the B0 value due to mAb inactivation. presented 10% (v/v) four organic solvents in assay buffer, such as DMF, ethanol, acetone and methanol, were investigated in our study. The B0 value is the lowest (1.572) when DMF as a co-solvent, so DMF could influence the binding of antibody and coating antigen. When ethanol and acetone were used as assistant solvents, both of B0 were lower and IC50 were higher than methanol in assay buffer. Thus, methanol was selected as the optimal condition and its concentration was optimized in the subsequent experiment. The data in showed that no significant change on the B0 value was found as methanol content increased from 0% to 20%. The B0 value decreased steeply to 0.956 when methanol content was 40%. When methanol content was 5% (v/v), the B0 value was higher and the IC50 was lowest (1.03 ng mL–1), which indicated that 5% (v/v) methanol content in assay buffer was the optimal condition.
Table 2. Effects of NaCl content, pH value, organic solvent varies and content in assay buffer on the ELISA performance.
Assay verification
As can be observed from a, these performance parameters of ELISA were calculated based on three matrix calibrations. The LODs ranged from 0.197 to 0.297 ng mL–1 in Luo river water, Qin lake water, and tap water samples. The scope of determination was 0.51–10.71 ng mL–1 in three matrices. As can be seen from , the average recoveries of TEB were in the range of 76.76–107.52%. The coefficient of variation (CV) values for intra-day was less than 10.42% and CV values for inter-day were lower than 13.26%. Results manifested that the obtained immunoassay provides a rapid detection tool for TEB residues in environmental aqueous samples.
Figure 5. The calibration curves of ic-ELISA for tebuconazole based on aqueous samples (a). Correlation of the ic-ELISA and the GC-MS results for the spiked Luo river water (b), Qin lake water (c) and Tap water (d).
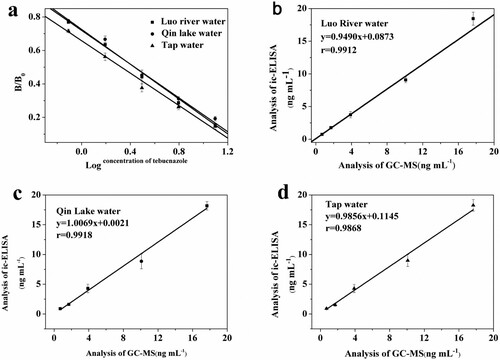
Table 3. Recoveries of tebuconazole-fortified blank aqueous samples
Comparison between ELISA and GC-MS
The TEB for three artificially contaminated water samples was simultaneously measured using both the proposed ELISA and the slightly modified GC-MS method. Result comparison by both ELISA and the GC-MS may be observed in . The linear regression equations of Luo river water, Qin lake water and tap water were expressed as follows: y = 0.9490x + 0.0873, y = 1.0069x + 0.0021 and y = 0.9856x + 0.1145. Three correlation coefficients were calculated and more than 0.9868. The data indicated that the proposed ELISA can be applied for TEB residues in real water samples through simple filtration.
Conclusion
An innovative hapten to raise a specific antibody against TEB was designed rationally according to chemical structures and theoretical calculation. On the basis of the insight results, the novel hapten (hapten1) was synthesized successfully and then the mAb 6E5 against TEB was raised. Comparison with the previous studies (Danks et al., Citation2001), we designed firstly hapten1 and established a more sensitive immunoassay for TEB analysis using hapten1. The described ELISA manifests high sensitivity with the LOD of 0.297 ng mL–1 for Luo river water, 0.279 ng mL–1 for Qin lake water, and 0.197 ng mL–1 for tap water, respectively. The average recoveries of TEB were more than 76.76%. Furthermore, the proposed ELISA was confirmed by GC-MS method. The results demonstrated that the obtained ELISA may become a convenient, economical and reliable tool to screening initially TEB residues in water samples and other agricultural products.
Acknowledgements
The animal experiments involved in the present study were carried out in accordance with the Henan University of Science and Technology animal experiment centre guidelines and the relevant laws.
Disclosure statement
No potential conflict of interest was reported by the authors.
Additional information
Funding
References
- Bernardes, P. M., Andrade-Vieira, L. F., Aragao, F. B., Ferreira, A., & da Silva Ferreira, M. F. (2015). Toxicity of difenoconazole and tebuconazole in allium cepa. Water Air and Soil Pollution, 226(7), 206–217. doi: 10.1007/s11270-015-2462-y
- Bordagaray, A., Garcia-Arrona, R., & Millan, E. (2014). Determination of triazole fungicides in liquid samples using ultrasound-assisted emulsification microextraction with solidification of floating organic droplet followed by high-performance liquid chromatography. Food Analytical Methods, 7(6), 1195–1203. doi: 10.1007/s12161-013-9733-2
- Chen, Y., Kong, D., Liu, L., Song, S., Kuang, H., & Xu, C. (2015). Development of an enzyme-linked immunosorbent assay (ELISA) for natamycin residues in foods based on a specific monoclonal antibody. Analytical Methods, 7(8), 3559–3565. doi: 10.1039/c5ay00404g
- Chen, X., Li, Z., Guo, J., Li, D., Gao, H., Wang, Y., & Xu, C. (2017a). Simultaneous screening for marbofloxacin and ofloxacin residues in animal-derived foods using an indirect competitive immunoassay. Food and Agricultural Immunology, 28(3), 489–499. doi: 10.1080/09540105.2017.1297780
- Chen, Y., Liu, L., Xu, L., Song, S., Kuang, H., Cui, G., & Xu, C. (2017b). Gold immunochromatographic sensor for the rapid detection of twenty-six sulfonamides in foods. Nano Research, 10(8), 2833–2844. doi: 10.1007/s12274-017-1490-x
- Chen, X., Xu, L., Ma, W., Liu, L., Kuang, H., Wang, L., & Xu, C. (2014). General immunoassay for pyrethroids based on a monoclonal antibody. Food and Agricultural Immunology, 25(3), 341–349. doi: 10.1080/09540105.2013.794328
- Danks, C., Chaudhry, M. Q., Parker, L., Barker, I., & Banks, J. N. (2001). Development and validation of an immunoassay for the determination of tebuconazole residues in cereal crops. Food and Agricultural Immunology, 13, 151–159. doi: 10.1080/09540100120075808
- Deng, Z., Hu, J., Qin, D., & Li, H. (2010). Simultaneous analysis of hexaconazole, myclobutanil, and tebuconazole residues in apples and soil by SPE clean-up and GC with nitrogen-phosphorus detection. Chromatographia, 71(7-8), 679–684. doi: 10.1365/s10337-010-1505-1
- Dong, B., & Hu, J. (2014). Dissipation and residue determination of fluopyram and tebuconazole residues in watermelon and soil by GC-MS. International Journal of Environmental Analytical Chemistry, 94(5), 493–505. doi: 10.1080/03067319.2013.841152
- Guo, L., Song, S., Liu, L., Peng, J., Kuang, H., & Xu, C. (2015). Comparsion of an immunochromatographic strip with ELISA for simultaneous detection of thiamphenicol, florfenicol and chloramphenicol in food samples. Biomedical Chromatography, 29(9), 1432–1439. doi: 10.1002/bmc.3442
- Kahle, M., Buerge, I. J., Hauser, A., Mueller, M. D., & Poiger, T. (2008). Azole fungicides: Occurrence and fate in wastewater and surface waters. Environmental Science & Technology, 42(19), 7193–7200. doi: 10.1021/es8009309
- Li, Z., Wang, Y., Li, D., Chen, X., Li, Z., Gao, H., & Hou, Y. (2017). Development of an indirect competitive enzyme-linked immunosorbent assay for screening ethopabate residue in chicken muscle and liver. Rsc Advances, 7(57), 36072–36080. doi:10.1039/c6ra20736g doi: 10.1039/C6RA20736G
- Liu, X., Wang, X., Xu, J., Dong, F., Song, W., & Zheng, Y. (2011). Determination of tebuconazole, trifloxystrobin and its metabolite in fruit and vegetables by a Quick, Easy, Cheap, effective, Rugged and Safe (QuEChERS) method using gas chromatography with a nitrogen-phosphorus detector and ion trap mass spectrometry. Biomedical Chromatography, 25(10), 1081–1090. doi: 10.1002/bmc.1575
- Liu, L., Yan, H., Zhang, X., Kuang, H., & Xu, C. (2015). Development of an anti-chlorothalonil monoclonal antibody based on a novel designed hapten. Food and Agricultural Immunology, 26(3), 410–419. doi: 10.1080/09540105.2014.938319
- Marin, P., de Ory, A., Cruz, A., Magan, N., & Teresa Gonzalez-Jaen, M. (2013). Potential effects of environmental conditions on the efficiency of the antifungal tebuconazole controlling Fusarium verticillioides and Fusarium proliferatum growth rate and fumonisin biosynthesis. International Journal of Food Microbiology, 165(3), 251–258. doi: 10.1016/j.ijfoodmicro.2013.05.022
- Mercader, J. V., Agullo, C., Abad-Somovilla, A., & Abad-Fuentes, A. (2011). Synthesis of site-heterologous haptens for high-affinity anti-pyraclostrobin antibody generation. Organic & Biomolecular Chemistry, 9(5), 1443–1453. doi: 10.1039/c0ob00686f
- Munitz, M. S., Medina, M. B., & Montti, M. I. T. (2017). Development and validation of an SPME-GC method for a degradation kinetics study of propiconazole I, propiconazole II and tebuconazole in blueberries in Concordia, the main production area of Argentina. Food Additives and Contaminants Part a-Chemistry Analysis Control Exposure & Risk Assessment, 34(5), 793–799. doi: 10.1080/19440049.2017.1301682
- Peng, J., Liu, L., Xu, L., Song, S., Kuang, H., Cui, G., & Xu, C. (2017). Gold nanoparticle-based paper sensor for ultrasensitive and multiple detection of 32 (fluoro)quinolones by one monoclonal antibody. Nano Research, 10(1), 108–120. doi: 10.1007/s12274-016-1270-z
- Pinacho, D. G., Sanchez-Baeza, F., & Marco, M. P. (2012). Molecular modeling assisted hapten design to produce broad selectivity antibodies for fluoroquinolone antibiotics. Analytical Chemistry, 84(10), 4527–4534. doi:10.1021/ac300263m doi: 10.1021/ac300263m
- Poulsen, R., Luong, X., Hansen, M., Styrishave, B., & Hayes, T. (2015). Tebuconazole disrupts steroidogenesis in Xenopus laevis. Aquatic Toxicology, 168, 28–37. doi: 10.1016/j.aquatox.2015.09.008
- Saha, A., Pipariya, A., & Bhaduri, D. (2016). Enzymatic activities and microbial biomass in peanut field soil as affected by the foliar application of tebuconazole. Environmental Earth Sciences, 75(7), 558–571. doi: 10.1007/s12665-015-5116-x
- Singh, S. K., Padmaja, P., & Pandey, S. Y. (2014). Fast ultrasound-assisted extraction followed by capillary gas chromatography combined with nitrogen-phosphorous selective detector for the trace determination of tebuconazole in garlic, soil and water samples. Journal of Separation Science, 37(11), 1315–1321. doi: 10.1002/jssc.201400006
- Sinha, S. N., Bhatnagar, V. K., Doctor, P., Toteja, G. S., Agnihotri, N. P., & Kalra, R. L. (2011). A novel method for pesticide analysis in refined sugar samples using a gas chromatography-mass spectrometer (GC-MS/MS) and simple solvent extraction method. Food Chemistry, 126(1), 379–386. doi: 10.1016/j.foodchem.2010.10.110
- Vass, M., Diblikova, I., Cernoch, I., & Franek, M. (2008). ELISA for semicarbazide and its application for screening in food contamination. Analytica Chimica Acta, 608(1), 86–94. doi: 10.1016/j.aca.2007.11.052
- Wang, Y., Li, Z., Pei, Y., Li, Q., Sun, Y., Yang, J., & Hu, X. (2017). Establishment of a lateral flow colloidal gold immunoassay strip for the rapid detection of soybean allergen beta-conglycinin. Food Analytical Methods, 10(7), 2429–2435. doi: 10.1007/s12161-017-0800-y
- Wang, C., Wu, Q., Wu, C., & Wang, Z. (2011). Application of dispersion-solidification liquid-liquid microextraction for the determination of triazole fungicides in environmental water samples by high-performance liquid chromatography. Journal of Hazardous Materials, 185(1), 71–76. doi: 10.1016/j.jhazmat.2010.08.124
- Wang, H., Yang, X., Hu, L., Gao, H., Lu, R., Zhang, S., & Zhou, W. (2016). Detection of triazole pesticides in environmental water and juice samples using dispersive liquid-liquid microextraction with solidified sedimentary ionic liquids. New Journal of Chemistry, 40(5), 4696–4704. doi: 10.1039/c5nj03376d
- Woodward, J. E., Brenneman, T. B., Kemerait, R. C., Jr., Culbreath, A. K., & Smith, N. B. (2010). Management of peanut diseases with reduced input fungicide programs in fields with varying levels of disease risk. Crop Protection, 29(3), 222-229. doi:10.1016/j.cropro.2009.12.008.
- Wu, Y. t., Zhang, Y.-h., Zhang, M., Liu, F., Wan, Y. c., Huang, Z., & Lu, B. (2014). Selective and simultaneous determination of trace bisphenol A and tebuconazole in vegetable and juice samples by membrane-based molecularly imprinted solid-phase extraction and HPLC. Food Chemistry, 164, 527–535. doi:10.1016/j.foodchem.2014.05.071.
- Yu, L., Chen, M., Liu, Y., Gui, W., & Zhu, G. (2013). Thyroid endocrine disruption in zebrafish larvae following exposure to hexaconazole and tebuconazole. Aquatic Toxicology, 138, 35–42. doi: 10.1016/j.aquatox.2013.04.001
- Zhou, J., Zhang, J., Li, F., & Liu, J. (2016). Triazole fungicide tebuconazole disrupts human placental trophoblast cell functions. Journal of Hazardous Materials, 308, 294–302. doi: 10.1016/j.jhazmat.2016.01.055