
ABSTRACT
Sulfamethazine (SMZ), widely used for disease prevention of bees, is harmful to consumers when excess SMZ residues are present in honey. In this study, a novel competitive lateral flow immunoassay (LFIA) was established by using aggregation-induced emission fluorescent microsphere (AIEFM) as label for the detection of SMZ. Results indicated that the limit of detection (LOD) for the developed competitive AIEFM-LFIA in honey was 0.028 ng/mL, and the corresponding linear range was 0.05−5 ng/mL. Recovery experiments showed that the average recovery range was 75.6–95.1% with coefficient variations of 5.7–12.9% in honey. The developed competitive AIEFM-LFIA was compatible with HPLC-MS/MS in detecting SMZ in 15 real samples from honey. In general, the proposed AIEFM-LFIA is well suited for the competitive format and has great potential for the detection of other small targets with single antigenic site in practical application.
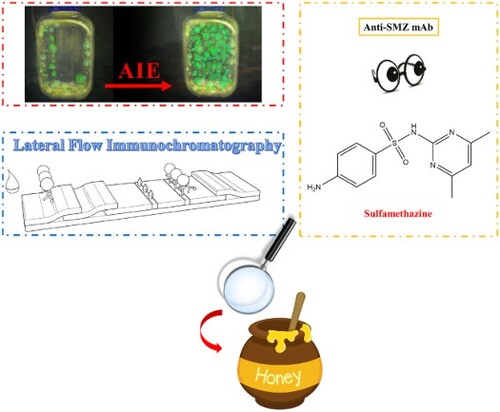
GRAPHICAL ABSTRACT
1. Introduction
In beekeeping, it is common practice to use sulfamethazine (SMZ), a type of sulfonamides (SAs), to protect bees against bacterial diseases (Chen, Zhou, Zhang, & Gao, Citation2012; Eyken et al., Citation2019; Kadziński, Banasiuk, & Banecki, Citation2018). However, SMZ abuse may cause the presence of SMZ residues in honey (Reybroeck, Daeseleire, De Brabander, & Herman, Citation2012). These residues are harmful to consumers because of their negative effect on the human intestine, risk of developing antibiotic resistance, and carcinogenic potential (Barani & Fallah, Citation2014; Karageorgou, Manousi, Samanidou, Kabir, & Furton, Citation2016). Remarkably, the Rapid Alert System for Food and Feed from the Health and Consumers Directorate-General of the European Commission had confirmed that SMZ exists in some honey bee products (Su, Li, Liu, Wang, & Yang, Citation2016). To ensure food safety, the maximum residue limit of 50 µg/kg for total SAs in honey has been implemented in China, Switzerland, and the European Union (Zhang et al., Citation2019b). Therefore, an analytical method for the rapid and sensitive detection of SMZ in honey must be urgently established.
SMZ was traditionally determined by high-performance liquid chromatography (Ibarra, Miranda, Rodriguez, Nebot, & Cepeda, Citation2014; Kim, Jeong, Park, Kim, & Kim, Citation2016) and liquid chromatography-mass spectrometry (Shao et al., Citation2005; Turnipseed et al., Citation2017). Although these analytical methods are accurate, they are costly, time-consuming, and generally unsuitable for use in the field. By contrast, lateral flow immunoassay (LFIA), which is a rapid, simple, and inexpensive technique (Liu et al., Citation2018). In the past few years, LFIA has developed significantly in the fields of food safety (Galan-Malo et al., Citation2019; Raeisossadati et al., Citation2016). Conventional LFIA using colloidal gold as label exhibits relatively low sensitivity because of its insufficient brightness (Jiang et al., Citation2018). In the past 10 years, many scholars adopted different types of fluorescent microspheres (FMs) to improve the sensitivity of LFIA (Shi et al., Citation2015; Zhang et al., Citation2016). However, traditional FMs often suffer from the aggregation-caused quenching effect due to the strong π−π interaction in the aggregated state, thus limiting the wide application of FM-LFIA in the fields. Since Tang and coworkers (Luo et al., Citation2001; Mei et al., Citation2014) proposed the “aggregation-induced emission (AIE)” concept, AIE-based materials have emerged as new-generation fluorescent labels with superior brightness in the aggregate state (Duan et al., Citation2016; Li et al., Citation2012; Panigrahi et al., Citation2019).
In our previous work, a novel AIEFM was used as label for rapid detection of larger analytes with multiple antigenic sites based on sandwich format, and the results showed that AIEFM has a larger Stokes shift, better fluorescence intensity, and higher relative quantum yield than conventional FMs (Zhang et al., Citation2019a).
In this study, a novel competitive LFIA was established by using AIEFM as label for the detection of SMZ in honey samples (see Graphical Abstract). To our knowledge, this is the first time to systematically discuss the detection performance of AIEFM-LFIA based on competitive format.
2. Methods and materials
2.1. Materials and reagents
SMZ, sulfacetamide, sulfapyridine, sulfadiazine, sulfachloropyridazine, sulfamethoxazole, sulfamonomethoxine, sulfaguanidine, sulfamethizole, sulfadoxine, sulfanilamide, and other non-SAs antibiotics (enrofloxacin, florfenicol, tetracycline) were obtained from J&K Scientific Ltd. (Shanghai, China). The structures of these drugs were shown in Supporting Information Figure S-1. Poly (maleic anhydride-alt-1-octadecene) (PMAO), N-hydroxysulfosuccinimide sodium salt (NHSS), 1-ethyl-3-(3-dimethylaminopropyl) carbodiimide (EDC), dimethyl sulfate, casein, bovine serum albumin (BSA), boric acid buffer (BB, 0.2 M, pH = 8), phosphate buffer saline (PBS, 0.01 M, pH = 7.4) and goat anti-mouse antibody were obtained from Sigma (St. Louis, MO, USA). Poly (methyl methacrylate) (PMMA) and sodium dodecyl sulfate (SDS) were obtained from Aladdin (Shanghai Aladdin Bio-Chem Technology Co., Ltd., China). Tetramethyl 4′,4′′′,4′′′′′,4′′′′′′′-(ethene-1,1,2,2-tetrayl) tetrakis([1,1′-biphenyl]-4-carboxylate) (TETRA, its chemical structure is shown in Supporting Information Figure S-2) was custom made by Da Yang Biochemical Technology Co., Ltd. (Xuzhou, China). The monoclonal antibody (mAb) against SMZ, honey samples (the real samples were free of SMZ, as validated by HPLC-MS/MS) were provided by Wuxi Zodoboer Biotech. Co., Ltd. (Wuxi, China). Fifteen real samples for validation experiment were collected from local markets in Nanchang. The detective antigen, SMZ-BSA, was prepared in our lab by coupling SMZ to BSA through diazotization (Hu et al., Citation2018). All the solvents and other chemicals were of analytical reagent grade.
The sample pad, absorbent pad, and nitrocellulose membrane were purchased from Millipore, Inc. (Bedford, MA). The BioDot XYZ platform, which combined motion control with BioJet Quanti3050k and AirJet Quanti3050k dispensers, was acquired from BioDot (Irvine, CA). The fluorescence intensity strip reader for recording the signal of AIEFM-LFIA was custom made from Hangzhou Hemai Technology Co., Ltd. (China).
2.2. Synthesis of AIEFM and AIEFM-mAb
The AIEFM was obtained following the method in our previous work (Zhang et al., Citation2019a) with some modifications. Subsequently, the carboxyl group on the surface of AIEFM was activated by EDC to couple with an amino group on the surface of the mAb to obtain AIEFM-mAb. Briefly, AIEFM (0.4 mg) was dispersed in 1.0 mL of 0.2 M BB (pH 8.0). Subsequently, 10 μL of 10 mg/mL EDC and 10 μL of 10 mg/mL NHSS were added to the mixture and stirred for 2 h in the dark. The resulting solution was centrifuged at 13,500 rpm at 4°C for 20 min. The supernatant was discarded, and the resultant pellet was washed twice with water. The activated AIEFM was redissolved in 1.0 mL of 0.2 M BB (pH 8.0). Then, AIEFM-mAb formation was conducted as follows. The mAb solution (5 μL, 4.0 mg/mL) was added to the activated AIEFM (0.2 mg) under gentle stirring for 1 h. Subsequently, 0.2 mL of casein (1% wt/vol) was added for blocking the remaining active sites in the dark for 0.5 h. The resulting solution was centrifuged at 8000 rpm at 4°C for 25 min. The supernatant was discarded to remove the unreacted free mAb, and the resultant pellet was redissolved in 100 μL of PBS (0.01 M, pH 7.4).
2.3. Characterization of SMZ-BSA, AIEFM, and AIEFM-mAb
The detective antigen (SMZ-BSA) was characterized through UV-vis spectrometry. The hydration size of and polydispersity index (PDI) of the AIEFM and AIEFM-mAb were analysed by a particle size analyser (Nano-ZS, Malvern Instruments, Ltd., Worcestershire, UK).
2.4. Preparation of the AIEFM-LFIA test strip
The SMZ-BSA and goat anti-mouse antibody were diluted with 0.01 M PBS to final concentrations of 0.5 and 0.4 mg/mL, respectively. The two mixtures were applied to test (T) and control lines (C) on the nitrocellulose membrane and dried at 37°C overnight. The nitrocellulose membrane, conjugate pad, absorption pad, and pretreated sample pad were assembled as the AIEFM-LFIA test strip ().
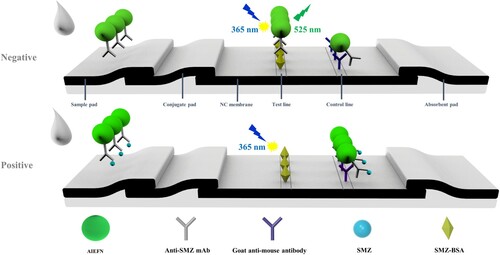
Figure 1. Schematic of the AIEFM-LFIA on the basis of competitive format immunoassay principle to analyse SMZ.
2.5. Assays with AIEFM-LFIA test strip
SMZ stock solution (5 mg/mL) was diluted in 0.01 M PBS (pH 7.4). As shown in , the negative or positive sample solution (100 µL) was mixed with the AIEFM-mAb complexes (4 µL) in different ELISA wells for 5 min and added to the AIEFM-LFIA test strip. After 25 min of reaction, the fluorescence intensity on the test line was recorded by using fluorescent intensity strip reader. All experiments were performed in triplicate. When the sample was free of SMZ (negative), the AIEFM-mAb labels migrated along the NC membrane under the action of capillary force and bound to SMZ-BSA immobilized on the T line. By contrast, the AIEFM-mAb labels would combine with free SMZ when the sample was presented SMZ (positive). The FIT changed from high to low as the concentration of SMZ increased. The AIEFM-mAb labels should be captured by goat anti-mouse IgG immobilized on the C line regardless of the presence of the SMZ.
2.6. Optimization of the key factors of the AIEFM-LFIA test strip
The coupling pH, amount of EDC, amount of mAb coupled to AIEFM, concentration of SMZ-BSA on the T line, amount of AIEFM-mAb label, and immunological kinetic reaction time were considered as critical parameters that can influence the detection performance of the proposed AIEFM-LFIA (Hu et al., Citation2017). In this study, single-factor analysis was performed to optimize the parameters of the proposed AIEFM-LFIA. The optimization details of AIEFM-LFIA were shown in the Supporting Information Method.
2.7. Sensitivity of AIEFM-LFIA
SMZ (0, 0.05, 0.1, 0.5, 1.0, 5.0, 10.0, 20.0, 50.0, 100.0, 200.0, or 500.0 ng/mL) was added to PBS. After determining the different concentrations of SMZ on AIEFM-LFIA, the standard curve was established using the logarithm of the concentration of SMZ versus FIT/FIT0. Here, FIT0 refers to the fluorescence intensity on the test line of the negative samples (non-spiked samples), whereas FIT represents the fluorescence intensity on the test line of the positive samples (SMZ-spiked samples). The limit of detection (LOD) was defined as the concentration of SMZ in the PBS that caused a decrease of 10% for FIT/FIT0 compared with that produced by the negative sample (Adrian et al., Citation2009). All experiments were performed in triplicate.
2.8. Specificity of the AIEFM-LFIA
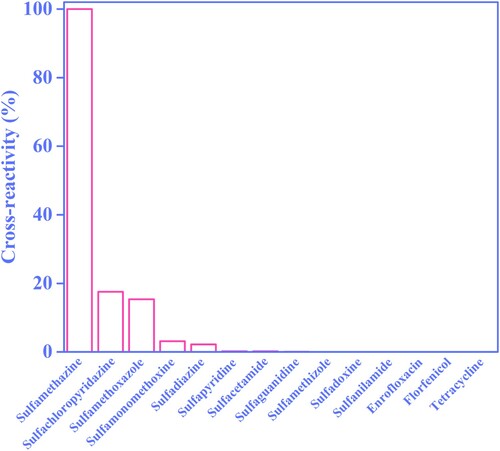
The specificity of the proposed method was evaluated using 11 SAs and 3 other antibiotic-spiked PBS. The cross-reactivity (CR) was calculated by comparing the half inhibitory concentration (IC50) of SMZ to other structural analogues. CR values were calculated as follows: CR% = (IC50 of SMZ/IC50 of analogues) × 100% (Huang, Xiong, Chen, Hu, & Lai, Citation2019). All experiments were performed in triplicate.
2.9. Detection of SMZ in real samples
2.9.1. Sensitivity of the proposed AIEFM-LFIA in honey
After pre-treatment of honey (Chen et al., Citation2017), negative honey samples fortified with different concentrations of SMZ (0, 0.05, 0.1, 0.5, 1.0, 5.0, 10.0, 20.0, 50.0, 100.0, 200.0, or 500.0 ng/mL) were analysed. The standard curve was established using the logarithm of the concentration of SMZ versus FIT/FIT0.
2.9.2. Recovery of SMZ in honey on the AIEFM-LFIA system
SMZ at different concentrations (honey: 0.2, 1.0, and 3.0 ng/mL) were added to negative honey samples. The recovery and coefficient of variation (CV) of SMZ in honey samples were quantitatively analysed on the AIEFM-LFIA system.
2.9.3. Analysis of HPLC-MS/MS
Fifteen honey real samples were selected and determined by the developed AIEFM-LFIA and HPLC-MS/MS to verify the reliability of the AIEFM-LFIA.
3. Results and discussion
3.1. Characterization of SMZ-BSA, AIEFM, and AIEFM-mAb
UV-vis spectra of SMZ-BSA was shown in Supporting Information Figure S-3. The spectra indicated that the SMZ-BSA exhibits the characteristic absorption peaks of both SMZ and BSA, indicating the successful preparation of the SMZ-BSA. Hydration particle size analysis was performed to determine the particle size of AIEFM and AIEFM-mAb ((A)). The sizes of AIEFM and AIEFM-mAb complex were 195 and 229 nm, respectively. The hydration layer of the AIEFM significantly increased after reacting with mAb, indicating that mAb was coupled on the AIEFM surface successfully. Moreover, the PDI of AIEFM was 0.199. After the combination of AIEFM with mAb, the PDI changed to 0.033. This result revealed the good dispersibility of AIEFM-mAb and the stability for application of its complexes in the proposed AIEFM-LFIA.
Figure 2. Characterization of AIEFM and AIEFM-mAb. Hydration size of AIEFM and AIEFM-mAb (A). Fluorescence spectrum of AIEFM (B). Digital photos of AIEFM under natural light (C). Digital photos of AIEFM under UV light (D).
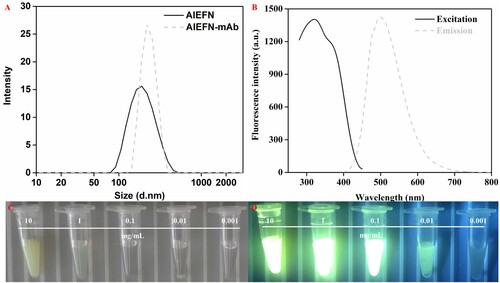
The fluorescence properties of AIEFM were observed in this study. As shown in (B−D), AIEFM had strong fluorescence intensity, and its maximum fluorescence intensity at a concentration of 0.05 mg/mL was 1403. AIEFM exhibited a large Stokes shift of 180 nm and had a broad excitation range. These fluorescence properties of AIEFM were beneficial to improving the detection performance of LFIA.
3.2. Optimization of the key factors of the AIEFM-LFIA test strip
3.2.1. Optimization of the coupling pH
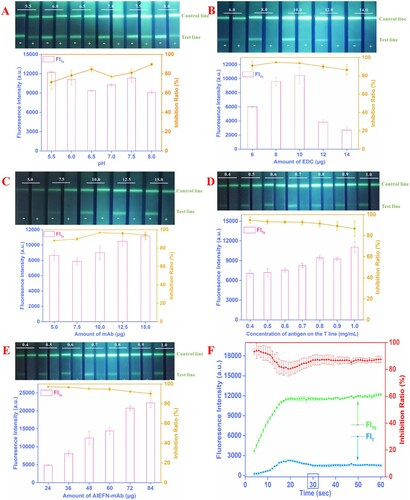
The coupling pH must be optimized because this factor can influence both coupling efficiency and mAb activity. In this section, optimal single key parameters were selected on the basis of two aspects: FIT0 and 1−FIT/FIT0 (Hu et al., Citation2018). In this study, a high FIT0 and FI inhibition ratio can enhance the sensitivity and broaden the detection range of AIEFM-LFIA. The carboxyl group of AIEFM was covalently coupled with the amino group of mAb. As shown in (A), although the fluorescence intensity on the line of AIEFM-LFIA had the strongest signal intensity of 12,234 at pH 5.5, relatively high FIT0 and FI inhibition ratio were observed at pH 7.5, compared with the data obtained at other coupling pH values. Therefore, pH 7.5 was chosen as the optimal coupling pH for the proposed AIEFM-LFIA. Higher pH values (>8.0) were not selected, given that AIEFM-mAb complexes preferred to cross-link or even congregate together, thus making the FIT0 considerably weak.
Figure 3. Optimization of the key factors of the AIEFM-LFIA test strips. Optimization of the coupling pH (A), usage volume of the EDC (B), amount of mAb to prepare the AIEFM-mAb label (C), concentration of SMZ-BSA on the T line (D), amount of the AIEFM-mAb label (E), and immunological kinetic analysis of the AIEFM-LFIA (F).
3.2.2. Optimization of the usage volume of the EDC
The amount of EDC may influence the coupling efficiency between AIEFM and mAb. As shown in (B), although the average inhibition ratio (94.1%) was maximum when the amount of EDC was 8 μg, the FIT0 was only 9506. The FIT0 (10,486) and FI inhibition ratio (93.8%) simultaneously reached a relatively high level when the amount of EDC was 10 μg compared with that of using 6 μg of EDC. Therefore, 10 μg of EDC was selected as the optimal condition during interaction between AIEFM and mAb.
3.2.3. Optimization of the amount of mAb to prepare AIEFM-mab
The effect of mAb amount on the preparation of AIEFM-mAb was observed by analysing the corresponding FIT0 and 1−FIT/FIT0. As shown in (C), when 10 µg of mAb was used, the maximum 1−FIT/FIT0 (96.7%) was found, and the FIT0 was 8992. However, the FIT0 and 1−FIT/FIT0 were 10,495 and 96.0%, respectively, when 12.5 µg of mAb was used. Therefore, 12.5 μg of mAb was selected as the optimal amount for coupling with the AIEFM.
3.2.4. Optimization of the concentration of SMZ-BSA on the T line
As shown in (D), relatively high FIT0 (9493) and 1−FIT/FIT0 (91.5%) were observed when the concentration of SMZ-BSA on the T line was 0.8 mg/mL. Therefore, 0.8 mg/mL was selected as the optimal concentration of SMZ-BSA on the T line for the AIEFM-LFIA.
3.2.5. Optimization of the amount of the AIEFM-mAb
The usage volume of AIEFM-mAb has a critical influence on the interaction among AIEFM-mAb complexes, SMZ-BSA, and SMZ. (E) revealed that the FIT0 of AIEFM-LFIA remarkably improved with the increase of the amount of AIEFM-mAb, and the strongest FIT0 of 22,266 was observed at 84 µg of AIEFM-mAb. However, the FIT0 and FI inhibition ratio at 72 µg of AIEFM-mAb were 20,767 and 92.3%, respectively, which were beneficial not only for enhancing the sensitivity but also for broadening the detection range of the AIEFM-LFIA. Therefore, 72 μg was regarded as the optimal amount of AIEFM-mAb.
3.2.6. Immunological kinetic analysis of the AIEFM-LFIA
Immunological kinetic analysis of the AIEFM-LFIA was performed by recording FIT0 and FIT every 1 min. Here, FIT0 and FIT represent the fluorescence intensity of the negative (PBS) and positive samples (PBS containing 10 ng/mL SMZ), respectively, on the T line over time. As shown in (F), FIT0 and 1−FIT/FIT0 gradually increased with time and ultimately reached a plateau. Therefore, in this study, 30 min was the optimal detection time for the developed AIEFM-LFIA.
3.3. Sensitivity of the AIEFM-LFIA in PBS
The standard curve of the AIEFM-LFIA was constructed by plotting corresponding FIT/FIT0 against the logarithm of the SMZ concentration. Supporting Information Figure S-4 showed that the regression equation of the AIEFM-LFIA in PBS was y = −0.33700 log (x) + 0.4330 (R2 = 0.9908), where y is FIT/FIT0 and x is the SMZ concentration. As shown in , the LOD of AIEFM-LFIA in PBS was 0.053 ng/mL, whereas the linear range of the AIEFM-LFIA in PBS was 0.05−10 ng/mL.
Table 1. Sensitivity and linear range of the AIEFM-LFIA in PBS and honey.
3.4. Specificity of AIEFM-LFIA
The specificity of the established AIEFM-LFIA was assessed by testing 11 SAs and 3 non-SA antibiotic drugs (enrofloxacin, florfenicol, tetracycline) in PBS. As shown in , the CR of the AIEFM-LFIA for SMZ detection in PBS was 100%. The CRs of the AIEFM-LFIA for detecting sulfachloropyridazine, sulfamethoxazole sulfamonomethoxine, sulfadiazine, sulfapyridine, sulfacetamide, sulfaguanidine, sulfamethizole, sulfadoxine, sulfanilamide, enrofloxacin, florfenicol, and tetracycline were 17.5%, 15.4%, 3.1%, 2.2%, 0.20%, 0.18%, 0.055%, 0.022%, 0.011%, 0.011%, 0.001%, 0.001%, and 0.001%, respectively. These results indicated that the AIEFM-LFIA can be used to specifically recognize SMZ.
Figure 4. Specificity of AIEFM-LFIA. The specificity of the proposed AIEFM-LFIA was assessed by testing 11 SAs and three non-SA antibiotic drugs (ENR, FLO, and TET).
3.5. Detection of SMZ in real samples
3.5.1. Standard curve of the AIEFM-LFIA in SMZ-spiked real samples
The standard curve of the proposed AIEFM-LFIA in honey was constructed by plotting FIT/FIT0 against the logarithm of the SMZ concentration. showed that the regression equation of the AIEFM-LFIA in honey sample was y = −0.3653 log (x) + 0.3372 (R2 = 0.9862), where y is FIT/FIT0 and x is the concentration of SMZ. As shown in , the LOD of the established AIEFM-LFIA in honey was 0.028 ng/mL, and the corresponding linear ranges were 0.05−5 ng/mL. A comparison of the linear range and LOD of the AIEFM-LFIA in this study with those in other works was presented in . The comparison revealed that AIEFM-LFIA for the detection of SMZ exhibited a great linear range and the lowest LOD, and indicated the AIEFM-LFIA can sensitively detect SMZ in the real sample. The above excellent results were due to the high fluorescence intensity and broad excitation-emission spectrum of AIEFM, which has a positive influence on enhancing the sensitivity of AIEFM-LFIA.
Figure 5. Standard calibration curves of the AIEFM-LFIA in honey were obtained by determining the FIT/FIT0 against the logarithm of the concentration of the SMZ.
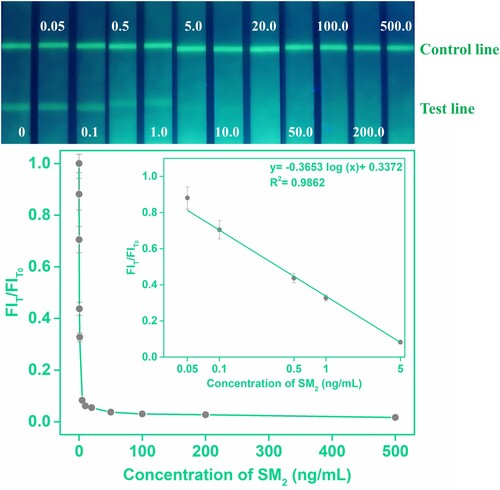
Table 2. Comparison of the proposed AIEFM-LFIA and other methods for SA detection in real samples.
3.5.2. Recovery of AIEFM-LFIA for detecting SMZ in honey
The recovery of AIEFM-LFIA for detecting SMZ in honey was evaluated (honey: 0.2, 1.0, and 3.0 ng/mL). revealed the average AIEFM-LFIA recoveries of 75.6–95.1% with CV of 5.7–12.9% in honey samples. These data indicated that the proposed competitive AIEFM-LFIA can reliably and precisely determine SMZ in honey samples.
Table 3. Recovery of SMZ on the AIEFM-LFIA in PBS and honey.
3.5.3. Detection of SMZ in 15 real samples
showed the detection results of 15 real samples from honey samples using the proposed AIEFM-LFIA and HPLC-MS/MS (the detailed information of HPLC-MS/MS data of the honey sample 11 was shown in the Supporting Information Figure S-5). The data obtained by AIEFM-LFIA and HPLC-MS/MS showed that 1 of 15 real samples was positive. The detection results of the competitive AIEFM-LFIA was compatible with that of the HPLC-MS/MS method.
Table 4. Detection of SMZ in 15 real samples using the AIEFM-LFIA and HPLC-MS/MS.
Luis and coworkers (Luis, Lavilla, Sánchez, Calvo, & Pérez, Citation2009) reported that the detection performance of two different formats to detect certain target was different. In fact, the sandwich format requires antibodies against two or more different antigenic sites, and the competitive format is a technique that uses a single antigenic site to allow antibodies to recognize targets in the sample. In view of the outstanding detection performance of AIEFM-LFIA based on the sandwich format in our previous study, the performance of the proposed competitive AIEFM-LFIA was evaluated in this work. Results indicated that the competitive AIEFM-LFIA possessed great sensitivity and accuracy, which was attractive and worthy to be popularized for the rapid detection of other analytes.
4. Conclusions
A novel competitive LFIA using AIEFM was successfully developed for the sensitive detection of SMZ in 15 real samples from honey. A comparison of the linear range and LOD of the competitive AIEFM-LFIA in this study revealed that competitive AIEFM-LFIA for detection of SMZ in real samples exhibited a satisfying linear range (0.05–5 ng/mL) and lower LOD (0.028 ng/mL). The recovery experiment and HPLC-MS/MS validation indicated that the developed competitive AIEFM-LFIA had good accuracy and reliability. From the above results, the proposed AIEFM-LFIA would be well suited for competitive format. Moreover, in view of the successful establishment of AIEFM-LFIA in sandwich format and competitive format, introducing AIEFM to the LFIA system may be a new strategy to promote the further development of LFIA.
Ethical approval
This article does not contain any studies with human participants or animals performed by any of the authors.
Supplemental Material
Download ()Disclosure statement
No potential conflict of interest was reported by the authors.
Additional information
Funding
Related Research Data
References
- Adrian, J., Pasche, S., Diserens, J. M., Sanchez-Baeza, F., Gao, H., Marco, M. P., & Voirin, G. (2009). Waveguide interrogated optical immunosensor (WIOS) for detection of sulfonamide antibiotics in milk. Biosensors & Bioelectronics, 24, 3340–3346. doi: 10.1016/j.bios.2009.04.036
- Barani, A., & Fallah, A. A. (2014). Occurrence of tetracyclines, sulfonamides, fluoroquinolones and florfenicol in farmed rainbow trout in Iran. Food and Agricultural Immunology, 26, 420–429. doi: 10.1080/09540105.2014.950199
- Chen, Y. Q., Chen, Q., Han, M. M., Liu, J. Y., Zhao, P., He, L. D., … Zhang, L. Y. (2016). Near-infrared fluorescence-based multiplex lateral flow immunoassay for the simultaneous detection of four antibiotic residue families in milk. Biosensors & Bioelectronics, 79, 430–434. doi: 10.1016/j.bios.2015.12.062
- Chen, Y. N., Guo, L. L., Liu, L. Q., Song, S. S., Kuang, H., & Xu, C. L. (2017). Ultrasensitive immunochromatographic strip for fast screening of 27 sulfonamides in honey and pork liver samples based on a monoclonal antibody. Journal of Agricultural and Food Chemistry, 65, 8248–8255. doi: 10.1021/acs.jafc.7b03190
- Chen, J. B., Zhou, X. F., Zhang, Y. L., & Gao, H. P. (2012). Potential toxicity of sulfanilamide antibiotic: Binding of sulfamethazine to human serum albumin. Science of the Total Environment, 432, 269–274. doi: 10.1016/j.scitotenv.2012.06.003
- Duan, Y. L., et al. (2016). Aggregation induced enhancement of linear and nonlinear optical emission from a hexaphenylene derivative. Advanced Functional Materials, 26, 8968–8977. doi: 10.1002/adfm.201602765
- Eyken, A., Furlong, D., Arooni, S., Butterworth, F., Roy, J. F., Zweigenbaum, J., & Bayen, S. (2019). Direct injection high performance liquid chromatography coupled to data independent acquisition mass spectrometry for the screening of antibiotics in honey. Journal of Food and Drug Analysis, 27, 679–691. doi: 10.1016/j.jfda.2018.12.013
- Galan-Malo, P., Pellicer, S., Perez, M. D., Sanchez, L., Razquin, P., & Mata, L. (2019). Development of a novel duplex lateral flow test for simultaneous detection of casein and beta-lactoglobulin in food. Food Chemistry, 293, 41–48. doi: 10.1016/j.foodchem.2019.04.039
- He, B. S., & Du, G. G. (2018). Novel electrochemical aptasensor for ultrasensitive detection of sulfadimidine based on covalently linked multi-walled carbon nanotubes and in situ synthesized gold nanoparticle composites. Analytical and Bioanalytical Chemistry, 410, 2901–2910. doi: 10.1007/s00216-018-0970-5
- Hu, S., Li, D. H., Huang, Z., Xing, K. Y., Chen, Y., Peng, J., & Lai, W. H. (2018). Ultra-sensitive method based on time-resolved fluorescence immunoassay for detection of sulfamethazine in raw milk. Food and Agricultural Immunology, 29, 1137–1149. doi: 10.1080/09540105.2018.1520816
- Hu, L. M., Luo, K., Xia, J., Xu, G. M., Wu, C. H., Han, J. J., … Lai, W. H. (2017). Advantages of time-resolved fluorescent nanobeads compared with fluorescent submicrospheres, quantum dots, and colloidal gold as label in lateral flow assays for detection of ractopamine. Biosensors & Bioelectronics, 91, 95–103. doi: 10.1016/j.bios.2016.12.030
- Huang, Z., Xiong, Z. J., Chen, Y., Hu, S., & Lai, W. H. (2019). Sensitive and matrix-tolerant lateral flow immunoassay based on fluorescent magnetic nanobeads for the detection of clenbuterol in swine urine. Journal of Agricultural and Food Chemistry, 67, 3028–3036. doi: 10.1021/acs.jafc.8b06449
- Ibarra, I. S., Miranda, J. M., Rodriguez, J. A., Nebot, C., & Cepeda, A. (2014). Magnetic solid phase extraction followed by high-performance liquid chromatography for the determination of sulphonamides in milk samples. Food Chemistry, 157, 511–517. doi: 10.1016/j.foodchem.2014.02.069
- Jiang, H., Zhang, W. J., Li, J., Nie, L. J., Wu, K. S., Duan, H., & Xiong, Y. H. (2018). Inner-filter effect based fluorescence-quenching immunochromotographic assay for sensitive detection of aflatoxin B1 in soybean sauce. Food Control, 94, 71–76. doi: 10.1016/j.foodcont.2018.06.030
- Kadziński, L., Banasiuk, R., & Banecki, B. (2018). Determination of ten sulfonamides in honey using tetrahydrofuran salting out liquid liquid extraction and monolithic silica column. LWT, 96, 7–12. doi: 10.1016/j.lwt.2018.05.007
- Karageorgou, E., Manousi, N., Samanidou, V., Kabir, A., & Furton, K. G. (2016). Fabric phase sorptive extraction for the fast isolation of sulfonamides residues from raw milk followed by high performance liquid chromatography with ultraviolet detection. Food Chemistry, 196, 428–436. doi: 10.1016/j.foodchem.2015.09.060
- Kim, H. J., Jeong, M. H., Park, H. J., Kim, W. C., & Kim, J. E. (2016). Development of an immunoaffinity chromatography and HPLC-UV method for determination of 16 sulfonamides in feed. Food Chemistry, 196, 1144–1149. doi: 10.1016/j.foodchem.2015.10.014
- Li, D. D., Liu, J. Z., Kwok, R. T. K., Liang, Z. Q., Tang, B. Z., & Yu, J. H. (2012). Supersensitive detection of explosives by recyclable AIE luminogen-functionalized mesoporous materials. Chemical Communications, 48, 7167–7169. doi: 10.1039/c2cc31890c
- Liu, N. M., Xing, K. Y., Wang, C., Zhang, G. G., Yuan, M. F., Li, D. F., … Peng, J. (2018). Matrix effect of five kinds of meat on colloidal gold immunochromatographic assay for sulfamethazine detection. Analytical Methods, 10, 4505–4510. doi: 10.1039/C8AY01322E
- Luis, R. D., Lavilla, M., Sánchez, L., Calvo, M., & Pérez, M. D. (2009). Development and evaluation of two ELISA formats for the detection of β-lactoglobulin in model processed and commercial foods. Food Control, 20, 643–647. doi: 10.1016/j.foodcont.2008.09.017
- Luo, J. D., Xie, Z. L., Lam, J. W. Y., Cheng, L., Chen, H. Y., Qiu, C. F., … Tang, B. Z. (2001). Aggregation-induced emission of 1-methyl-1,2,3,4,5-pentaphenylsilole. Chemical Communications, 1740–1741. doi:10.1039/b105159h
- Mei, J., Hong, Y. N., Lam, J. W. Y., Qin, A. J., Tang, Y. H., & Tang, B. Z. (2014). Aggregation-induced emission: The whole is more brilliant than the parts. Advanced Materials, 26, 5429–5479. doi: 10.1002/adma.201401356
- Panigrahi, A., Sahu, B. P., Mandani, S., Nayak, D., Giri, S., & Sarma, T. K. (2019). AIE active fluorescent organic nanoaggregates for selective detection of phenolic-nitroaromatic explosives and cell imaging. Journal of Photochemistry and Photobiology A: Chemistry, 374, 194–205. doi: 10.1016/j.jphotochem.2019.01.029
- Peng, D. P., Li, Z. Z., Wang, Y. L., Liu, Z. L., Sheng, F., & Yuan, Z. H. (2017). Enzyme-linked immunoassay based on imprinted microspheres for the detection of sulfamethazine residue. Journal of Chromatography A, 1506, 9–17. doi: 10.1016/j.chroma.2017.05.016
- Raeisossadati, M. J., Danesh, N. M., Borna, F., Gholamzad, M., Ramezani, M., Abnous, K., & Taghdisi, S. M. (2016). Lateral flow based immunobiosensors for detection of food contaminants. Biosensors & Bioelectronics, 86, 235–246. doi: 10.1016/j.bios.2016.06.061
- Reybroeck, W., Daeseleire, E., De Brabander, H. F., & Herman, L. (2012). Antimicrobials in beekeeping. Veterinary Microbiology, 158, 1–11. doi: 10.1016/j.vetmic.2012.01.012
- Shao, B., Dong, D., Wu, Y. N., Hu, J. Y., Meng, J., Tu, X. M., & Xu, S. K. (2005). Simultaneous determination of 17 sulfonamide residues in porcine meat, kidney and liver by solid-phase extraction and liquid chromatography–tandem mass spectrometry. Analytica Chimica Acta, 546, 174–181. doi: 10.1016/j.aca.2005.05.007
- Shi, C. Y., Deng, N., Liang, J. J., Zhou, K. N., Fu, Q. Q., & Tang, Y. (2015). A fluorescent polymer dots positive readout fluorescent quenching lateral flow sensor for ractopamine rapid detection. Analytica Chimica Acta, 854, 202–208. doi: 10.1016/j.aca.2014.11.005
- Shim, W. B., Kim, J. S., Kim, M. G., & Chung, D. H. (2013). Rapid and sensitive immunochromatographic strip for on-site detection of sulfamethazine in meats and eggs. Journal of Food Science, 78, M1575–M1581. doi: 10.1111/1750-3841.12232
- Su, R., Li, X. Y., Liu, W. L., Wang, X. H., & Yang, H. M. (2016). Headspace microextraction of sulfonamides from honey by hollow fibers coupled with ultrasonic nebulization. Journal of Agricultural and Food Chemistry, 64, 1627–1634. doi:10.1021/acs.jafc.5b05856
- Turnipseed, S. B., Storey, J. M., Lohne, J. J., Andersen, W. C., Burger, R., Johnson, A. S., & Madson, M. R. (2017). Wide-scope screening method for multiclass veterinary drug residues in fish, shrimp, and eel using liquid chromatography-quadrupole high-resolution mass spectrometry. Journal of Agricultural and Food Chemistry, 65, 7252–7267. doi: 10.1021/acs.jafc.6b04717
- Yang, L., Ni, H. J., Li, C. L., Zhang, X. Y., Wen, K., Ke, Y. B., … Wang, Z. H. (2019). Development of a highly specific chemiluminescence aptasensor for sulfamethazine detection in milk based on in vitro selected aptamers. Sensors and Actuators B: Chemical, 281, 801–811. doi: 10.1016/j.snb.2018.10.143
- Zhang, G. G., Chen, M. H., Liu, D. F., Xiong, Y. H., Feng, R. H., Zhong, P. H., & Lai, W. H. (2016). Quantitative detection of β2-adrenergic agonists using fluorescence quenching by immunochromatographic assay. Analytical Methods, 8, 627–631. doi: 10.1039/c5ay02585k
- Zhang, Y., Li, X. Q., Li, H. M., Zhang, Q. H., Gao, Y., & Li, X. J. (2019b). Antibiotic residues in honey: A review on analytical methods by liquid chromatography tandem mass spectrometry. TrAC Trends in Analytical Chemistry, 110, 344–356. doi: 10.1016/j.trac.2018.11.015
- Zhang, G. G., Xu, S. L., Xiong, Y. H., Duan, H., Chen, W. Y., Li, X. M., … Lai, W. H. (2019a). Ultrabright fluorescent microsphere and its novel application for improving the sensitivity of immunochromatographic assay. Biosensors & Bioelectronics, 135, 173–180. doi: 10.1016/j.bios.2019.04.023