
ABSTRACT
In this study we developed a rapid and simple assay to detect RFP in fish using an immunochromatographic assay. We produced a sensitive and selective monoclonal antibody against RFP with a half-maximal inhibitory concentration (IC50) of 10.7 ng/mL. Fish samples were extracted with ethyl acetate, then centrifuged at 8000 rpm for 10 min, and concentrated by drying over nitrogen. We found under optimal conditions, that the RFP cut-off limits for the test strip was 10 µg/mL in both 0.01 M phosphate buffered saline and fish samples, and each test could be completed within 5 min. Therefore, immunochromatographic test can be used as a reliable, rapid, and sensitive method for the detection of RFP in fish.
Introduction
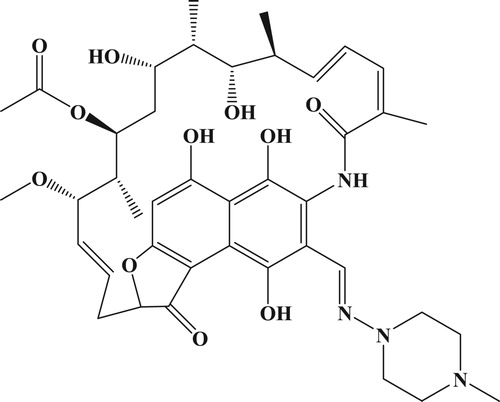
Rifampicin (RFP) or also known as rifampin () is an antibiotic that is usually used to treat several different types bacterial infections, including tuberculosis (TB), Mycobacterium avium complex, leprosy, and legionnaires disease. It is the most effective anti-TB drug known and usually used in clinical because it can inhibit β-subunit of prokaryotic DNA-dependet RNAPT and block the initiation of transcription (Kolmer et al., Citation2017). A high dose of RFP has common side effects, including nausea, vomiting, diarrhea, and loss of appetite and liver problems, or allergic reactions may also occur. Furthermore, continues use has further adverse effects, including abdominal pain, rashes, esophagitis and other gastrointestinal problems (Pereira et al., Citation2018; Sun et al., Citation2019).
Figure 1. Chemical structure of rifampicin.
It has been reported that RFP can be used to control bacterial diseases in fish such as columnaris disease caused by bacterial and viral infection (Olivares-Fuster & Arias, Citation2011). RFP can easily pass into the body because RFP is a fat-soluble compound. It produces residues in edible tissues of fish products, and therefore can potentially become harmful to human health. Furthermore, it can also cause drug resistance in the human body. Therefore, developing a sensitive, rapid, and efficient analytical detection method for both environmental and food safety monitoring is needed.
Conventional instrumental analyses, such as gas chromatography (Li et al., Citation2013; Mishra et al., Citation2017), high performance liquid chromatography (Chen et al., Citation2018; Ding et al., Citation2018; Gao et al., Citation2018; Sampaio Teixeira et al., Citation2018), and liquid chromatography-tandem mass spectrometry (Gao et al., Citation2017; Hasan et al., Citation2016; Oswald et al., Citation2011; Vu et al., Citation2014), are sensitive and accurate detection methods, but they are time consuming and need highly qualified personnel to run, and are expensive (Ge et al., Citation2018; Hao et al., Citation2018; Zhou et al., Citation2020).
For these reasons, immunoassays are becoming an increasingly popular alternative to detect analytes because they are relatively easy, low cost, sensitive, and can screen large numbers of samples (Shen et al., Citation2019; Song et al., Citation2019; Wang et al., Citation2019; Xu et al., Citation2019). Lateral flow immunochromatographic assays (LFIA) are a type of the immunoassay method whereby all reagents needed for the assay are sprayed onto the strip and they have several advantages over the above methods such as speed (results can be obtained within 5–10 min), specificity, simplicity, and sensitivity (Guo et al., Citation2019; Li et al., Citation2020b; Liu et al., Citation2019; Wang et al., Citation2020). To our knowledge, this is the first study to attempt to detect RFP in fish samples using a LFIA.
Materials and methods
Reagents and instruments
RFP was bought from J&K Scientific Ltd. (Shanghai, China). Gelatin, Freund’s complete adjuvant (FCA), and Freund’s incomplete adjuvant (FIA) were purchased from Beijing Biodee Biotechnology Co., Ltd. (Beijing, China). Bovine serum albumin (BSA), keyhole-limpet hemocyanin (KLH) were purchased from Sigma-Aldrich (St Louis, MO, USA). Enzyme immunoassay-grade horseradish peroxidase-labelled goat anti-mouse immunoglobulin was bought from Hua Mei Co. (Shanghai, China). All reagents used for cell fusion were acquired from Sunshine Biotechnology Co., Ltd. (Nanjing, China). Other chemicals and reagents were purchased from the National Pharmaceutical Group Chemical Reagent Co, Ltd. (Shanghai, China).
Use ultrapure water (Milli-Q purification system, Millipore Co., Bedford, MA, USA) to prepare all buffers and strip cutting using instrument HM3035 (Gold Bio, Shanghai, China). The nitrocellulose (NC) high-flow plus membranes (Pura-bind RP) were purchased from Whatman-Xinhua Filter Paper Co., Ltd. (Hangzhou, China), while the sample pad (CB-SB08), polyvinylchloride (PVC), and an absorption pad (SX18) were acquired from Goldbio Tech Co., Ltd. (Shanghai, China).
Preparation of antigen and monoclonal anti-RFP antibody
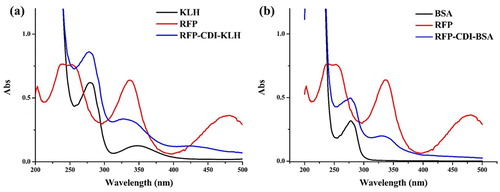
KLH and BSA was conjugated to RFP using the 1,1′-Carbonyldiimidazole (CDI) method (Liu et al., Citation2018). Briefly, RFP was diluted with N-N-dimethylformamide (DMF), then CDI was added and the mixture was stirred for 6– h in a water bath at 50°C (solution 1). KLH or BSA was diluted using 0.05 M carbonate buffer (pH 9.5) (solution 2). Solution 1 was then added dropwise to solution 2 (the pH was adjusted to 9 with 1 M NaOH). Stirred at room temperature for 24 h, and then RFP-CDI-KLH ((a)) and RFP-CDI-BSA ((b)) were dialyzed against 0.025 M carbonate buffer at room temperature for 3 d, and kept until use at −20°C. Finally, the resulting solution was characterized using UV–Vis spectrometry.
Figure 2. UV spectra characterization for; (a) RFP, KLH, and RFP-CDI-KLH, and (b) RFP, BSA, and RFP-CDI-BSA.
In this study, each mouse was injected the first immunization using FCA (100 µg; every 3 weeks) and for the subsequent booster injections using FIA (50 µg; 2–5 times). The spleen of the mice with the highest titer and lowest half-maximal inhibitory concentration (IC50) were detected using enzyme linked immunosorbent assay (ELISA) and sacrificed for cell fusion. The BALB/c mice were injected into the best cells line to produce monoclonal antibodies (mAbs). The caprylic acid-ammonium sulphate precipitation method was used to purify the ascites. The purified mAbs were stored at −20°C (Chen et al., Citation2019).
LFIA test device
Colloidal gold (CG) particle labelled mAb
Boiled and constantly stirred the solution of HAuCl4 (10 mM; 12.5 mL) and mixed with filtered (using a 0.22 µm filter membrane) ultrapure water (487.5 mL). After the mixture was boiled for 15 min, Added sodium citrate tribasic dehydrate (10%) (w/v; 1 mL) and continue stirring until the colour became a red-wine colour (30 min). Stopped heating the solution and cool at room temperature, and prior to antibody labelling, the gold nanoparticles (GNP) were stored at 4°C.
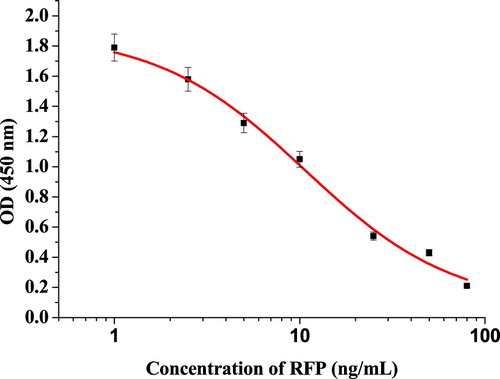
The purified anti-RFP mAb which had a IC50 of 10.7 ng/mL () was used to conjugate with CG-laballed mAb. K2CO3 (0.1M; 80 µL) was used to adjust the pH to 7.0 and this was then added into the 10 mL of GNP solution. Briefly, 0.4 mL of purified mAb was adjusted to a final concentration of 0.2 mg/mL with HEPES (0.05 M), and added into the CG and stand the mixture for 35 min at room temperature. Then, it was blocked for 2 h at room temperature with BSA (10% (w/v); 1 mL). After 2 h, the residual gold aggregates were removed by centrifuged for 45 min at 8000 rpm and 4°C. Removed the supernatant, and added 1 mL of resuspension buffer (0.02 M Tris-HCl, 0.1% Tween-20, 0.1% PEG, 1% PVP, 5% sucrose, 4% trehalose, 2% sorbitol, 1% mannitol. 0.04% NaN3, and 0.2% BSA), and stored at 4 °C.
Figure 3. Standard inhibition curve using ic-ELISA for rifampicin.
Test performance
The sensitivity of this assay was determined by testing RFP standards, which were used at the concentrations: 0, 0.1, 0.25, 0.5, 1, 2.5, 5, and 10 µg/mL in PBS (0.01 M, pH 7.4). The GNP labelled mAb (50 µL) was mixed with sample solution (150 µL). After 5 min of reaction, added the strip test. The lowest detection limit (LDL) was determined for 5 min by the naked eye as the amount of RFP that no red colour band on the test line compared the differences in colour intensity to 0 ng/mL of RFP. Each concentration was analyzed six times in the same day.
Extraction and determination of RFP in fish
Fish were purchased from market (Wuxi, China) and no RFP was detected in the samples. Approximately, 500 g of fish tissue was minced and kept at −20°C. Briefly, minced fish (2 g) was mixed with ethyl acetate (4 mL), vortex for 10 min, then centrifuge at 8000 rpm for 10 min in 4 °C. The resulting clear liquid was dried under nitrogen (40°C) and dissolved in PBST (10 mL, 0.01 M PBS plus Tween-20).
We spiked the fish samples with an RFP solution at a concentration (0, 0.1, 0.25, 0.5, 1, 2.5, 5, and 10 µg/mL). Each concentration were analyzed using the LFIA and was repeated for six times.
Result and discussion
Antigen characterization
A carrier protein was conjugated to RFP using the CDI method and to characterize the antigen was used UV-Vis spectrometry. (a) shows that RFP had two absorption peaks at approximately 250 and 335 nm, whereas the KLH had two high peaks at 280 and 350 nm, respectively, and RFP-CDI-KLH exhibited two maximum peaks at 275 and 335 nm. These results indicated that the RFP was conjugated successfully to KLH. As shown in (b), BSA had the highest peak at 270 nm, whereas RFP-CDI-BSA has two UV peaks at 275 and 328 nm, implying that the coating antigen was synthesized successfully.
Principle of the LFIA
highlights three parts of the strip test: (1) sample pads for running the sample, (2) NC membrane sprayed with the RFP-CDI-BSA as a coating antigen (test line) and control line sprayed with goat anti-mouse IgG antibody; and (3) absorbent pad to prevent the liquid leaking. If there is an RFP in the sample, it will compete with the RFP-CDI-BSA conjugate embedded in the test line for a limited number of anti-RFP mAb. When there enough RFP, the free RFP are combined with all marked mAbs to prevent mAbs from combining with the RFP-CDI-BSA in the test line. If RFP is absent, the limited amount of GNP labelled mAb is on the RFP-CDI-OVA, and a deep red band test line appears.
Figure 4. Illustration of typical strip test results.
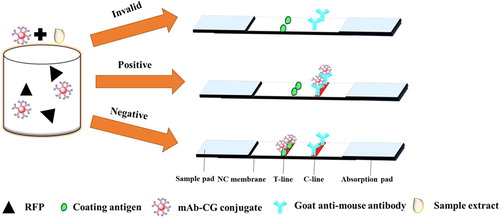
As shown in , the flow must reach the control line and also produces an indicator reaction. While the test line only appears when the sample is negative, and the control line always appears in the successful test. The result is positive if the red band only appears on the control line. If no line is displayed, the test process fails or the test is invalid.
Optimization of the strip test
The materials that compose the LFIA must be hydrophilic and have consistent flow characteristics. The NC membrane material is hydrophobic but in addition of rewetting agents (surfactants) during process, it can be rendered hydrophilic. The choice of optimal surfactant reagent is one of the most important factors during the development of these assays. In this study, resuspension buffer was added to four different of reagents (polyvinylpyrrolidone (PVP), polyethylene glycol (PEG), BSA, and Rhodasurf® On-870). As shown in (a), PEG produced the best and most stable colour reactions, and it was used in the downstream experiments.
Figure 5. Result of optimization of immunochromatographic strip with 0.01 M PBS (pH 7.4). (a) Optimization using four kinds of surfactants; (A) PVP, (B) PEG, (C) BSA, and (D) Rhodasurf® On-870. (b) The dosage of the mAb that added in GNP; (A) 10 µg/mL, and (B) 8 µg/mL. Standard concentration; (1) 0 µg/mL, and (2) 5 µg/mL.
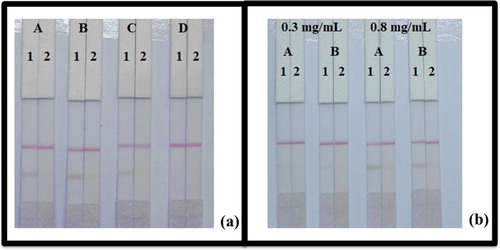
While performing the strip test, the concentration of mAb while labelled with GNP and coating antigen affects the assay sensitivity. We using two different concentration of mAb (8 and 10 µg/mL) while labelled with GNPs. As shown in (b), there are significant different between 8 and 10 µg/mL concentration in colour intensity. The mAb amount of 10 µg/mL gave a stable colour and no inhibition on RFP- positive samples. Meanwhile, we also found that the colour intensity of coating antigen concentration was different. Result the colour of 0.8 mg/mL coated antigen had darker colour intensities than 0.3 mg/mL. Therefore, the best condition for the determination of RFP in PBS (0.01 M; pH 7.4) was 0.8 mg/mL of coated antigen and 10 µg/mL of mAb.
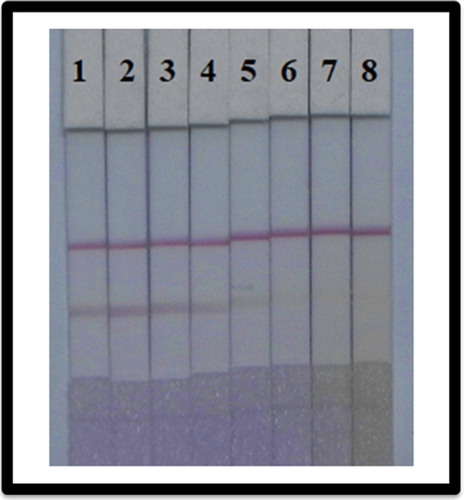
We use RPF dilution series as the assay sensitivity. The cut-off value or LDL was set as comparing the negative and positive control, while added RFP concentration would produce a visible colour of the test strip. As shown in , we detected RFP with concentrations of 0, 0.1, 0.25, 0.5, 1, 2.5, 5, and 10 µg/mL in PBS (0.01 M; pH 7.4). As can see that with the increase of RFP concentration, the colour intensity will weaken, and finally disappear completely at 10 µg/mL RFP.
Figure 6. LFIA after optimization (1–8) represents concentrations of 0, 0.1, 0.25, 0.5, 1, 2.5, 5, and 10 µg/mL.
Determination of RFP in fish
The test was performed on fish muscle to demonstrate the utility of the method. The monitoring of food residues was important as it can impact on consumer health. Firstly, extraction of RFP from fish is needed and represents an important step before running the LFIA because large amounts of protein and fat on fish tissue which should be minimized.
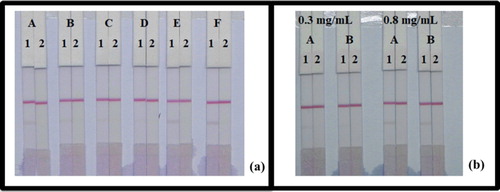
In this study, the resuspension buffer was added to six different reagents, PVP, PEG, BSA, brij-35, triton X-100, and Rhodasurf® On-870. As shown in (a), reagents Rhodasurf® On-870 gave the best and most stable colour reaction. As shown in (b), there were significant differences in colour intensity, between the 8 and 10 µg/mL amount of mAb labelled GNP. We observed that the optimal concentration of mAb to GNPs was 10 µg/mL, and the colour intensity of coating solution was different at 0.3 and 0.8 mg/mL. When the concentration of coating antigen was 0.3 mg/mL, the colour intensity of the T line was weaker than that of 0.8 mg/mL.
Figure 7. Optimization of LFIA in fish. (a) Result using six kinds of reagents; (A) PVP, (B) PEG, (C) BSA, (D) Brij-35, (E) Triton X-100, and (F) Rhodasurf® On-870. (b) The dosage of the mAb that added in GNP; (A) 10 µg/mL, and (B) 8 µg/mL. Standard concentration; (1) 0 µg/mL, and (2) 5 µg/mL.
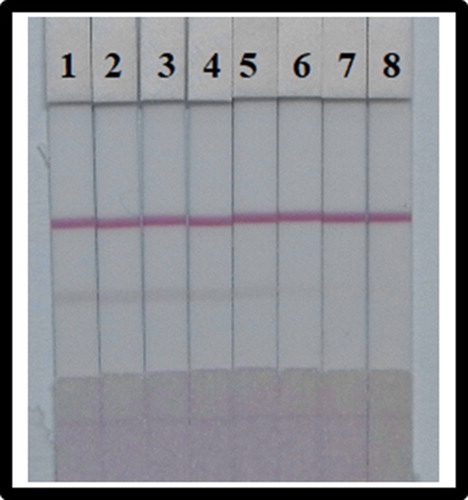
We also determined the effect of the substrate on the ability of LFIA to detect RFP in fish. Using Rhodasurf® On-870 as reagent, the concentration of coated antigen was 0.8 mg/mL, and the concentration of mAb with the GNPs was 10 µg/mL, which is the best condition to detect RFP in fish tissue. The fish samples were spiked with RFP standards at concentrations of 0, 0.1, 0.25, 0.5, 1, 2.5, 5, and 10 µg/mL. shows that with the increase of RFP concentration, the colour intensity decreased and finally disappeared completely at 10 µg/mL. All results produced developed within 5 min.
Figure 8. Colloidal gold immunochromatographic assay spiked in fish. After optimization (1–8) represents concentrations of 0, 0.1, 0.25, 0.5, 1, 2.5, 5, and 10 µg/mL.
When compared to other methods we have found that high performance liquid chromatography–tandem mass spectrometry is able to detect RFP in aquatic products with a limit of detection was 0.25 µg/kg (Li et al., Citation2020a) and in human plasma the lower limits were 200–400 ng/mL (Gao et al., Citation2018). Similarly, liquid chromatography coupled with tandem mass spectrometry was able to detect RFP in horse plasma as low as 2.5 ng/mL (Oswald et al., Citation2011) and in human plasma 0.20–30.0 mg/L (de Velde et al., Citation2009). These methods are used because of their high sensitivity and accuracy, but they are time consuming (need time for machine preparation and pretreatment). Therefore, the LFIA is fast and simple analytical method for the detection of analytes.
Conclusions
A rapid and sensitive LFIA method was developed to detect RFP and a sensitive coating antigen (RFP-CDI-BSA) and anti-RFP mAb was produced. The method used to extract RFP from fish tissue was designed to minimize the effects of matrix interference on the assay sensitivity. Under the best condition, for 0.01 M PBS (pH 7.4), the detection limit for RFP using LFIA was 10 µg/mL. The optimal conditions for the determination of RFP in fish were 0.8 mg/mL of the concentration of coated antigen and the amount of mAb in GNP was 10 µg/mL. With 5 min of the assay, the RFP that spiked in fish had cut-off value of 10 µg/mL. We conclude that the LFIA represents a rapid and simple method for the detection of RFP in fish. In the future, the development of both a sensitive and rapid screen for RFP is desirable.
Acknowledgements
This work is financially supported National Key R & D Program (2016YFD0501208, 2016YFF0202300) and grants from Natural Science Foundation of Jiangsu Province and MOF (BE2016307, BK20150145, BX20151038, BK20140003, BE2014672, CMB21S1614, 201513006).
Disclosure statement
No potential conflict of interest was reported by the author(s).
Additional information
Funding
References
- Chen, B., Chen, L., Cheng, C., Zhong, M., Shi, X., Zhang, J., & Wang, B. (2018). Determination of telbivudine in the plasma of chronic hepatitis B patients in long-term treatment by high-performance liquid chromatographic-tandem mass spectrometry. Biomedical Chromatography, 32. https://doi.org10.1002/bmc.4140
- Chen, Z., Wu, X., Xu, L., Liu, L., Kuang, H., & Cui, G. (2019). Development of immunocolloidal strip for rapid detection of pyrimethanil. Food and Agricultural Immunology, 30(1), 1239–1252. https://doi.org/10.1080/09540105.2019.1677566
- de Velde, F., Alffenaar, J.-W. C., Wessels, A. M. A., Greijdanus, B., & Uges, D. R. A. (2009). Simultaneous determination of clarithromycin, rifampicin and their main metabolites in human plasma by liquid chromatography-tandem mass spectrometry. Journal of Chromatography B-Analytical Technologies in the Biomedical and Life Sciences, 877(18-19), 1771–1777. https://doi.org/10.1016/j.jchromb.2009.04.038
- Ding, B., Yang, W., Xu, H., Yin, Y., Bi, K., & Li, Q. (2018). Determination of related substances in ethambutol hydrochloride, pyrazinamide, rifampicin and isoniazid tablets by HPLC. Journal of Shenyang Pharmaceutical University, 35, 750–755.
- Gao, C., Bergagnini-Kolev, M. C., Liao, M. Z., Wang, Z., Wong, T., Calamia, J. C., Lin, Y. S., Mao, Q., & Thummel, K. E. (2017). Simultaneous quantification of 25-hydroxyvitamin D-3-3-sulfate and 25-hydroxyvitamin D-3-3-glucuronide in human serum and plasma using liquid chromatography-tandem mass spectrometry coupled with DAPTAD-derivatization. Journal of Chromatography B-Analytical Technologies in the Biomedical and Life Sciences, 1060, 158–165. https://doi.org/10.1016/j.jchromb.2017.06.017
- Gao, S., Wang, Z., Xie, X., You, C., Yang, Y., Xi, Y., & Chen, W. (2018). Rapid and sensitive method for simultaneous determination of first-line anti-tuberculosis drugs in human plasma by HPLC-MS/MS: Application to therapeutic drug monitoring. Tuberculosis, 109, 28–34. https://doi.org/10.1016/j.tube.2017.11.012
- Ge, W., Suryoprabowo, S., Xu, L., Zheng, Q., & Kuang, H. (2018). Rapid detection of penbutolol in pig urine using an immunochromatographic test strip. Food and Agricultural Immunology, 29(1), 1126–1136. https://doi.org/10.1080/09540105.2018.1520203
- Guo, L., Liu, L., Cui, G., Ma, S., Wu, X., & Kuang, H. (2019). Gold immunochromatographic assay for kitasamycin and josamycin residues screening in milk and egg samples. Food and Agricultural Immunology, 30(1), 1189–1201. https://doi.org/10.1080/09540105.2019.1677567
- Hao, K., Suryoprabowo, S., Song, S., Liu, L., & Kuang, H. (2018). Rapid detection of zearalenone and its metabolite in corn flour with the immunochromatographic test strip. Food and Agricultural Immunology, 29(1), 498–510. https://doi.org/10.1080/09540105.2017.1406461
- Hasan, M., Siegmund, W., & Oswald, S. (2016). Rapid LC-MS/MS method for the determination of 4-hydroxycholesterol/cholesterol ratio in serum as endogenous biomarker for CYP3A activity in human and foals. Journal of Chromatography B-Analytical Technologies in the Biomedical and Life Sciences, 1033, 193–199. https://doi.org/10.1016/j.jchromb.2016.08.006
- Kolmer, E. W. J., Teulen, M. J. A., van den Hombergh, E. C. A., van Erp, N. E., te Brake, L. H. M., & Aarnoutse, R. E. (2017). Determination of protein-unbound, active rifampicin in serum by ultrafiltration and ultra performance liquid chromatography with UV detection. A method suitable for standard and high doses of rifampicin. Journal of Chromatography B-Analytical Technologies in the Biomedical and Life Sciences, 1063, 42–49. https://doi.org/10.1016/j.jchromb.2017.08.004
- Li, Q., Cao, J., Han, G., Liu, H., Yan, J., Wu, L., & Li, J. (2020a). Quantitative determination of rifampicin in aquatic products by stable isotope-dilution high liquid chromatography-tandem mass spectrometry. Biomedical Chromatography: BMC, e4810–e4810. https://doi.org/10.1002/bmc.4810
- Li, S., Zhao, J., Li, Z., & Liu, Y. (2013). Determination of residual solvents in rifampicin by headspace gas chromatography. Chinese Journal of Antibiotics, 38, 601–605.
- Li, Y., Liu, L., Kuang, H., & Xu, C. (2020b). Preparing monoclonal antibodies and developing immunochromatographic strips for paraquat determination in water. Food Chemistry, 311. https://doi.org/10.1016/j.foodchem.2019.125897
- Liu, L., Xu, L., Suryoprabowo, S., Song, S., & Kuang, H. (2018). Development of an immunochromatographic test strip for the detection of ochratoxin A in red wine. Food and Agricultural Immunology, 29(1), 434–444. https://doi.org/10.1080/09540105.2017.1401043
- Liu, Z., Liu, L., Cui, G., Wu, X., & Kuan, H. (2019). Development of an immunochromatographic strip assay based on a monoclonal antibody for detection of cimaterol. Food and Agricultural Immunology, 30(1), 1162–1173. https://doi.org/10.1080/09540105.2019.1674787
- Mishra, V. K., Passari, A. K., Chandra, P., Leo, V. V., Kumar, B., Uthandi, S., Thankappan, S., Gupta, V. K., & Singh, B. P. (2017). Determination and production of antimicrobial compounds by Aspergillus clavatonanicus strain MJ31, an endophytic fungus from Mirabilis jalapa L. Using UPLC-ESIMS/MS and TD-GC-MS analysis. PLoS One, 12. https://doi.org/10.1371/journal.pone.0186234
- Olivares-Fuster, O., & Arias, C. R. (2011). Development and characterization of rifampicin-resistant mutants from high virulent strains of Flavobacterium columnare. Journal of Fish Diseases, 34(5), 385–394. https://doi.org/10.1111/j.1365-2761.2011.01253.x
- Oswald, S., Peters, J., Venner, M., & Siegmund, W. (2011). LC-MS/MS method for the simultaneous determination of clarithromycin, rifampicin and their main metabolites in horse plasma, epithelial lining fluid and broncho-alveolar cells. Journal of Pharmaceutical and Biomedical Analysis, 55(1), 194–201. https://doi.org/10.1016/j.jpba.2011.01.019
- Pereira, M. N., Matos, B. N., Gratieri, T., Cunha-Filho, M., & Gelfuso, G. M. (2018). Development and validation of a simple chromatographic method for simultaneous determination of clindamycin phosphate and rifampicin in skin permeation studies. Journal of Pharmaceutical and Biomedical Analysis, 159, 331–340. https://doi.org/10.1016/j.jpba.2018.07.007
- Sampaio Teixeira, K. S., da Cruz Fonseca, S. G., Brigido de Moura, L. C., Ribeiro de Moura, M. L., Pinheiro Borges, M. H., Barbosa, E. G., & Accioly de Lima e Moura, T. F. (2018). Use of chemometrics to compare NIR and HPLC for the simultaneous determination of drug levels in fixed-dose combination tablets employed in tuberculosis treatment. Journal of Pharmaceutical and Biomedical Analysis, 149, 557–563. https://doi.org/10.1016/j.jpba.2017.11.001
- Shen, X., Liu, L., Xu, L., Ma, W., Wu, X., Cui, G., & Kuang, H. (2019). Rapid detection of praziquantel using monoclonal antibody-based ic-ELISA and immunochromatographic strips. Food and Agricultural Immunology, 30(1), 913–923. https://doi.org/10.1080/09540105.2019.1641068
- Song, S., Suryoprabowo, S., Liu, L., Kuang, H., Xu, L., Ma, W., & Wu, X. (2019). Development of monoclonal antibody-based colloidal gold immunochromatographic assay for analysis of halofuginone in milk. Food and Agricultural Immunology, 30(1), 112–122. https://doi.org/10.1080/09540105.2018.1550058
- Sun, J., Zhu, D., Xu, J., Jia, R., Chen, S., Liu, M., Zhao, X., Yang, Q., Wu, Y., & Zhang, S. (2019). Rifampin resistance and its fitness cost in Riemerella anatipestifer. BMC Microbiology, 19. https://doi.org/10.1186/s12866-019-1478-7
- Vu, D. H., Koster, R. A., Bolhuis, M. S., Greijdanus, B., Altena, R. V., Nguyen, D. H., Brouwers, J. R. B. J., Uges, D. R. A., & Alffenaar, J. W. C. (2014). Simultaneous determination of rifampicin, clarithromycin and their metabolites in dried blood spots using LC-MS/MS. Talanta, 121, 9–17. https://doi.org/10.1016/j.talanta.2013.12.043
- Wang, Z., Wu, X., Liu, L., Xu, L., Kuang, H., & Xu, C. (2020). Rapid and sensitive detection of diclazuril in chicken samples using a gold nanoparticle-based lateral-flow strip. Food Chemistry, 312. https://doi.org/10.1016/j.foodchem.2019.126116
- Wang, Z., Zhang, J., Liu, L., Wu, X., Kuang, H., Xu, C., & Xu, L. (2019). A colorimetric paper-based sensor for toltrazuril and its metabolites in feed, chicken, and egg samples. Food Chemistry, 276, 707–713. https://doi.org/10.1016/j.foodchem.2018.10.047
- Xu, X., Liu, L., Cui, G., Wu, X., & Kuang, H. (2019). Development of an immunochromatography assay for salinomycin and methyl salinomycin in honey. Food and Agricultural Immunology, 30(1), 995–1006. https://doi.org/10.1080/09540105.2019.1649370
- Zhou, S., Kuang, H., & Liu, L. (2020). Development of an ic-ELISA and colloidal gold strip for the detection of the beta-blocker carazolol. Food and Agricultural Immunology, 31(1), 217–230. https://doi.org/10.1080/09540105.2019.1710113