
 ?Mathematical formulae have been encoded as MathML and are displayed in this HTML version using MathJax in order to improve their display. Uncheck the box to turn MathJax off. This feature requires Javascript. Click on a formula to zoom.
ABSTRACT
In this study, we developed a monoclonal antibody against picoxystrobin (PIC). After cell fusion, four cell lines (3C2, 4D1, 4G4 and 5D4) capable of producing monoclonal antibodies against oxystrobin were obtained. The monoclonal antibody produced by the cell line 3C2 was the most sensitive to PIC, and its IC50 value was 0.1 ng/ml. The monoclonal antibody was then used to prepare immunochromatographic strips, and its cut-off values in both phosphate-buffered saline solution and cucumber samples were 50 and 100 ng/ml, respectively. It was concluded that the ICS can sensitively and rapidly detect PIC in cucumber samples.
Introduction
Picoxystrobin (PIC) is a methoxy acrylate fungicide that exerts its effect by binding to the Qo site of cytochrome b, thereby blocking electron transfer between cytochrome b and cytochrome c1 and inhibiting mitochondrial respiration (Domingues et al., Citation2017). It is mainly used for disease control in most crops, especially wheat, barley and oat, where it inhibits yellow, brown and crown rust caused by Puccinia basidiomycetes (Esteve-Turrillas et al., Citation2010). It can be quickly absorbed by plant tissues for early prevention and treatment purposes (Ruske et al., Citation2003) and it has been reported that British farmers will apply fungicides early to control eye spot and leaf disease.
When humans and other animals (such as cockroaches and zebrafish) are exposed to trace amounts of methoxy acrylate fungicides, it can cause adverse effect to health(Jia et al., Citation2018; Schnug et al., Citation2015; Viñas et al., Citation2010). In humans, exposure can result in eye and respiratory irritation, weakness, dizziness, redness of the skin and chest pains (Kolosova et al., Citation2017). Therefore, in order to protect human health, it is necessary to quickly detect, with high sensitivity, these substances present in the environment.
Currently, the most commonly used methods for the detection of PIC residues are high performance liquid chromatography (HPLC) (Liang et al., Citation2013), gas chromatography-mass spectrometry (GC-MS) (Viñas et al., Citation2009) and ultra-high liquid chromatography-mass spectrometry/mass spectrometry (UPLC-MS/MS) (Gao et al., Citation2019). Recently however, new detection methods have been developed, such as fluorescence polarization immunoassay (Kolosova et al., Citation2017), electrochemical determination of PIC on doped diamond electrodes (Dornellas et al., Citation2015), anodic stripping voltammetry on metal film modified glass carbon electrodes (Dornellas et al., Citation2013) and solidification by floating the organic droplets subjected to air-assisted liquid–liquid micro extraction (Kolosova et al., Citation2017). However, these methods require expensive instruments, specialized technicians and are time consuming. In terms of practical applications, immunochromatographic methods are inexpensive, simple, fast and safe, and have other advantages such as that all reagents are included in the strip and results are available within 5–10 min. However, currently there has been no research into the development of immunochromatographic strips (ICSs) for the detection of PIC. Therefore, in this study, we have developed an ICS for the detection of PIC based on its monoclonal antibody and used this approach for the rapid detection of PIC in foodstuff.
Materials and methods
Reagents
The plant hormone gibberellin was purchased from J&K Scientific Ltd. (Beijing, China). N, N′-Carbonyldiimidazole (CDI), Keyhole limpet haemocyanin (KLH), ovalbumin (OVA), 3,3′,5,5′-tetramethylbenzidine (TMB), Freund’s complete adjuvant (FCA), Freund’s incomplete adjuvant (FIA) and gold chloride trihydrate were obtained from Sigma–Aldrich (St Louis, MO, USA). hypoxanthine–aminopterin–thymidine supplement (HAT), RPMI-1640 cell culture medium, hypoxanthine–thymidine supplement (HT), polyethylene glycol (PEG) 1500 and foetal calf serum were purchased from Gibco BRL (Paisley, UK). All reagents and solvents were of analytical grade.
The test strip materials were obtained from JieYi Biotech. Co. Ltd. (Shanghai, China), including a glass fibre membrane, a nitrocellulose membrane (NC), a H5076 filter, and polyethylene (PVC) adhesive card.
Buffer solutions
Carbonate buffer (CB, pH 9.6) was used as the coating solution and carbonate buffer plus 0.2% gelatin was used for the blocking solution. Phosphate-buffered saline solution (PBS, 0.01 M, pH 7.4) was used as the assay buffer and the wash buffer was produced by adding 0.05% Tween-20 to PBS (PBST).
Hapten synthesis
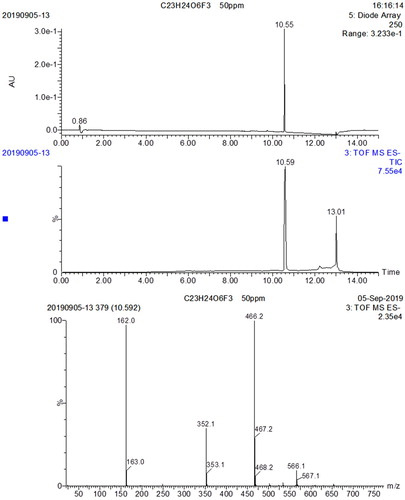
The structure of the synthesized hapten is shown in . The synthesis of compound 2, involved using a solution of 6-bromohexanoic acid (5 g, 25.6 mmol) in THF (50 mL) which was added to TFAA (10.5 g, 51.2 mmol) dropwise at 0°C. The reaction was stirred at 0°C for 2 h, and then tert-butyl alcohol (9.5 g, 128.4 mmol) was added and the mixture was stirred further at RT overnight. The solvent was removed under reduced pressure and the residue was diluted with EA, washed with 0.1 N NaHCO3, dried over Na2SO4 and concentrated to give compound 2 (5 g) as a yellow oil and the yield was 78.1%. To synthesize compound 4, a solution of LiOH (1.14 g, 27.2 mmol) and Bu4NHSO4 (918 mg, 2.7 mmol) in THF/H2O (15 mL/5 mL) was added to compound 3 (1 g, 2.7 mmol) in stages and stirred at RT overnight. The mixture was then poured into water (30 mL), adjusted to pH 3 with NaHSO4 and extracted with EA. The organic layers were dried over Na2SO4 and concentrated. The residue was purified by silica column elution with PE/EA (25:1) to give compound 4 (600 mg). To synthesize compound 5, a solution of compound 4 (1 g, 2.83 mmol) in DMF (10 mL) was added to Cs2CO3 (1.1 g, 3.4 mmol). After 15 min, tert-butyl 6-bromohexanoate (1.42 g, 5.66 mmol) was added and the reaction was stirred at RT overnight. The mixture was then poured into water (50 mL) and extracted with EA. The organic layers were dried over Na2SO4 and concentrated. The residue was purified by silica column eluted with PE/EA (10:1) to give compound 5 (1 g). Lastly, to Synthesize the target hapten, a solution of compound 5 (900 mg, 1.7 mmol) in DCM (10 mL) was added to TFA (5 mL) at 0°C. After addition, the reaction was stirred for an hour, then warmed to room temperature and stirred for half an hour. The mixture was then diluted with water (30 mL) and extracted with DCM. The organic layer was dried over Na2SO4 and concentrated. The residue was purified by prep-HPLC to give the hapten (260 mg). The LC-MS profile for the hapten is shown in .
Figure 1. Hapten synthesis of picoxystrobin.
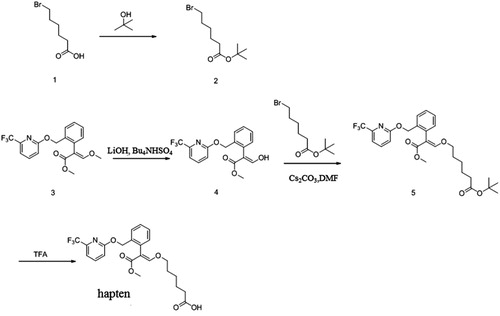
Figure 2. The LC-MS of the picoxystrobin hapten.
Antigen preparation
Picoxystrobin was covalently linked to BSA with EDC to synthesize the immunogen PIC-EDC-BSA. Specifically, PIC (4.2 mg), EDC (3.1 mg) and N-hydroxysuccinimide (5.1 mg) were dissolved in 300 μL of anhydrous N,N-dimethylformamide (solution A) at room temperature and stirred for 8 h and BSA (10 mg) was dissolved in 5 mL borate buffer solution (solution B). Finally, solution A and solution B were mixed and allowed to react at room temperature overnight. The product of this reaction is the immunogen PIC-EDC-BSA. The coating antigen PIC-EDC-OVA was prepared in a similar manner.
Monoclonal antibody (mAb) preparation and characterization
Here we used 6–8-week-old female BALB/c mice, and for the first immunization, 100 µg of immunogen was emulsified with an equal volume of FCA and subcutaneously injected into the back of the mouse (Lan et al., Citation2019). Booster immunizations were performed every three weeks, (50 µg) whereby the immunogen was emulsified with an equal volume of FIA and again injected subcutaneously into the back of the mouse. After each boost, the specificity of the antibodies in the sera was tested using ic-ELISA. After the fifth immunization, mice with the highest titre and the best specificity for picoxystrobin were selected, and 25 μg of the immunogen was dissolved in 100 μL of physiological saline, and the mice were immunized by intraperitoneal injection (Li et al., Citation2019).
After three days of sprint immunization, cell fusion was performed. Splenocytes were fused with SP2/0 cells using PEG 1500, and then dispensed into 96-well culture plates and cultured at 37°C. The supernatant from the cells was examined by ic-ELISA one week later. After three subclones were examined, the best cell lines were screened and cultured on a large scale. The cell line was injected into the abdominal cavity of the mouse to produce ascites. After 7–10 days, ascites (octanoic acid-saturated ammonium sulfate method) were collected and purified to obtain mAbs and after three days of dialysis, the mAb was stored at −20°C.
Sensitivity and specificity of the mAb was evaluated using an ic-ELISA. The half-maximal inhibitory concentration (IC50) calculated from the standard curve, were used to characterize the degree of mAb sensitivity. Specificity of the anti-diclazuril mAb was investigated using a cross-reactivity (CR) approach with analytes, including Cyazofamid, Pyraclostrobin and Fluoxastrobin. CR of mAb against each structurally related analogue was calculated using:
Development of an ICS assay for picoxystrobin detection
Preparation of gold nanoparticles
Ultrapure water was filtered through a transfer film (0.22 μm) to prepare 25 mL of a 0.1 g/L chloroauric acid solution and the mixture was heated to boiling and stirred and then 1 mL of solution at 1% W/V was added. The alkali dihydrate solution was stirred for 30 min until the colour became burgundy, it was then cooled to room temperature to obtain gold nanoparticles of uniform diameter (15 nm) (Ye et al., Citation2018).
Preparation of colloidal gold-labeled mAb
We selected the most specific and sensitive mAb to PIC for the next step. The pH of 10 ml of colloidal gold solution was then adjusted to 7.0 with 0.1 M K2CO3 and 0.4 ml of mAb was added dropwise to the solution and after stirring for 2 h, the gold aggregate was removed by centrifugation (10,000 × g, 30 min) (Ge et al., Citation2018). After the solution was layered, the lower layer containing the red gold-labeled mAb was collected and washed with a 0.02 M phosphate buffer solution (5% sucrose, 1% BSA and 0.5% PEG 6000). The combined product was reconstituted to 1 mL with gold-labeled resuspension buffer (0.02 M PBS, 5% sucrose, 2% sorbitol, 1% mannitol, 0.1% PEG, 0.1% Tween and 0.04% NaN3) and stored at 4°C (Chen et al., Citation2019).
Preparation of NC capture membrane
A capture reagent for the test strip control line was coated with a coating antigen (PIC-EDC-OVA) and a goat anti-mouse IgG antibody. Antigen and goat anti-mouse IgG were sprayed onto the NC membrane at a concentration of 1 µg/cm using a dispenser, to obtain the test strip and control line (Cao et al., Citation2019). The capture and control reagents were then sprayed onto a glass fibre membrane to prepare a conjugate pad and dried at 37°C for 2 h. An NC film coated with the capture reagent was attached to the centre of the clinker back sheet (PVC), and the conjugate pad, sample pad and absorbent pads were laminated and adhered to the back sheet. Finally, the plate was cut into 2.8 mm wide strips (Lin et al., Citation2019).
Test procedure and principle
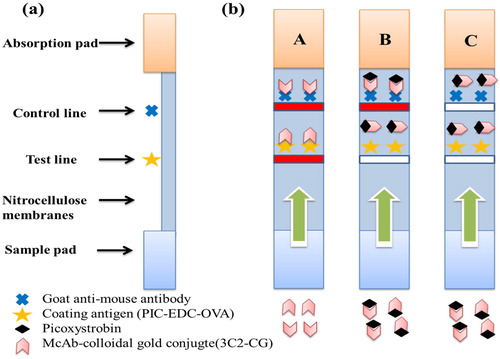
50 µL of the gold standard monoclonal antibody and 150 µL of the sample solution were mixed and reacted for 5 min and then added to the sample pad. The solution then moves to the absorbent pad and the results are displayed within 5 min. In the PIC positive samples, PIC will compete with the PIC-EDC-BSA conjugate in the test line (T) for a limited amount of anti-PIC mAb. When the amount of PIC is sufficient, the free PIC will compete with the gold-labeled mAb, thereby inhibiting the binding of the mAb to the PIC-EDC-BSA conjugate in the T line. Therefore, the higher the PIC concentration in the sample, the less intense the colour will be on the T line. In PIC-negative samples, the immobilized PIC-EDC-BSA conjugate will combine with a limited amount of colloidal gold-labeled mAb to give the T line a clearly visible red colour (Li et al., Citation2020).
During the test, the C line must always be present and the T line only appears in the negative sample ((A)). Only the C line is an indicator of the presence of PIC ((B)). If the C line T line does not appear ((C)), indicating that the test strip is invalid, and it is necessary to repeat the experiment.
Figure 3. Illustration of typical strip test results. If the sample is negative (A), a positive result could be indicated only if the control line appears (B), and if the control and test line does not appear (invalid) (C).
Sample pre-treatment and spiked sample analyses
Cucumber samples (3 g) were chopped and spiked with different amounts of PIC (0.3, 0.9, 1.8, 3 and 3.75 ng) and placed into 50 mL centrifuge tubes, and mixed with 9 mL methanol. The spiked samples were extracted by ultrasonic extraction for 15 min and centrifuged at 2400 × g for 3 min. A volume of 1 mL of the resulting supernatant was dried under nitrogen and then reconstituted with 5 mL phosphate-buffered saline (PBS), and analysed by ic-ELISA.
Results and discussion
Synthesis of hapten and artificial antigen
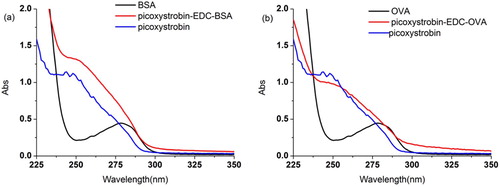
Picoxystrobin lacks a reactive group (carboxyl, amino, hydroxy) enabling it to react with a protein; therefore, it is necessary to derivatize a drug molecule to obtain a hapten containing a reactive group. In this study, we used 6-bromohexanoic acid, tert-butanol and PIC as starting materials. After a series of reactions, we obtained an active hapten PIC containing a carboxyl group with six carbon chains. To synthesize the immunogen and coat the antigen, we coupled PIC to BSA and OVA using EDC. The results are shown in . The immunogen PIC-EDC-BSA and the coating antigen PIC-EDC-OVA were identified by UV-Vis spectroscopy. The absorption peaks for PIC and BSA were at 244 nm and 280 nm, respectively, whereas the absorption peak for PIC-EDC-BSA is 240–280 nm. PIC-EDC-OVA also produced the same results. These data indicate that we have successfully synthesized immunogens and coating antigens.
Figure 4. The ultraviolet-visible absorption spectra of artificial antigen. (a) Immunogen PIC-EDC-BSA; (b) Coating antigen PIC-EDC-OVA.
Determination of antibody sensitivity and affinity using the ic-ELISA
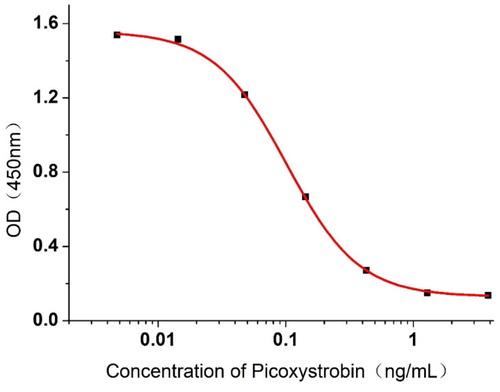
In this experiment, we obtained four cell lines: 3C2, 4D1, 4G4, and 5D4. Among them, mAb 3C2 had the lowest IC50 value (0.1 ng /mL), which was selected for subsequent optimization experiments. The optimal concentrations of coating antigen and antibody were 0.01 and 0.03 μg/mL, respectively. The indirect competitive suppression nonlinear standard curve from the 3C2 PIC is shown in . The equation for 3C2 is y = 0.12939 + 1.42861/(1 + (x /0.10142))1.53254 and the correlation coefficient R2 is 0.99967. The IC20, IC50 and IC80 of the PIC are 0.04104, 0.10142, and 0.25059 ng/mL, respectively. The specificity of the 3C2 mAb was confirmed by ic-ELISA, and the results are presented in , showing the high specificity towards PIC with CR values of <3% when compared to the other analogues.
Figure 5. The indirect competitive inhibition non-linear standard curve for picoxystrobin of 3C2.
Picoxystrobin recovery tests
In this experiment, we took 1 ml of the extract, dried it with nitrogen, and reconstituted it to 5 ml with PBS. In this way, we converted the methanol extract into a 5-fold diluted PBS solvent system to obtain a series of concentrations of PIC. The effect of methanol volatilization on the experimental results was excluded and the matrix interference concentration was diluted to a minimum. The PIC recovery of positive cucumber samples () was calculated, ranging from 91.5% to 103.3% with a standard deviation of 0.0003–0.0094 and a coefficient of variation of 3.27–8.23%. Therefore, a pretreatment step of the sample is acceptable, which can be used to detect the PIC in the actual sample.
Table 1. Accuracy evaluation of immunoassay methods for the samples.
Table 2. Cross-reactivity of mAb 3C2 to four related compounds.
Picoxystrobin detection using the ICS
Optimization of coating antigen and antibody concentration
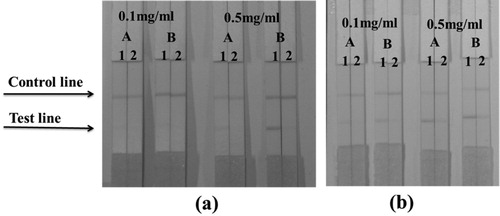
The antigen PIC-EDC-OVA-30 was selected as coating antigen and was sprayed onto the T line at concentrations of 0.1 or 0.5 mg/mL. The antibody concentration was chosen to be 4 and 8 μg/mL. Bands were evaluated in 0.01 M PBS pH 7.4 containing 0 or 25 ng/mL of PIC in PBS or 0 or 50 ng/mL of PIC in samples. Based on the results shown in , we found that, in PBS, when the coating antigen and the antibody concentrations were 0.5 mg/mL and 8 μg/mL, the colour intensity of the T line in the negative sample was strong, whereas the T line in the positive sample had no colour. Therefore, these coating antigen and antibody concentrations were selected for further evaluation of the ICS. In the sample, the optimal coating antigen and antibody concentrations were 0.1 mg/mL and 8 μg/mL.
Figure 6. Optimization of different coating antigen and antibody concentration by 0.1 mg/ml or 0.5 mg/ml coating antigen and 4 or 8 µg/mL antibody. A = 4 µg/mL antibody, B = 8 µg/mL antibody. (a) In PBS, 1 = 0 ng/mL, 2 = 25 ng/ml. (b) In sample, 1 = 0 ng/mL, 2 = 50 ng/ml.
Evaluation of the strip test
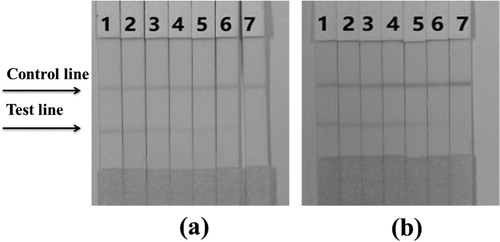
In order to study the sensitivity of the test strip, we diluted the PIC standard into a set concentration ranges using PBS, and determined the minimum detection limit (LDL) using the naked eye test for evaluating PIC concentrations. Compared with the negative control group, the colour intensity of the test strip was clear and distinct. As shown in (a), when the amount of PIC gradually increases from 0 to 50 ng/mL, the colour of the signal on the test line weakens from strong to completely absent. Therefore, we conclude that the detection limit of the PIC test strip was 50 ng/mL in PBS.
Figure 7. (a) The sensitivity of the immunochromatographic assay in PBS for picoxystrobin. 1 = 0 ng/mL, 2 = 1 ng/mL, 3 = 2.5 ng/mL, 4 = 5 ng/mL, 5 = 10 ng/mL, 6 = 25 ng/mL, and 7 = 50 ng/mL. (b) The sensitivity of the immunochromatographic assay of cucumber sample for picoxystrobin. 1 = 0ppb, 2 = 2.5ppb, 3 = 5ppb, 4 = 10ppb, 5 = 25ppb, 6 = 50ppb, and 7 = 100ppb.
Detection of PIC in cucumber samples
A PIC standard solution (1 mg/mL, prepared with 0.01 M PBS pH 7.4) was diluted with cucumber juice to obtain the following PIC standard concentrations: 2.5, 5, 10, 25, 50 and 100 ng/mL. The spiked samples were then analysed using the optimized test strip, and the results can be seen in (b). As the PIC concentration in the sample increased, the colour intensity of the T line gradually decreased. When the PIC concentration was 100 ng/mL, the T line colour disappeared. It was concluded therefore, that the cutoff value for the PIC test strip was 100 ng/mL in the cucumber samples, demonstrating that these test strips can quickly and easily detect PIC in real samples.
Conclusion
To quickly detect PIC in cucumber samples, we developed a sensitive and efficient (ICS) assay. The cut-off values for PIC detection in 50 M PBS pH 7.4 and cucumber samples were 50 and 100 ng/mL, respectively, and the test results could be obtained within 10 min. ICSs are a simple, sensitive and rapid method of detecting PIC in cucumber samples. Thus, the GNP-based lateral-flow strip assay may be applied for the large-scale screening of PIC residues in vegetables and crops.
Disclosure statement
No potential conflict of interest was reported by the author(s).
Additional information
Funding
References
- Cao, Y., Shi, H. X., Le, T., Tang, R., & Xie, Y. (2019). Development a monoclonal antibody-based enzyme-linked immunosorbent assay for screening pyrimethanil in fruits and vegetables. Food and Agricultural Immunology, 30(1), 548–563. https://doi.org/10.1080/09540105.2019.1608160
- Chen, Z. W., Wu, X. L., Xu, L. G., Liu, L. Q., Kuang, H., & Cui, G. (2019). Development of immunocolloidal strip for rapid detection of pyrimethanil. Food and Agricultural Immunology, 30(1), 1239–1252. https://doi.org/10.1080/09540105.2019.1677566
- Domingues, C. E. C., Abdalla, F. C., Balsamo, P. J., Pereira, B. V. R., Hausen, M. A., Costa, M. J., & Silva-Zacarin, E. C. M. (2017). Thiamethoxam and picoxystrobin reduce the survival and overload the hepato-nephrocitic system of the Africanized honeybee. Chemosphere, 186, 994–1005. https://doi.org/10.1016/j.chemosphere.2017.07.133
- Dornellas, R. M., Franchini, R. A. A., & Aucelio, R. Q. (2013). Determination of the fungicide picoxystrobin using anodic stripping voltammetry on a metal film modified glassy carbon electrode. Electrochimica Acta, 97, 202–209. https://doi.org/10.1016/j.electacta.2013.02.125
- Dornellas, R. M., Munoz, R. A. A., & Aucelio, R. Q. (2015). Electrochemical determination of picoxystrobin on boron-doped diamond electrode: Square-wave voltammetry versus BIA-multiple pulse amperometry. Microchemical Journal, 123, 1–8. https://doi.org/10.1016/j.microc.2015.05.010
- Esteve-Turrillas, F. A., Parra, J., Abad-Fuentes, A., Agullo, C., Abad-Somovilla, A., & Mercader, J. V. (2010). Hapten synthesis, monoclonal antibody generation, and development of competitive immunoassays for the analysis of picoxystrobin in beer. Analytica Chimica Acta, 682(1-2), 93–103. https://doi.org/10.1016/j.aca.2010.09.042
- Gao, Y., Yang, S., Li, X., He, L., Zhu, J., Mu, W., & Liu, F. (2019). Residue determination of pyraclostrobin, picoxystrobin and its metabolite in pepper fruit via UPLC-MS/MS under open field conditions. Ecotoxicology and Environmental Safety, 182, 109445. https://doi.org/10.1016/j.ecoenv.2019.109445
- Ge, W. L., Suryoprabowo, S., Xu, L. G., Zheng, Q. K., & Kuang, H. (2018). Rapid detection of penbutolol in pig urine using an immunochromatographic test strip. Food and Agricultural Immunology, 29(1), 1126–1136. https://doi.org/10.1080/09540105.2018.1520203
- Jia, W., Mao, L., Zhang, L., Zhang, Y., & Jiang, H. (2018). Effects of two strobilurins (azoxystrobin and picoxystrobin) on embryonic development and enzyme activities in juveniles and adult fish livers of zebrafish (Danio rerio). Chemosphere, 207, 573–580. https://doi.org/10.1016/j.chemosphere.2018.05.138
- Kolosova, A., Maximova, K., Eremin, S. A., Zherdev, A. V., Mercader, J. V., Abad-Fuentes, A., & Dzantiev, B. B. (2017). Fluorescence polarisation immunoassays for strobilurin fungicides kresoxim-methyl, trifloxystrobin and picoxystrobin. Talanta, 162, 495–504. https://doi.org/10.1016/j.talanta.2016.10.063
- Lan, J. D., Wang, M. F., Ding, S., Fan, Y. M., Diao, X. P., Li, Q. X., & Zhao, H. W. (2019). Simultaneous detection of carbofuran and 3-hydroxy-carbofuran in vegetables and fruits by broad-specific monoclonal antibody-based ELISA. Food and Agricultural Immunology, 30(1), 1085–1096. https://doi.org/10.1080/09540105.2019.1664997
- Li, H. L., Sun, B. G., & Chen, T. (2019). Detection of clothianidin residues in cucumber and apple juice using lateral-flow immunochromatographic assay. Food and Agricultural Immunology, 30(1), 1112–1122. https://doi.org/10.1080/09540105.2019.1667309
- Li, Y., Liu, L., Kuang, H., & Xu, C. (2020). Preparing monoclonal antibodies and developing immunochromatographic strips for paraquat determination in water. Food Chemistry, 311, 125897. https://doi.org/10.1016/j.foodchem.2019.125897
- Liang, P., Liu, G., Wang, F., & Wang, W. (2013). Ultrasound-assisted surfactant-enhanced emulsification microextraction with solidification of floating organic droplet followed by high performance liquid chromatography for the determination of strobilurin fungicides in fruit juice samples. Journal of Chromatography B, 926, 62–67. https://doi.org/10.1016/j.jchromb.2013.02.011
- Lin, L., Wu, X. L., Luo, P. J., Song, S. S., Zheng, Q. K., & Kuang, H. (2019). IC-ELISA and immunochromatographic strip assay based monoclonal antibody for the rapid detection of bisphenol S. Food and Agricultural Immunology, 30(1), 633–646. https://doi.org/10.1080/09540105.2019.1612330
- Ruske, R. E., Gooding, M. J., & Jones, S. A. (2003). The effects of adding picoxystrobin, azoxystrobin and nitrogen to a triazole programme on disease control, flag leaf senescence, yield and grain quality of winter wheat. Crop Protection, 22(7), 975–987. https://doi.org/10.1016/S0261-2194(03)00113-3
- Schnug, L., Ergon, T., Jakob, L., Scott-Fordsmand, J. J., Joner, E. J., & Leinaas, H. P. (2015). Responses of earthworms to repeated exposure to three biocides applied singly and as a mixture in an agricultural field. Science of The Total Environment, 505, 223–235. https://doi.org/10.1016/j.scitotenv.2014.09.089
- Viñas, P., Campillo, N., Martínez-Castillo, N., & Hernández-Córdoba, M. (2009). Method development and validation for strobilurin fungicides in baby foods by solid-phase microextraction gas chromatography–mass spectrometry. Journal of Chromatography A, 1216(1), 140–146. https://doi.org/10.1016/j.chroma.2008.11.036
- Viñas, P., Martínez-Castillo, N., Campillo, N., & Hernández-Córdoba, M. (2010). Liquid–liquid microextraction methods based on ultrasound-assisted emulsification and single-drop coupled to gas chromatography–mass spectrometry for determining strobilurin and oxazole fungicides in juices and fruits. Journal of Chromatography A, 1217(42), 6569-6577. https://doi.org/10.1016/j.chroma.2010.08.046.
- Ye, L. Y., Wu, X. L., Xu, L. G., Zheng, Q. K., & Kuang, H. (2018). Preparation of an anti-thiamethoxam monoclonal antibody for development of an indirect competitive enzyme-linked immunosorbent assay and a colloidal gold immunoassay. Food and Agricultural Immunology, 29(1), 1173–1183. https://doi.org/10.1080/09540105.2018.1523373