
ABSTRACT
This study evaluated the presence of aflatoxin B1 in five different animal feeds collected from manufacturers, suppliers and consumers and its possible reduction by heating at 100°C for 180 min. A total of 160 animal feed samples were collected and analyzed by using lateral flow immunoassay method. The results revealed that all animal feeds analyzed were positive for aflatoxin B1 with 91% samples containing high concentrations ranging from 24.00 to 76.23 ng/g above the international allowable standard for animal feeds (20 ng/g). Maize bran (76 ng/g) and sunflower cake (63 ng/g) had higher aflatoxin B1 concentrations, correlating with higher moisture content. Upon heating the feeds, aflatoxin B1 was reduced to a concentration ranging from 2.24 to 9.78 ng/g (<20 ng/g). Our study suggests high potential health problems to animals and humans from aflatoxins requiring proper heating and frequent monitoring of the animal feeds for aflatoxin B1.
1. Introduction
Mycotoxins are natural food and feed toxic secondary metabolic products of moulds, which can contaminate almost all agricultural commodities worldwide. Aflatoxins are naturally occurring mycotoxins produced by certain species of fungi (mostly Aspergillus flavus and Aspergillus parasiticus) (Yin et al., Citation2015). Among aflatoxins, aflatoxin B1 is the most commonly encountered toxic metabolite; it is considered as a potent and potentially lethal, and carcinogenic agent by the International Agency for Research on Cancer (International Agency for Research on Cancer, Citation2013). Therefore, research interests on the existence and concentration of aflatoxin B1 in various animal feeds have been increasing globally.
Aflatoxin B1 can affect animals through the consumption of contaminated feeds. When aflatoxin B1 in feeds is ingested directly by animals, it is metabolized into aflatoxin M1 and transferred to various animal products particularly milk (Gizachew et al., Citation2016; Mohammed et al., Citation2016; Xiong et al., Citation2018). Accordingly, aflatoxin M1 contamination has been reported in eggs, meat and blood tissues (Herzallah, Citation2009; Iqbal et al., Citation2016) from some of the East African countries such as Kenya (Kang’ethe & Lang’a, Citation2009) and Tanzania (Urio et al., Citation2006). The presence of aflatoxin B1 in animal bodies affects their health and sometimes causes death (Stoev, Citation2015). For instance, aflatoxin B1 suppressed the immune system and decreased livestock animal productivity (Streit et al., Citation2012). Aflatoxin B1 was also associated with growth retardation in chicken by reducing body weight and increasing feed conversion ratio (Atherstone et al., Citation2016) and reduced egg production (Grace, Citation2013). Humans are affected indirectly by aflatoxin B1 through the consumption of contaminated animal products including eggs, meat, blood, and milk. In the human body, aflatoxin B1 causes liver cancer, growth and development impairment (Abbas, Citation2005; Smith et al., Citation2015). Therefore, it is an inarguable fact that aflatoxin B1 poses a great risk to animal and human health. Consequently, World Health Organization imposed the maximum safe limit as 20 ng/g for aflatoxin in animal feeds due to serious effects on animal and human health (Granados-Chinchilla et al., Citation2017).
Aflatoxin B1 varies in different animal feeds depending on the ingredient used. The highest aflatoxin contamination has been found in maize bran (Kajuna et al., Citation2013) and sunflower cake (Nyangi et al., Citation2016). In Tanzania and other Eastern African countries, maize bran is among the relatively cheap ingredients used for the formulation and manufacture of most animal feeds followed by sunflower cake for dairy cattle and poultry production (Nishimwe et al., Citation2019). Unfortunately, most animal feeds are poorly handled and stored along the food supply chain, which causes aflatoxin B1 contamination. Consequently, it is unsurprisingly that Mmongoyo et al. (Citation2017) reported 80 to 86% of sunflower cake from Tanzania had aflatoxin B1 that exceeded the international safe limit of 20 ng/g. Moreover, maize bran from Tanzania (Kang’ethe & Lang’a, Citation2009; Nyangi et al., Citation2016), Rwanda (Nishimwe et al., Citation2019), Democratic Republic of Congo (Kamika et al., Citation2016; Manjula et al., Citation2009), Kenya (Probst et al., Citation2007) and Uganda (Kaaya & Kyamuhangire, Citation2006) were reported to contain high aflatoxin B1 contamination. These studies suggest that people from Eastern African countries might be at a high risk of aflatoxin infections (Kimanya, Citation2015). In fact, acute aflatoxicosis has been reported to occur more frequently in Tanzania (Kamala et al., Citation2018). Despite this, limited studies have evaluated the variations of aflatoxin B1 concentrations along the feed’s product supply chain. The lack of such information limits our understanding on the current animal and human health risks and management options to reduce aflatoxin B1 contamination.
To curb the high prevalence of aflatoxin B1 in animal feeds and its associated health risks, different measures have been suggested to reduce its concentration to safe levels. Such measures include ozonization (Chen et al., Citation2014) and heat treatment in wheat bran (Hwang & Lee, Citation2006), soaking of soybean in tartaric acid and cooking (Lee et al., Citation2015), electrolyzed alkaline water in edible oils (Fan et al., Citation2013) and sorting method for maize grain (Chen et al., Citation2014). Nevertheless, the full application of these methods by farmers in developing countries is hampered by lack of skills, unavailability and high cost of detoxification chemicals and some methods such as sorting are time-consuming (Chen et al., Citation2014). Therefore, alternative methods that are easy, safe, environmentally friendly and locally available to reduce aflatoxin B1 are needed. Previous studies have shown that heating at temperatures between 100°C and 150°C for 30 to 60 min reduced aflatoxin B1 in maize bran (Lee et al., Citation1968), sunflower cake (Arroyo-Manzanares et al., Citation2013), wheat bran (Hwang & Lee, Citation2006) and peanut seeds (Ogunsanwo et al., Citation2004). Heating was also one of the methods reported as detoxification means in a previous study (Rustom, Citation1997). However, our knowledge on the possibility of using heat treatment to reduce the aflatoxin B1 concentration in animal feeds such as maize bran, sunflower cake, broiler feed, layers feed and wheat bran is currently limited.
Therefore, the present study investigated the variations of aflatoxin B1 in animal feeds along the supply chain from manufacturers, suppliers and consumers in Tanzania. In addition, we also examined the efficacy of using heat treatment to reduce aflatoxin B1 concentration in animal feeds exceeding 20 ng/g.
2. Materials and methods
2.1. Source of chemicals
A 65% ethanol was purchased from Fisher Scientific (Loughborough, UK). De-ionized water was obtained from the Chemical Engineering Laboratory of the University of Dar es Salaam (UDSM), Tanzania. The aflatoxin standards (0, 5, 15 to 50 ng/g) were purchased from Neogen Corporation (Lansing Michigan, USA).
2.2. Sample collection and preparation
A total of one hundred and sixty (n = 160) animal feed samples (maize bran, sunflower cake, wheat bran, layers and broiler feeds) were purchased from different manufacturers, and their corresponding suppliers and consumers along the supply chain in Dar es Salaam, Tanzania. The animal feed samples were single feeds (maize bran and sunflower cake) and mixed feeds (wheat bran, layers and broiler feeds). The samples were collected by using a clean spoon in each storage bag. The samples collected were immediately placed into clean zipped plastic bags, which were properly labelled with the name of manufacturers (manufacturer 1 to manufacturer 15), suppliers (supplier 1 to supplier 15) or consumers (consumer 1 to consumer 15) and their source. For convenient reporting, the manufacturers, suppliers and consumers were sorted into five groups; 1 to 3 maize bran, 4 to 6 layers feed, 7 to 9 sunflower cake, 10 to 12 broiler feed and 13 to 15 wheat bran.
The animal feeds were stored immediately in an icebox and transported to the laboratory in the Department of Chemical Engineering of the UDSM. In the laboratory, the samples were stored in a refrigerator at −4°C until analyzed for aflatoxin B1. A sample of 60 g from each animal feed material was ground to fine powder by using a dry milling machine (Man: Bunn-O-Matic Corporation Springfield, Illinois, USA). Each ground sample was then sub-divided into three equal portions of 10 g for aflatoxin B1 assay. The remaining sample was used for the determination of moisture content as described in the next section.
2.3. Determination of aflatoxin B1 concentrations in animal feed samples
Aflatoxin B1 was quantified by using the lateral flow immunoassay method by following the Reveal Q+ kit instructions from Neogen Veratox Company (Reveal AccuScan® III reader, Neogen, USA). A 10 g of each ground sub-sample was placed into a clean cup (250 ml). The sample was extracted by using 50 ml mixture of ethanol/distilled water (65:35, v/v) and shaken vigorously for three minutes. The suspension was incubated at room temperature for 10 min untill all particles settled at the bottom. The extracts were filtered through Whatman No. 1 filter paper (Whatman International Ltd, Maidstone, UK) with a pore size of 11 µm. Five hundred (500) µL of sample diluent supplied with Reveal Q+ kit was mixed with 100 µL of the filtrate into a dilution cup. A 100 µL volume of the mixture was transferred into a sample cup. Aflatoxin lateral flow strip was placed into the sample cup for 6 min, removed and inserted into a mobile Diagnostic Reader (M-Reader™) attached to tablet – Model. The tablet had an adapter for inserting the strip and the software to read the strip using a tablet camera for aflatoxin B1 quantification. All animal feed samples collected were analyzed independently in three replicates. The lower limit of detection (LOD) of the assay was 2 ng/g, with a quantitative range of 2 to 150 ng/g.
2.4. Determination of moisture content in animal feed samples
Three equal portions of 5 g of each sample were collected for moisture determination. The moisture content of each animal feed sample was measured by using an oven (5E-MHG6090, Changsha Kaiyuan Instruments Co. Ltd, Changsha, China). The samples were placed in Petri dishes and dried at 100 °C in an oven for 3 h until the weight remained constant (AOAC, Citation1995). After drying, the samples were weighed and moisture content was determined based on a dry matter basis (AOAC, Citation1995).
2.5. Examination of aflatoxin B1 reduction in animal feeds by heating
Three equal portions of 5 g of each sample for all animal feed samples, which had higher than 20 ng/g aflatoxin B1 were placed in a glass Petri dish. The glass Petri dish containing the samples were heated in an oven at 100 °C for 180 min to examine the possibility of reducing aflatoxin B1 by heating.
2.6. Statistical analyses
Data were tested for normality by using Shapiro–Wilk test and homogeneity of variance using Levene’s test. One-way analysis of variance (ANOVA) was used to test for statistical differences in aflatoxin B1 and moisture contents among the animal feeds from manufacturers, suppliers and consumers. Specific significant differences among the animal feeds from manufacturers, suppliers and consumers were determined by using Tukey’s post hoc test. The differences in aflatoxin B1 concentration and moisture content before and after heating were compared by using an independent t-test. Pearson’s correlation coefficient (r) was used to depict the relationship between aflatoxin B1 and moisture content. All statistical analyses were conducted by using Statistical Package for the Social Sciences (SPSS) version 20 for Windows (IBM, Armonk, NY, USA). Results with p ≤ 0.05 were considered statistically significant for all statistical tests. The obtained results are reported as mean ± standard error of the mean.
3. Results
3.1. The variation of aflatoxin B1 concentration among manufacturers, suppliers and consumers
All animal feeds collected from manufacturers, suppliers and consumers were positive for aflatoxin B1. The minimum and maximum contamination levels were 5.30 and 149.00 ng/g, respectively ((a–o)). Of the 160 samples collected, 145 samples (90.63%) had aflatoxin B1 contamination above the international acceptable limit for animal feeds (20 ng/g), whereas only 15 samples (9.37%) had aflatoxin B1 below 20 ng/g.
Figure 1. The aflatoxin B1 concentration among manufacturers (a–e), suppliers (f–j) and consumers (k–o). The asterisk (*) above a line indicates significant differences between the groups (p < 0.05). Values are means ± SEM (n = 3).
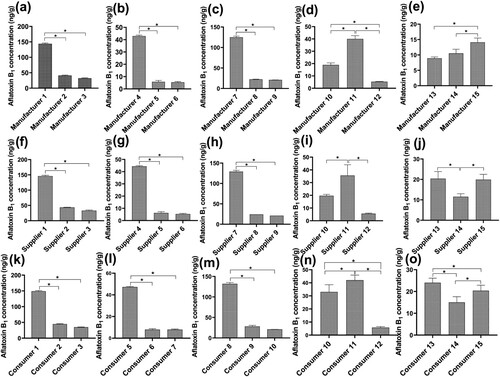
The aflatoxin B1 levels varied significantly among manufacturers, suppliers and consumers (p < 0.05). The results showed higher levels of aflatoxin B1 in manufacturer1 ((a)), manufacturer4 ((b)), manufacturer7 ((c)), manufacturer11 ((d)), and manufacturer15 ((e)) compared with the other corresponding two manufacturers for each group (p < 0.05). Similarly, the aflatoxin B1 levels were higher in supplier1 ((f)), supplier4 ((g)), supplier7 ((h)) and supplier11 ((i)) compared with the other two corresponding suppliers for each group (p < 0.05). However, supplier14 had lower aflatoxin B1 levels compared to supplier13 and supplier15 (p < 0.05; (j)). Furthermore, the aflatoxin B1 levels were higher in consumer1 ((k)), consumer4 ((l)) and consumer7 ((m)) compared with the other two corresponding consumers for each group (p < 0.05). Contrary, consumer12 ((n)) and consumer14 ((o)) had lower aflatoxin B1 levels compared with the other two corresponding consumers (p < 0.05).
3.2. The variations of aflatoxin B1 concentration among the animal feeds
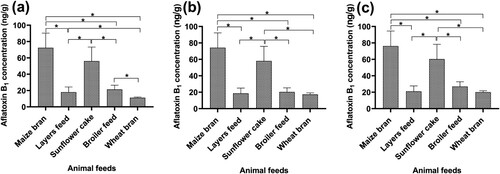
The aflatoxin B1 levels in animal feeds from manufacturers, suppliers and consumers varied significantly (p < 0.05). The aflatoxin B1 levels for maize bran and sunflower cake samples along the supply chain from manufacturers ((a)), supplier ((b)) and consumer ((c)) were significantly higher than layers feed, broiler feed and wheat bran (p < 0.05). However, the aflatoxin B1 levels in maize bran and sunflower cake were statistically similar (p > 0.05) along the supply chain for manufacturers ((a)), suppliers ((b)) and consumers ((c)). Similarly, the aflatoxin B1 levels in layer feed and broiler feed for manufacturers were statistically similar (p > 0.05). Similarly, the aflatoxin B1 levels in layers feed, broiler feed and wheat bran for suppliers and consumers were statistically similar (p > 0.05). For manufacturers, the aflatoxin B1 levels in broiler feed were higher than wheat bran ((a); p < 0.05).
Figure 2. The aflatoxin B1 concentration among the animal feeds collected during the study; manufacturers (a), suppliers (b) and consumers (c). The asterisk (*) above a line indicates significant differences between the groups (p < 0.05). Values are means ± SEM (n = 3).
3.3. The variations of aflatoxin B1 levels along the feed supply chain
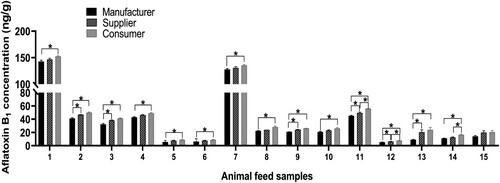
The aflatoxin B1 levels were assessed along the supply chain from manufacturers to corresponding suppliers and consumers. The aflatoxin B1 levels were significantly different along the supply chain from manufacturers to corresponding suppliers and consumers (; p < 0.05). All the animal feed samples from manufacturers had a lower aflatoxin B1 concentration than those from suppliers and consumers (p < 0.05). The aflatoxin B1 levels along the feed supply chain followed a trend of manufacturers < suppliers < consumers.
Figure 3. The aflatoxin B1 concentration along the product supply chain from the manufacturers to consumers. The asterisk (*) above a line indicates significant differences between the groups (p < 0.05). Values are means ± SEM (n = 3).
3.4. Moisture content in animal feeds and its correlation to aflatoxin B1
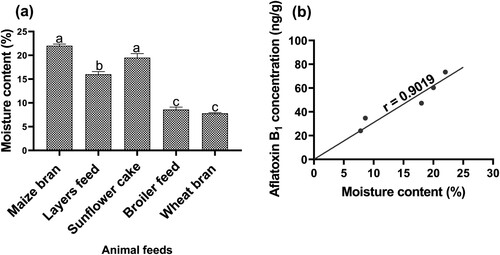
The animal feeds had moisture content ranging from 8% to 23%. The moisture content from all the animal feed materials was statistically different (; p < 0.05). The moisture content for maize bran and sunflower cake was significantly higher than layers feed, broiler feed and wheat bran (p < 0.05). Furthermore, the moisture content for layers feed was significantly higher compared to broiler feed and wheat bran (p < 0.05). However, the moisture content for maize bran and sunflower cake was statistically similar (p > 0.05). Similarly, the moisture content for broiler feed and wheat bran was statistically the same (p > 0.05). The moisture content of the sampled animal feeds had a significantly positive correlation with aflatoxin B1 (r = 0.90; p < 0.05; (b)).
Figure 4. Moisture content in all animal feed materials (a) and the relationship between moisture content and aflatoxin B1 concentration in all animal feed samples (b). Different letters above bars show significant differences (p < 0.05). Values are means ± SEM (n = 3).
3.5. The effect of heating the animal feeds on aflatoxin B1 levels
To understand the possible reduction of aflatoxin B1 levels, we heated all the animal feed samples containing aflatoxin B1 with more than 20 ng/g at 100 °C for 180 min. Heating reduced the aflatoxin B1 levels in all the animal feeds heated during the study to concentrations <20 ng/g (p < 0.05; ). The aflatoxin B1 levels were significantly reduced by more than 80 to 90% in most feed materials (). Equally, the moisture content in all samples was significantly reduced after heating (p < 0.05; ) between 91% and 98% (). Accordingly, the moisture content was significantly positively correlated with aflatoxin B1 levels after heating ().
Figure 5. The aflatoxin B1 concentration in all animal feed materials before and after heat treatment. Different upper and lower case letters above bars show significant differences in aflatoxin B1 concentration (p < 0.05) before heating and after heat treatment, respectively. The asterisk (*) above a line indicates significant differences in aflatoxin B1 concentration before and after heat treatment (p < 0.05). Values are means ± SEM (n = 3).
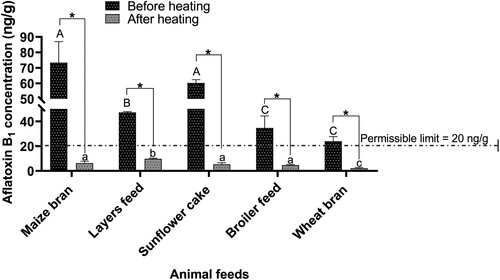
Figure 6. Moisture content in all animal feed materials before and after heat treatment. Different upper and lower case letters above bars show significant differences in moisture content (p < 0.05) before heating and after heat treatment, respectively. The asterisk (*) above a line indicates significant differences in moisture content before and after heating (p < 0.05). Values are means ± SEM (n = 3).
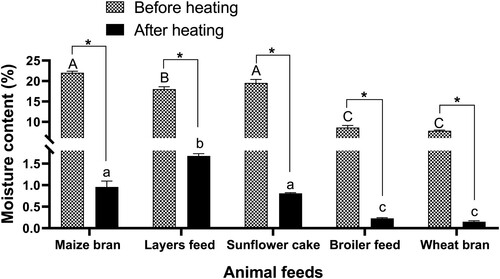
Figure 7. The relationship between moisture content and aflatoxin B1 levels in animal feeds after heating.

Table 1. Reduction of aflatoxin B1 in animal feeds after heat treatment.
Table 2. Reduction of moisture content in animal feeds after heat treatment.
4. Discussion
All animal feeds collected from manufacturers, suppliers and consumers were positive for aflatoxin B1. We found 91% of the samples collected had aflatoxin B1, which exceeded the international acceptable limit for animal feed safety. Similarly, Magembe et al. (Citation2016) reported majority of the samples in the studied villages (100%) in Kilosa were not safe for consumption because they exceeded 20 μg/kg, relatively similar to 91% obtained in our study. The high percentage of animal feed samples with aflatoxin B1 contamination above the international limit suggests possible chronic exposure of animals and inhabitants to aflatoxins in their diets (Kamala et al., Citation2018; Kotinagu et al., Citation2015). These results suggest possible health problems related to acute aflatoxicosis in animals and human communities as reported previously in the country (Kamala et al., Citation2018). We also found higher variations of aflatoxin B1 for manufacturers, suppliers and consumers, similar to results reported by Kamika et al. (Citation2016) for maize from farm to distribution vendors. Variations in aflatoxin B1 levels among the various manufacturers might be caused by the collection of raw feed materials from different locations, postharvest handling and processing procedures used and improper storage. In Tanzania, certain regions from the Eastern zone (Morogoro) and Western zone (Shinyanga) are known to contain higher occurrence of aflatoxin B1 in raw materials (Kimanya et al., Citation2016). These regions are located in semi-arid, warm and drought climatic conditions, which cause stress to plants in the field thus rendering them more susceptible to aflatoxigenic mould colonization and insect damage, which increase aflatoxin contamination in the seeds (Guo et al., Citation2008). Moreover, poor postharvest handling practices of animal feeds among the suppliers and consumers might also have increased the levels of aflatoxin B1 contamination (Makori et al., Citation2019; Ndung’u et al., Citation2013; Seetha et al., Citation2017). In addition, improper processing procedures such as poor drying of animal feed materials, inadequate sorting between contaminated and uncontaminated raw animal feed materials (Shabani et al., Citation2015) also enhance aflatoxin contamination along the supply chain. Moreover, the addition of water during milling to remove the test from maize, which is a common processing practice in the country, similarly promotes mould growth and increases the total aflatoxin concentration (Kaaya & Kyamuhangire, Citation2006). Furthermore, improper storage also might be the reason for the observed high prevalence of aflatoxin B1 levels among manufacturers, suppliers and consumers. Previous studies reported that, storage conditions (Seetha et al., Citation2017) and storage time (Fundikira et al., Citation2021) increase aflatoxin contamination in Tanzania. Seetha et al. (Citation2017) reported increased aflatoxin contamination from an average of 18.8 μg/kg in freshly harvested samples to an average of 57.2 μg/kg during storage. In general, our results indicate a high prevalence of aflatoxin B1 concentration in the animal feed materials sampled, which varies depending on manufacturers, suppliers and consumers. Animal feed processors are urged to select properly the source of raw materials and check for aflatoxin B1 contamination before purchase.
Our results show that the aflatoxin B1 concentration increases along the feed supply chain from the manufacturers, suppliers to the consumers. Similarly, Kamika et al. (Citation2016) reported an increase of aflatoxin B1 levels from 63.5% at the manufacturer site up to 100% at the market. The increase in aflatoxin B1 concentration might be caused by poor handling of animal feeds such as storage conditions and re-use of storage facilities (Kamika et al., Citation2016). During the study, we observed some feed manufacturers re-using plastic containers for storing animal feed materials. Such re-used storage facilities may contain Aspergillus sp. spores from the previous samples and thus increase aflatoxin B1 contamination of the animal feed materials (Kamika et al., Citation2016). These results imply that the handling processes such as storage and re-use of containers conducted by manufacturers may be responsible for the increase in aflatoxin B1 along the feed supply chain. Correspondingly, higher levels of aflatoxin B1 in animal feed materials from manufacturers inheritably contaminated the animal feed materials among suppliers and consumers. Therefore, the animal feed materials for suppliers and consumers equally had higher levels of aflatoxin B1 as well. In a nutshell, the aflatoxin B1 levels increase along the feed supply chain from manufacturers to consumers. Under present practices, it is impossible to produce aflatoxin-free food along the supply chain. However, proper handling practices are necessary to reduce the contamination of aflatoxins along the supply chain (Galvano et al., Citation2005). Thus, manufacturers should handle properly the animal feed materials to reduce aflatoxin B1 contamination along the value chain.
We found single animal feed materials such as maize bran and sunflower cake (except wheat bran) had higher aflatoxin B1 levels compared with mixed feeds such as layers and broiler feeds, similar to results reported previously (Fareed et al., Citation2014; Kajuna et al., Citation2013; Nyangi et al., Citation2016; Xiong et al., Citation2018). We related the higher aflatoxin B1 levels in maize bran and sunflower cake to their higher moisture content. Indeed, the moisture content was positively correlated to aflatoxin B1 concentration, as reported previously in corn (Fareed et al., Citation2014). The higher moisture content in the feed materials provided a conductive environment for Aspergillus sp. to grow and thrive thereby increasing aflatoxin B1 concentration as reported in previous studies (Taye et al., Citation2016). Our results suggest that the higher aflatoxin B1 concentration in maize bran and sunflower cake was caused by their higher moisture, which favoured the flourishing of moulds. Therefore, proper drying of maize bran and sunflower cake by controlling their moisture content is a necessary precaution approach for minimizing aflatoxin B1 contamination in animal feeds.
The aflatoxins levels in animal feeds have been shown to relate to water activity and temperature (Lv et al., Citation2019). To understand the reason for the reduction of aflatoxin B1 after heating, we measured the moisture content of the animal feed samples and correlated it with aflatoxin B1 concentration. We found that heating the animal feed materials at 100 °C for 180 min reduced the aflatoxin B1 contamination to a safe level lower than 20 ng/g for animal feed materials. Heating caused a reduction of more than 80% of aflatoxin B1 in the samples. Moreover, the moisture content in all the animal feed materials were lower after heating as reported in previous studies (Hwang & Lee, Citation2006; Rustom, Citation1997; Zaki et al., Citation2012). The moisture content was reduced by more than 91% in all samples heated. Interestingly, the aflatoxin B1 concentration and moisture correlated significantly after heating the samples. We hypothesize that heating the samples at 100 °C for 180 min reduced the aflatoxin B1 concentration by using two mechanisms. First, heating reduced moisture content, which created unfavourable conditions for the proliferation and survival of moulds with possible killing effects, and thus reduced the production of aflatoxin B1. Second, the applied heat hydrolyzed the lactone ring (Raters & Matissek, Citation2008) or furan ring (Rustom et al., Citation1993) of the aflatoxin B1, which has been shown to possess limited stability (Karabulut et al., Citation2014). The double bond in the terminal furan ring or the lactone bond of aflatoxin B1 is a target for its destruction (Zhang et al., Citation2021a; Zhang et al., Citation2021b). The lactone ring was easily hydrolyzed by wet heating in a previous study (Zhang et al., Citation2021a) and temperatures as low as >100 °C has been shown to open it (Raters & Matissek, Citation2008). These results suggest that heating the animal feeds reduces the aflatoxin B1 levels to similar international permissible limits. Feed processors are advised to heat the animal feed materials to reduce moisture content and thus control aflatoxin B1 contamination.
5. Conclusion
This study found all the animal feeds collected and analyzed had high aflatoxin B1, with more than 91% of samples exceeding the international regulatory limit for animal feeds (20 ng/g), highlighting the potential health problems to animals and humans in the study area. The aflatoxin B1 levels vary depending on manufacturers, suppliers and consumers along the feed supply chain due to poor handling and processing practices. The maize bran and sunflower cake had higher aflatoxin B1 concentration due to their higher moisture content. Accordingly, heating the animal feed materials at 100 °C for 180 min reduces the moisture content, consequently lowering aflatoxin B1 levels below 20 ng/g. We recommend proper handling procedures such as heating, frequent monitoring and strict regulations to control aflatoxin B1 levels in animal feeds and cereal ingredients in the study area and elsewhere to safeguard animal and human health.
Disclosure statement
No potential conflict of interest was reported by the author(s).
Additional information
Funding
References
- Abbas, K. H. (2005). Aflatoxin and food safety. CRC Press Taylor & Francis Group.
- AOAC. (1995). Association of official analytical chemists (AOAC). Official methods of analysis of official analytical chemists international (16th ed.). Association of Official Analytical Chemists.
- Arroyo-Manzanares, N., Huertas-Pérez, J. F., Gámiz-Gracia, L., & García-Campaña, A. M. (2013). A new approach in sample treatment combined with UHPLC-MS/MS for the determination of multiclass mycotoxins in edible nuts and seeds. Talanta, 115, 61–67. https://doi.org/10.1016/j.talanta.2013.04.024
- Atherstone, C., Grace, D., Lindahl, J. F., Kang’ethe, E. K., & Nelson, F. (2016). Assessing the impact of aflatoxin consumption on animal health and productivity. African Journal of Food Agriculture and Nutrition Development, 16(3), 10949–10966. https://doi.org/10.18697/ajfand.75.ILRI01
- Chen, R., Ma, F., Li, P.-W., Zhang, W., Ding, X.-X., Zhang, Q., Li, M., Wang, Y.-R., & Xu, B.-C. (2014). Effect of ozone on aflatoxins detoxification and nutritional quality of peanuts. Food Chemistry, 146, 284–288. https://doi.org/10.1016/j.foodchem.2013.09.059
- Fan, S., Zhang, F., Liu, S., Yu, C., Guan, D., & Pan, C. (2013). Removal of aflatoxin B1 in edible plant oils by oscillating treatment with alkaline electrolysed water. Food Chemistry, 141(3), 3118–3123. https://doi.org/10.1016/j.foodchem.2013.06.013
- Fareed, G., Khan, S. H., Anjum, M. A., & Ahmed, N. (2014). Determination of aflatoxin and ochratoxin in poultry feed ingredients and finished feed in humid semi-tropical environment. Journal of Advanced Veterinary and Animal Research, 1(4), 201–207. https://doi.org/10.5455/javar.2014.a38
- Fundikira, S., De Saeger, S., Kimanya, M., & Mugula, J. (2021). Awareness, handling and storage factors associated with aflatoxin contamination in spices marketed in Dar es Salaam, Tanzania. World Mycotoxin Journal, 14(2), 191–200. https://doi.org/10.3920/WMJ2020.2590
- Galvano, F., Ritieni, A., Piva, G., & Pietry, A. (2005). Mycotoxin in the human food chain. In D. E. Diaz (Ed.), Mycotoxin blue book (pp. 187–224). Nottingham University Press.
- Gizachew, D., Szonyi, B., Tegegne, A., Hanson, J., & Grace, D. (2016). Aflatoxin contamination of milk and dairy feeds in the Greater Addis Ababa milk shed, Ethiopia. Food Control, 59, 773–779. https://doi.org/10.1016/j.foodcont.2015.06.060
- Grace, D. (2013). Animals and aflatoxins. In L. Unnevehr, & D. Grace (Eds.), Finding solutions for improved food safety. 20 (pp. 1–2). International Food Policy Research Institute.
- Granados-Chinchilla, F., Molina, A., Chavarría, G., Alfaro-Cascante, M., Bogantes-Ledezma, D., & Murillo-Williams, A. (2017). Aflatoxins occurrence through the food chain in Costa Rica: Applying the one health approach to mycotoxin surveillance. Food Control, 82, 217–226. https://doi.org/10.1016/j.foodcont.2017.06.023
- Guo, B., Chen, Z.-Y., Lee, R. D., & Scully, B. T. (2008). Drought stress and preharvest aflatoxin contamination in agricultural commodity: Genetics, genomics and proteomics. Journal of Integrative Plant Biology, 50(10), 1281–1291. https://doi.org/10.1111/j.1744-7909.2008.00739.x
- Herzallah, S. M. (2009). Determination of aflatoxins in eggs, milk, meat and meat products using HPLC fluorescent and UV detectors. Food Chemistry, 114(3), 1141–1146. https://doi.org/10.1016/j.foodchem.2008.10.077
- Hwang, J.-H., & Lee, K.-G. (2006). Reduction of aflatoxin B1 contamination in wheat by various cooking treatments. Food Chemistry, 98(1), 71–75. https://doi.org/10.1016/j.foodchem.2005.04.038
- International Agency for Research on Cancer. (2013). Monographs on the evaluation of carcinogenic risks to humans. 98. International Agency for Research on Cancer.
- Iqbal, S. Z., Asi, M. R., Nisar, S., Zia, K. M., Jinap, S., & Malik, N. (2016). A limited survey of aflatoxins and zearalenone in feed and feed ingredients from Pakistan. Journal of Food Protection, 79(10), 1798–1801. https://doi.org/10.4315/0362-028X.JFP-16-091
- Kaaya, A. N., & Kyamuhangire, W. (2006). The effect of storage time and agroecological zone on mould incidence and aflatoxin contamination of maize from traders in Uganda. International Journal of Food Microbiology, 110(3), 217–223. https://doi.org/10.1016/j.ijfoodmicro.2006.04.004
- Kajuna, F., Temba, B., & Mosha, R. (2013). Surveillance of aflatoxin B1 contamination in chicken commercial feeds in Morogoro, Tanzania. Livestock Research for Rural Development, 25(3). https://www.lrrd.org/lrrd25/3/kaju25051.htm.
- Kamala, A., Shirima, C., Jani, B., Bakari, M., Sillo, H., Rusibamayila, N., Saeger, S., Kimanya, M., Gong, Y. Y., & Simba, A. (2018). Outbreak of an acute aflatoxicosis in Tanzania during 2016. World Mycotoxin Journal, 11(3), 311–320. https://doi.org/10.3920/WMJ2018.2344
- Kamika, I., Ngbolua, K.-t.-N., & Tekere, M. (2016). Occurrence of aflatoxin contamination in maize throughout the supply chain in the Democratic Republic of Congo. Food Control, 69, 292–296. https://doi.org/10.1016/j.foodcont.2016.05.014
- Kang’ethe, E. K., & Lang’a, K. A. (2009). Aflatoxin B1 and M contamination of animal feeds and milk from urban centers in Kenya. African Health Sciences, 9(4), 218–226.
- Karabulut, S., Paytakov, G., & Leszczynski, J. (2014). Reduction of aflatoxin B1 to aflatoxicol: A comprehensive DFT study provides clues to its toxicity. Journal of the Science of Food and Agriculture, 94(15), 3134–3140. https://doi.org/10.1002/jsfa.6663
- Kimanya, E. M. (2015). The health impacts of mycotoxins in the Eastern Africa region. Current Opinion in Food Science, 6, 7–11. https://doi.org/10.1016/j.cofs.2015.11.005
- Kimanya, M., Bendantunguka, T., & Mpolya, E. (2016). Country and economic assessment for aflatoxin contamination and control in Tanzania; A supplement to the 2012 report.
- Kotinagu, K., Mohanamba, T., & Kumari, L. R. (2015). Assessment of aflatoxin B1 in livestock feed and feed ingredients by high-performance thin layer chromatography. Veterinary World, 8(12), 1396–1399. https://doi.org/10.14202/vetworld.2015.1396-1399
- Lee, J., Her, J.-Y., & Lee, K.-G. (2015). Reduction of aflatoxins (B1, B2, G1, and G2) in soybean-based model systems. Food Chemistry, 189, 45–51. https://doi.org/10.1016/j.foodchem.2015.02.013
- Lee, L., Cucullu, A., & Goldblatt, L. (1968). Appearance and Aflatoxin content of raw and dry roasted peanut kernels. Food Technology, 22, 1131–1134.
- Lv, C., Jin, J., Wang, P., Dai, X., Liu, Y., Zheng, M., & Xing, F. (2019). Interaction of water activity and temperature on the growth, gene expression and aflatoxin production by Aspergillus flavus on paddy and polished rice. Food Chemistry, 293, 472–478. https://doi.org/10.1016/j.foodchem.2019.05.009
- Magembe, K. S., Mwatawala, M. W., Mamiro, D. P., & Chingonikaya, E. E. (2016). Assessment of awareness of mycotoxins infections in stored maize (Zea mays L.) and groundnut (Arachis hypogea L.) in Kilosa District, Tanzania. International Journal of Food Contamination, 3(1), 12. https://doi.org/10.1186/s40550-016-0035-5
- Makori, N., Matemu, A., Kimanya, M., & Kassim, N. (2019). Inadequate management of complementary foods contributes to the risk of aflatoxin exposure and low nutrition status among children. World Mycotoxin Journal, 12(1), 67–76. https://doi.org/10.3920/WMJ2018.2354
- Manjula, K., Hell, K., Fandohan, P., Abass, A., & Bandyopadhyay, R. (2009). Aflatoxin and fumonisin contamination of cassava products and maize grain from markets in Tanzania and Republic of the Congo. Toxin Reviews, 28(2–3), 63–69. https://doi.org/10.1080/15569540802462214
- Mmongoyo, J. A., Wu, F., Linz, J. E., Nair, M. G., Mugula, J. K., Tempelman, R. J., & Strasburg, G. M. (2017). Aflatoxin levels in sunflower seeds and cakes collected from micro- and small-scale sunflower oil processors in Tanzania. PLoS ONE, 12(4), e0175801. https://doi.org/10.1371/journal.pone.0175801
- Mohammed, S., Munissi, J. J. E., & Nyandoro, S. S. (2016). Aflatoxin M1 in raw milk and aflatoxin B1 in feeds from household cows in Singida, Tanzania. Food Additives & Contaminants: Part B Surveillance, 9(2), 85–90. https://doi.org/10.1080/19393210.2015.1137361
- Ndung’u, J. W., Makokha, A. O., Onyango, C. A., Mutegi, C. K., Wagacha, J. M., Christie, M. E., & Wanjoya, A. K. (2013). Prevalence and potential for aflatoxin contamination in groundnuts and peanut butter from farmers and traders in Nairobi and Nyanza provinces of Kenya. Journal of Applied Biosciences, 65, 4922–4934. https://doi.org/10.4314/jab.v65i0.89579.
- Nishimwe, K., Bowers, E., Ayabagabo, J. d. D., Habimana, R., Mutiga, S., & Maier, D. (2019). Assessment of aflatoxin and fumonisin contamination and associated risk factors in feed and feed ingredients in Rwanda. Toxins, 11(5), 270. https://doi.org/10.3390/toxins11050270
- Nyangi, C., Mugula, J., Beed, F., Boni, S., Koyano, E., & Sulyok, M. (2016). Aflatoxins and fumonisin contamination of marketed maize, maize bran and maize used as animal feed in Northern Tanzania. African Journal of Food, Agriculture, Nutrition and Development, 16(3), 11054–11065. https://doi.org/10.18697/ajfand.75.ILRI07
- Ogunsanwo, B. M., Faboya, O. O. P., Idowu, R., Samuel, L., & Bankole, S. (2004). Effect of roasting on the aflatoxin contents of Nigerian peanut seeds. African Journal of Biotechnology, 3(9), 451–455. https://doi.org/10.5897/AJB2004.000-2096
- Probst, C., Njapau, H., & Cotty, P. J. (2007). Outbreak of an acute aflatoxicosis in Kenya in 2004: Identification of the causal agent. Applied and Environmental Microbiology, 73(8), 2762–2764. https://doi.org/10.1128/AEM.02370-06
- Raters, M., & Matissek, R. (2008). Thermal stability of aflatoxin B1 and ochratoxin A. Mycotoxin Research, 24(3), 130–134. https://doi.org/10.1007/BF03032339
- Rustom, I. Y. S. (1997). Aflatoxin in food and feed: Occurrence, legislation and inactivation by physical methods. Food Chemistry, 59(1), 57–67. https://doi.org/10.1016/S0308-8146(96)00096-9
- Rustom, I. Y. S., López-Leiva, M. H., & Nair, B. M. (1993). Effect of pH and heat treatment on the mutagenic activity of peanut beverage contaminated with aflatoxin B1. Food Chemistry, 46(1), 37–42. https://doi.org/10.1016/0308-8146(93)90072-N
- Seetha, A., Munthali, W., Msere, H. W., Swai, E., Muzanila, Y., Sichone, E., Tsusaka, T. W., Rathore, A., & Okori, P. (2017). Occurrence of aflatoxins and its management in diverse cropping systems of central Tanzania. Mycotoxin Research, 33(4), 323–331. https://doi.org/10.1007/s12550-017-0286-x
- Shabani, I., Kimanya, M. E., Gichuhi, P. N., Bonsi, C., & Bovell-Benjamin, A. C. (2015). Maize storage and consumption practices of farmers in Handeni District, Tanzania: Corollaries for mycotoxin contamination. Open Journal of Preventive Medicine, 5(8), 330–339. https://doi.org/10.4236/ojpm.2015.58037
- Smith, L. E., Prendergast, A. J., Turner, P. C., Mbuya, M. N., Mutasa, K., Kembo, G., & Stoltzfus, R. (2015). The potential role of mycotoxins as a contributor to stunting in the SHINE trial. Clinical Infectious Disease, 61(7), 733–737. https://doi.org/10.1093/cid/civ849
- Stoev, S. (2015). Foodborne mycotoxicoses, risk assessment and underestimated hazard of masked mycotoxins and joint mycotoxin effects or interaction. Environmental Toxicology, 39(2), 794–809. https://doi.org/10.1016/j.etap.2015.01.022
- Streit, S., Tassis, T., Marin, D., & Taranu, I. (2012). Current situation of mycotoxin contamination and co-occurrence in animal feed focus on Europe. Toxins, 4(10), 788–809. https://doi.org/10.3390/toxins4100788
- Taye, W., Ayalew, A., Chala, A., & Dejene, M. (2016). Aflatoxin B1 and total fumonisin contamination and their producing fungi in fresh and stored sorghum grain in East Hararghe, Ethiopia. Food Additives & Contaminants: Part B Surveillance, 9(4), 237–245. https://doi.org/10.1080/19393210.2016.1184190
- Urio, E., Juma, A., Mwanyika, S., Mlingi, N., Ndunguru, G., & Ndossi, G. (2006). The occurrence of aflatoxin M1 in fresh cow milk retailed in Dar es Salaam, Tanzania. Mycotoxins and phycotoxins: Advances in determination, toxicology, and exposure management: Proceedings of the XIth international IUPAC symposium on mycotoxins and phycotoxins, May 17–21, 2004, Bethesda, Maryland, USA, Wageningen Academic Pub, p. 203.
- Xiong, J., Xiong, L., Zhou, H., Liu, Y., & Wu, L. (2018). Occurrence of aflatoxin B1 in dairy cow feedstuff and aflatoxin M1 in UHT and pasteurized milk in central China. Food Control, 92, 386–390. https://doi.org/10.1016/j.foodcont.2018.05.022
- Yin, H.-B., Chen, C.-H., Kollanoor-Johny, A., Darre, M. J., & Venkitanarayanan, K. (2015). Controlling Aspergillus flavus and Aspergillus parasiticus growth and aflatoxin production in poultry feed using carvacrol and trans-cinnamaldehyde. Poultry Science, 94(9), 2183–2190. https://doi.org/10.3382/ps/pev207
- Zaki, M. M., El-Midany, S. A., Shaheen, H. M., & Rizzi, L. (2012). Mycotoxins in animals: Occurrence, effects, prevention and management. Journal of Toxicology and Environmental Health Sciences, 4(1), 13–28. https://doi.org/10.5897/JTEHS11.072
- Zhang, Y., Li, M., Liu, Y., Guan, E., & Bian, K. (2021a). Degradation of aflatoxin B1 by water-assisted microwave irradiation: Kinetics, products, and pathways. LWT, 152, 112310. https://doi.org/10.1016/j.lwt.2021.112310
- Zhang, Y., Wang, P., Kong, Q., & Cotty, P. J. (2021b). Biotransformation of aflatoxin B1 by Lactobacillus helviticus FAM22155 in wheat bran by solid-state fermentation. Food Chemistry, 341, 128180. https://doi.org/10.1016/j.foodchem.2020.128180