
Abstract
To understand the effects of ionic strength and pH on the transport of natural soil nanoparticles (NS) in saturated porous media, aeolian sandy soil nanoparticles (AS), cultivated loessial soil nano particles (CS), manural loessial soil nanoparticles (MS) and red soil nanoparticles (RS) were leached with solutions of varying pH and ionic strength. The recovery rate of soil nanoparticles decreased in the order AS > RS > MS > CS. Transport of soil nanoparticles was enhanced with increasing pH and decreasing ionic strength and was attributable to changes in the Zeta potential of NS. Deposition of NS was also affected by the composition of soil nanoparticles and the surface charge. Column experiments showed that the interaction between soil nanoparticles and saturated quartz sand was mainly due to the physical and chemical properties of soil nanoparticles. The Derjaguin–Landau–Verwey–Overbeek interaction energies between NS and sand were affected by pHs and ionic strengths. Soil nanoparticles transport through saturated porous media could be accurately simulated by the one-dimensional advection-dispersion-reaction equation.
1. Introduction
Soil colloids generally have a diameter less than 10 μm and nanoparticles less than 100 nm [Citation1]. Mobile soil colloids have a strong ability to adsorb contaminants and can migrate in porous media at a rate similar to the aqueous phase [Citation2]. Due to the natural presence of nanomaterials in the environment [Citation3] and the potential risks to the ecosystem and public health, pollutant transport of nanoparticles [Citation4], colloids [Citation5], and their associated contaminants [Citation6] in saturated porous media has attracted more attention in the past decade. Advection, convection, precipitation and adsorption are a few of the physical and chemical process that occur when colloids migrate in the porous media [Citation7,8]. The adsorption of colloids in transport processes involves adhesion, deposition and release [Citation9]. Fundamentally, the transport of colloid particles in porous media depend on the colloidal size, shape and colloidal characteristics [Citation10–12]. The smaller the size of the particles the easier it is for them to migrate through a porous media [Citation13,14]. The transport of soil colloids in saturated porous media is also influenced by solution pH [Citation15] and ionic strength [Citation16]. In natural environments, both soil pH and ionic strength will change with variations in rainfall and irrigation [Citation17]. The release of the colloids due to changes in pH and ionic strength can enhance the transport of environmental contaminants adsorbed to the colloidal surface [Citation18]. Therefore a large number of studies the effects of pH and ionic strength on the transport of colloids in porous media are investigated [Citation6,19] and used a single medium, quartz sand, to simulate soil medium [Citation6,20].
In recent years, nanomaterials have been widely used and the transport of nanoparticles in the underground environment has become a worrying issue. They will enter in groundwater because of their tiny size, then they can adsorb contaminants due to their high specific surface area and carry these contaminants to move far apart [Citation21,22]. The nanoparticles are usually better than or equal to the migration of the solute, the larger NPs are carried at a higher rate and are not close to the medium due to their size [Citation23]. These factors explain why nanoparticles pose a significant risk to the subsurface environment. To date, most studies have focused on the fate and transport of artificial nanoparticles in the environment, such as titanium dioxide [Citation24], graphene oxide [Citation25] etc. A great deal of research has been done on the transport and retention of artificial nanoparticles under environmental conditions. For example, the effects of different physical and chemical conditions such as size, concentration, fluid velocity and solution chemistry (i.e. ionic strength, pH) [Citation24,26,27] on the transport and retention of nanoparticles have been determined. These studies only focus on artificial nanomaterials, which really ignore the natural nanoparticles. Soil contains large amounts of nanoparticles, which is an important source of natural nanoparticles. However, there is no study of the fate and migration of soil nanoparticles.
There are significant differences in soil composition and soil composition, structural properties and organic matter content in different soil types in China. Soil types not only determine the migration of soil particles in the natural environment, but also affect the ability of heavy metals to transport in the soil [Citation28]. Hence, unlike many studies on the transport of artificial nanoparticle or soil colloids in the porous media compacted with quartz sand, we studied the transport behaviors of natural soil nanoparticles (NS) by extraction method from four natural soil in China, aeolian sandy soil nanoparticles (AS), cultivated loessial soil nano particles (CS), manural loessial soil nanoparticles (MS) and red soil nanoparticles (RS). To better understand the transport of NS in a saturated porous media was examined and column leaching experiments were conducted at different with suspensions of NS. In addition, Derjaguin–Landau–Verwey–Overbeek (DLVO) theory was used to explain the behavior of NS transport in porous media under different pH and ionic strengths.
2. Materials and methods
2.1. Natural soil nanoparticles suspensions
Four different soil nanoparticles, aeolian soil nanoparticles (AS), cultivated loessial soil nanoparticles (CS), manural loessial soil nanoparticles (MS) and red soil nanoparticles (RS), were extracted from four different soils sampled from the agricultural fields at Shenmu Shaanxi, Ansai Ecological Experimental Station Shaanxi, Yanling Shaanxi and Panzhihua Sichuan, respectively.
Nanoparticle suspensions were derived from the parent soil following an aqueous extraction. Oven dried soil sample (20 g) was weighed into a beaker and distilled water (400 mL) was added. The sample was shaken at 170 rpm for 0.5 h in a constant temperature incubator shaker (HZQ-F100, Donglian Electron Technology Ltd., Harbin, China), followed by 30 min of ultrasonic dispersion in an ultrasonic cleaner (KQ-500DE, Kunshan Ultrasonic Instrument Company, China). The soil suspension was transferred to a measuring cylinder and allowed to settle for 24 h after which the soil suspension was extracted into a new flask using a siphon method [Citation29].
The concentration of the soil nanoparticles stocks was obtained at 243 nm by UV-visible spectrophotometry. The stock nanoparticles suspension was diluted to 100 ppm after ultrasonication in column experiments. The pH of the soil nanoparticles suspension and distilled water (DI) used for leaching was adjusted to 4, 6, and 8 using 0.5 M solutions of NaOH or HCl. The ionic strengths (0.1, 0.01, 0.001 M) were regulated by 0.1 M KCl.
2.2. Characterization of soil nanoparticles
The particle size of the soil nanoparticles was measured using an Atomic Force Microscope (AFM) (Multimode-8, Bruker, Billerica, MA, USA) and the size distribution of soil nanoparticle suspension was determined by a Laser Particle Sizer (LS-230, Beckman Coulter, Inc., USA). For AFM, the suspensions of NS were diluted to identical concentrations and applied it evenly on the mica sheet. Particles morphology was scanned using an AFM at room temperature in atmospheric conditions.
The mineral composition of soil nanoparticles was analyzed by X-ray diffraction (D/RAPID II, Rigaku, Japan). The soil nanoparticle suspension was dried to make a powder sample. The sample was spread on a slide and smooth with a glass slide, so that the particles were evenly distributed with a smooth surface.
Organic matter content of soil nanoparticles was measured via Walkley-black titrations [Citation30].The zeta potential of soil nanoparticles suspension under different IS and pH were determined using a Zeta-Plus (Zetasizer nano ZS90, Malvern Instruments, UK). The Smoluchowski’s formula was used to convert electric mobility of the quartz sand into a zeta potential [Citation31]. The properties of soil nanoparticles were shown in Tables .
Table 1. Variation of concentration and physicochemical properties soil nanoparticle suspension with soil type in pH 6, IS = 0.01 M.
Table 2. Variation in the particle size of soil nanoparticle suspensions with pH 6, IS changing and IS = 0.01 M, pH changing (unit: nm).
Table 3. Variation in the zeta potential of soil nanoparticle suspensions with pH 6, IS changing and IS = 0.01 M, pH changing (unit: mv).
2.3. Porous media
Quartz sand (Zhouzhi County Quartz Sand Ltd, China) was sieved to between 0.4–0.5 mm using a stainless steel mesh. Prior to conducting any experiments, the sand was thoroughly cleaned by soaking in a 0.1 M NaOH solution for 12 h, and then with a 0.1 M HCl solution for 12 h to remove any surface metallic ions, and then rinsed with DI water until effluent was clear. The quartz sand was subsequently dried at 105 ◦C for 24 h.
2.4. Column experiments
NS transport experiments were conducted in columns uniformly packed with quartz sand. The columns dimensions were 15 cm length × 3 cm inner diameter. Quartz sand was wet-packed using deionized (DI) water with stirring to minimize any layering and to remove air entrapment in the column [Citation32]. The porosity of the column was 0.47 and the pore volume (PV) was 50 ml.
The column was initially flushed with DI water for 2 h until the effluent was free of visible impurities. Subsequently, a column experiment was conducted by first injecting 4 pore volumes (PVs) background solutions with different pH (4, 6, 8) and ionic strengths (0.1, 0.01, 0.001 M), respectively. Thereafter the column was leached with 1.2 PVs of soil nanoparticles suspension in the same background electrolyte, followed by flushing with 2 (PVs) of background solution. The pH and IS were kept constant throughout the whole experiment. Column experiments were controlled at a specific velocity of 0.3125 cm min−1. Effluent fractions from each column (20 × 10 mL) were continuously collected in test tubes using an automatic fraction collector (BS-16A-LCD, Shanghai Huxi Analysis Instrument Factory Co., Ltd., China). The effluent soil nanoparticles concentrations was analyzed at 243 nm by UV-visible spectrophotometry (UV-2800, Unico, USA) [Citation33]. A tracer element (Cl−, 0.01 M) was used to determine the dispersion coefficient of the hydraulic properties of the columns and the diffusion coefficient could be fitted by software Stanmod. The experimental procedure for the tracer was consistent with the NS. Effluent Cl− concentration was determined by AgNO3 titration [Citation34]. All column experiments were performed in duplicate.
2.5. Mathematical model
The interaction energy between NSs and quartz sand is determined by the DLVO theory [Citation35]. The total interaction energy (Etot) is the sum of van der Waals attraction energy (Evdw) and electric double layer repulsion energy (Eedl).(1)
The van der Waals interaction is calculated using the equation [Citation36,37]:
(2)
where A is the Hamaker constant for soil nanoparticles (1.0 × 10⁻²⁰ J in quartz sand) [Citation38], r is the radius of soil nanoparticles, h is the separation distance between soil nanoparticles and quartz surface, and λ is the characteristic wavelength of interaction and was set as 100 nm.
The electrical double layer interaction energy (Eedl) as a function of separation distance between an infinite plane and a sphere immersed in water is given by equation [Citation39,40]:
(3)
where ε0 is the vacuum permittivity (8.85 × 10⁻¹² C2/Jm), εr is the relative dielectric permittivity of water (78.5), and
are the surface potentials of soil nanoparticles and quartz sand, respectively, κ is the Debye reciprocal length and can be calculated as:
(4)
where NA is the Avogadro number (6.02 × 10²³ mol−1), e is the electron charge (−1.602 × 10⁻¹⁹ C), I is the ionic strength of the background electrolyte, K is Boltzmann constant (1.38 × 10²³ J/K), and T is Kelvin temperature (298 K).
The one-dimensional advection-dispersion equation coupled with reaction terms was used to simulate the transport of soil colloids in the water saturated quartz sand column. It was assumed that the interaction between the soil colloids and the sand grains in the column were affected by irreversible-kinetic reactions due to the reversible reaction was almost impossible to observe. The governing equation can be written as [Citation25]:(5)
(6)
where Cw is the soil colloid concentration in pore water (mg L−1); which reflects the magnitude of equilibrium reaction in the quartz sand column; D is the dispersion coefficient (cm2 min−1); v is the flow rate (cm min−1); ρ is the medium bulk density (g cm−3); θ is the porosity; and k is first-order kinetic retention constant (min−1). In this equation, the release of colloids is neglected, because the release of colloids was shown to too slow during the timeframe of this experiment [Citation41].
As the migration of soil nanoparticles in porous media is still consistent with colloid filtration theory [Citation42], one dimensional advection-dispersion equation was applied to simulate the experimental breakthrough curves, meanwhile the parameter k in the equation can be fitted with the transport fitting software Stanmod [Citation43].
3. Results and discussion
3.1. Effect of NS size
AFM clearly showed the size and shape of the different soil nanoparticles (Figure ). AS had a relatively larger particle diameter compared with the other soil nanoparticles because the composition of the aeolian sandy soil was mainly quartz, which did not favor the formation of smaller particles [Citation44]. The average particle diameters of NS were 102 ± 8, 97 ± 8, 54 ± 5 and 65 ± 7 nm for AS, CS, MS and RS, respectively.
Figure 1. The AFM images of different NS: (a) AS, (b) MS, (c) CS, (d) RS.
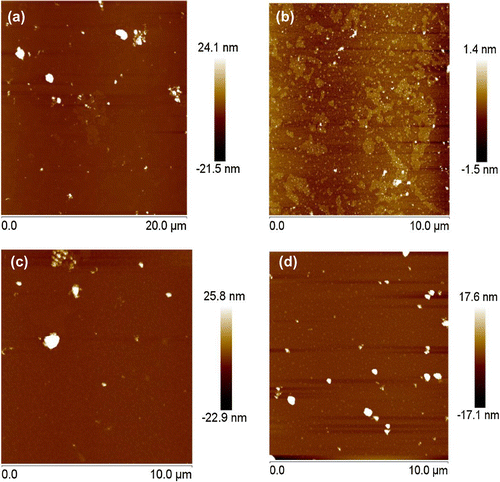
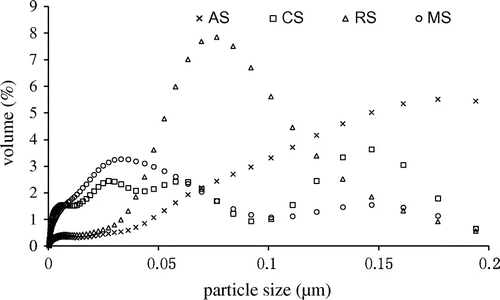
One limitation of AFM was that was applied only to dry samples. Figure showed that the dispersion of soil nanoparticles was not very homogeneous, it was possible that the soil particles were aggregated during the drying process, which might make the measured average dimeter greater than the hydrodynamic size. The size distribution of soil nanoparticles was also determined using a Laser Particle Sizer shown in Figure . While most particles were <100 nm, the percentage of particles <100 nm varied with the parent soil, being 68.4, 99.9, 95.3 and 99.7% for AS, RS, CS and MS samples, respectively. The transport of soil colloids in porous medium would be directly affected by the soil nanoparticles size, since larger soil colloids were blocked by porous medium resulting in adsorption and deposition [Citation22]; soil colloidal transport behavior was closely related to particle size distribution [Citation45].
Figure 2. Particle size volume of NS used a Laser Particle Sizer.
3.2. Electrokinetic properties of NS under different pH and ionic strength
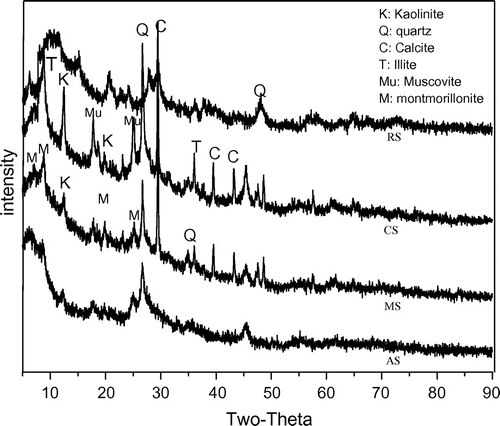
The overall stability of colloids was typically characterized by the suspension zeta potential [Citation46], which was influenced by the suspension pH and ionic strength. Here zeta potential of soil nanoparticle suspension under acidic condition was larger than that of neutral and alkaline condition (Table ). The zeta potential was previously shown to be affected by the introduction of OH- into the colloidal double layer [Citation47] where higher negative charge resulted in higher repulsive forces which consequently enhanced colloidal stability. The Zeta potential changed significantly with the change of pH, but was far less prominent for MS when compared to other soil nanoparticles. This difference in behavior of the soil nanoparticles may be due to differences in soil nanoparticles mineral composition. Figure , XRD pattern of NS, which showed typical spectra of mineral materials having main and secondary peaks at 2θ = 30° and 8°, respectively. It could be seen from the XRD pattern that the main mineral composition of NS was quartz and calcite, which also contained a small amount of kaolinite, montmorillonite and muscovite. For the MS, the content of montmorillonite was higher than other NSs. Hence, a change in pH would have a much lesser effect on MS that contained montmorillonite clays because here charge was generated by lattice substitution and was not pH dependent [Citation48].
Figure 3. XRD spectra of different NS.
The zeta potential of nanoparticles generally increased with increasing ionic strength except MS (Table ) which was attributed to changes in the thickness of the diffusion electric double layer. The diffusion electric double layer of the colloid was known to be thicker at lower ionic strengths, and the repulsion force between the colloid particles was thus larger, which was beneficial for enhanced colloid stability. In agreement with the results observed here the thickness of the soil nanoparticle diffusion electric double layer reduces as ionic strength increased, resulting in a decrease in repulsive force between soil nanoparticle resulting in decreased soil nanoparticle stability and easier flocculation and precipitation [Citation49]. The Zeta potential of MS was the lowest at 0.01 M compared to 0.1 M and 0.001 M. This might be due to the high levels of organic matter in MS. It had been studied that only when the ionic strength of agricultural soil colloid was less than 0.1 M, the high content of organic matter in agricultural soil colloid would lead to the stability enhanced with increasing ionic strength [Citation50].
3.3. DLVO theory
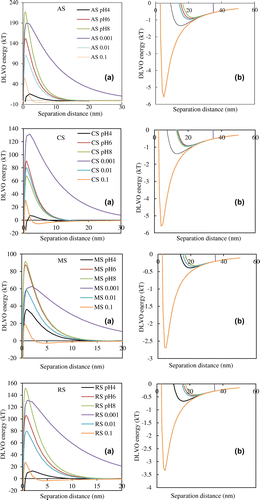
DLVO theory was used to calculate the interaction between soil colloid and quartz sand to predict the behavior of soil colloid transport and retention in porous media [Citation51]. The DLVO interaction energy profiles at the range of pH and ionic strengths were shown in Figure . The results showed that the energy barrier increased with the increase of pH value and the decrease of ionic strength. The variation ranges of different NS were 15–220 kT (AS), 10–130 kT (CS), 15–90 kT (MS), 13–150 kT (RS), respectively, indicating that the NS transport readily increased with increasing pH and with decreasing ionic strength. At pH 4.0, the energy barrier between soil nanoparticles and quartz sand is smallest compared to other pH, so the soil nanoparticle is more easily irreversibly deposited to the energy barrier. However, four kinds of NSs showed significant differences at pH 8. AS and RS were difficult to deposit to the energy barrier, which was due to a high energy barrier. MS and CS is easier contrary. And their energy barriers at pH 8 were 220 kT (AS), 67 kT (CS), 98 kT (MS) and 150 kT (RS), respectively. With the decrease of ionic strength, the trend of energy barrier of soil nanoparticles was also the same, but the maximum value of energy barrier was less than pH. The soil nanoparticles were retained in the column under ionic strength occurred in the minimum secondary energy, because they were easily captured at the minimum secondary energy [Citation52]. Figure showed that the 0.1 M ionic strength had a lower primary energy barrier and a deeper secondary energy minimum than other ionic strength. This means that the NS with high ionic strength was easier to deposit in porous media comparison with the lower ionic strength.
Figure 4. DLVO energy between NS and sand under three different pH and ionic strength conditions. The primary energy barriers for NS and sand (a) and the secondary energy minimum for NS and sand (b).
3.4. Effect of pH on NS transport
Retention of NS in saturated sand column was evaluated through analysis of experimental effluent breakthrough concentration. The breakthrough curves of NS in Figures were constructed as plots of the ratio of effluent concentration to the injection concentration (C/C0). The breakthrough curves of NS transport at pH 4, 6 and 8 were shown in Figure . The first-order kinetic retention rate constant (k) and the recovery rate were shown in Table . The result demonstrated that recovery rate of AS and RS increased with increasing pH. The parameter k decreased with the increase of pH, it confirmed the experimental results of transport of AS and RS. However, the recovery rate of RS was lower than AS. This was attributed to differences in mineral composition of the different soil nanoparticles (Figure ). The main mineral component of AS was quartz and was similar to the composition of the porous medium used in this study. Hence, AS were not easily adsorbed to the surface of quartz sand. In contrast, the mineral composition of RS was complex, containing calcite, kaolinite and quartz (Figure ). Since calcite that was a metal oxide mineral and kaolinite had a small amount of positive charge compared to others mineral. RS could be more easily deposited onto the surface of quartz sand. Changes in colloidal solution pH were also known to be influenced by surface properties and chemical composition [Citation1,9].
Figure 5. The effect of pH on the transport of NS ((a) AS, (b) RS, (c) CS, (d) MS) in saturated porous media.
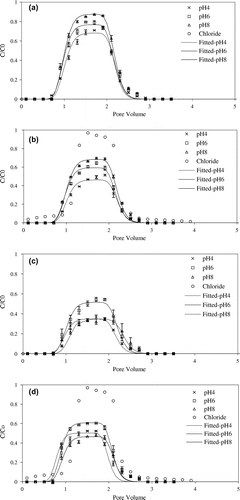
Figure 6. The effect of ionic strength on the transport of NS ((a) AS, (b) RS, (c) CS, (d) MS) in saturated porous media.
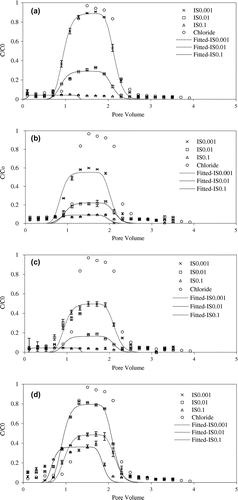
Table 4. Best-fit parameter values and recovery rate calculation for soil nanoparticles with varied pH in IS 0.01 mol L−1.
The recoveries rate of CS and MS was pH6 > pH4 > pH8, which was different from the change trend of AS and RS. Our experimental results were not consistent with the predictions of the DLVO theory. It was reasonable to assume that difference of composition in NS produced this result. As shown in Figure that the mineral composition of CS included muscovite, illite more than any of the other NS. Illite minerals had tend to flocculate due to hydration [Citation53], and both flocculation and the presence of mineral oxides resulted in increased colloid adsorption [Citation54]. For MS, MS had a higher organic matter content compared to other NS (Table ). Soil organic matter was mainly composed of humic acids, where the morphology of humic acids in aqueous solution was strongly influenced by pH [Citation55]. Humic acids typically had a linear structure occupying the largest volume under neutral and alkaline conditions, which decreased significantly under acidic conditions, so that the transport of particles in porous media could be related to the morphology of the particles [Citation56]. Previous studies had mentioned that humic acids tended to stable under alkaline conditions and could also combine with soil clay particles [Citation57,58], and thus MS were more likely to be deposited compared to AS and RS. In addition, the recovery of MS was higher than CS, which was due to the zeta potential of CS (Table ) was more influenced by pH than MS, meanwhile the suspension zeta potential of MS was lower than that of CS under acidic and alkaline conditions.
3.5. Effect of ionic strength on NS transport
The peak for soil nanoparticles breakthrough curves generally decreased with increasing ionic strength (Figure ) and the k value generally increased with increasing in ionic strength (Table ). However, the MS results did not follow this general trend. For MS, the k value of the soil nanoparticles initially decreased as IS increased from 0.001 to 0.01 before increasing with increasing ionic strength (Table ). According to colloidal theory, the diffusion layer of the quartz sand was thicker at lower ionic strengths and the electrolyte ion shielding effect on particle surface charge was weak resulting in stronger mutual repulsion between quartz sand and the soil nanoparticles. When the ionic strength was gradually increased, the surface diffusion layer of the quartz sand and the soil nanoparticles were compressed, and the electrostatic repulsion force reduces, resulting in deposition of particles on the surface of quartz sand [Citation14]. Furthermore, with the increase in concentration of the electrolyte solution, the complexation between the electrolyte and the surface functional groups of the soil nanoparticle were enhanced, and the negative charge on the soil nanoparticle surface would be reduced [Citation49] so that electrostatic repulsion between the particles and the medium was weakened, which resulted in the deposition of soil nanoparticles.
Table 5. Best-fit parameter values and recovery rate calculation for soil nanoparticles with varied IS in pH 6.
When the ionic strength was 0.001 M, the recovery of AS was greater than that of CS and RS, but was otherwise similar at higher ionic strengths. At the lower ionic strength the differences in the colloidal diffusion layers were mainly due to the differences in the composition of the soil nanoparticles. However, the diameter of soil nanoparticle increased sharply when the ionic strength of the suspension was higher than the critical ionic strength [Citation59], which led to the recovery of the three NSs were low at high ionic strength. With the increase of the ionic strength of the suspension, the double layer thickness of the surface of the soil nanoparticle decreased sharply and the electrostatic repulsion between the particles decreased, and van der Waals force was enhanced by shortening the distance between soil nanoparticle [Citation60]. This promoted the aggregation of particles and the recovery rate was reduced [Citation61].
However, the MS results did not follow this general trend. Compared with the other three soil nanoparticles the changes in recovery and k for MS were different from all other soil nanoparticles, the k value of the soil nanoparticles initially decreased as IS increased from 0.001 to 0.01 before increasing with increasing ionic strength (Table ). It was also not consistent with the predictions of the DLVO theory. Based on the previous analysis of the Zeta potential of MS, we proposed that MS contained a higher organic content and elevated organic contents were known to increase the dispersion of particles and affect the stability and transport of the soil nanoparticles at relatively low ionic strengths [Citation62].
4. Conclusion
The behavior of NS transport in the saturated porous media was demonstrated by column experiments and was consistent with the predictions of the DLVO theory. NS transport through quartz sand varied with the origin of the NS and transport decreased in the order AS > RS > MS > CS. NS transport was enhanced with increasing pH and decreasing ionic strength. With some exceptions, attributable to differing chemical composition of the soil nanoparticles, the recoveries of NS generally decreased with increasing ionic strength. It was implied that NS may be released to the groundwater environment during a change in pH and ionic strength of the soil suspension.
Disclosure statement
No potential conflict of interest was reported by the authors.
Funding
This research was partially supported by the National Natural Science Foundation of China [grant number 21207107], [grant number 41771260], Key Research and Development Program of Shaanxi Province [grant number 2017SF-377], Industry University Research Application Cooperative Innovation Key Program of Yangling Agricultural Hi-tech Industries Demonstration Zone [grant number 2017CXY-10], and the Chinese Scholarship Council.
References
- Liang X, Jin L, Chen Y, et al. Effect of pH on the release of soil colloidal phosphorus. J Soils Sediments. 2010;10(8):1548–1556.10.1007/s11368-010-0275-6
- Barton CD, Karathanasis AD. Influence of soil colloids on the migration of atrazine and zinc through large soil monoliths. Water Air Soil Pollut. 2003;143(1/4):3–21.10.1023/A:1022886225564
- Klaine SJ, Alvarez PJJ, Batley GE, et al. Nanomaterials in the environment: behavior, fate, bioavailability, and effects. Environ Toxicol Chem. 2008;27(9):1825–1851.10.1897/08-090.1
- Nowack B, Bucheli TD. Occurrence, behavior and effects of nanoparticles in the environment. Environ Pollut. 2007;150(1):5–22.10.1016/j.envpol.2007.06.006
- Bradford SA, Bettahar M. Concentration dependent transport of colloids in saturated porous media. J Contam Hydrol. 2006;82(1–2):99–117.10.1016/j.jconhyd.2005.09.006
- Sen TK, Khilar KC. Review on subsurface colloids and colloid-associated contaminant transport in saturated porous media. Adv Colloid Interface Sci. 2006;119(2–3):71–96.
- Patil S, Tawfiq K, Chen G. Colloid release and transport in agricultural soil as impacted by solution chemistry. J Urban Environ Eng. 2011;5(2):84–90.10.4090/juee
- Zhang W, Tang XY, Weisbrod N, et al. A coupled field study of subsurface fracture flow and colloid transport. J Hydrol. 2015;524:476–488.10.1016/j.jhydrol.2015.03.001
- Bradford SA, Kim HN, Haznedaroglu BZ, et al. Coupled factors influencing concentration-dependent colloid transport and retention in saturated porous media. Environ Sci Technol. 2009;43(18):6996–7002.10.1021/es900840d
- Zhang W, Niu JZ, Morales VL, et al. Transport and retention of biochar particles in porous media: effect of pH, ionic strength, and particle size. Ecohydrology. 2010;3(4):497–508.10.1002/eco.v3:4
- Liu Q, Lazouskaya V, He Q, et al. Effect of particle shape on colloid retention and release in saturated porous media. J Environ Qual. 2010;39(2):500–508.10.2134/jeq2009.0100
- Kim HJ, Phenrat T, Tilton RD, et al. Effect of kaolinite, silica fines and pH on transport of polymer-modified zero valent iron nano-particles in heterogeneous porous media. J Colloid Interface Sci. 2012;370(1):1–10.10.1016/j.jcis.2011.12.059
- Bradford SA, Torkzaban S, Walker SL. Coupling of physical and chemical mechanisms of colloid straining in saturated porous media. Water Res. 2007;41(13):3012–3024.10.1016/j.watres.2007.03.030
- Yu C, Muñoz-Carpena R, Gao B, et al. Effects of ionic strength, particle size, flow rate, and vegetation type on colloid transport through a dense vegetation saturated soil system: experiments and modeling. J Hydrol. 2013;499(9):316–323.10.1016/j.jhydrol.2013.07.004
- Ma J, Guo H, Lei M, et al. Blocking effect of colloids on arsenate adsorption during co-transport through saturated sand columns. Environ Pollut. 2016;213:638–647.10.1016/j.envpol.2016.03.020
- Zhou D, Wang D, Long C, et al. Transport and re-entrainment of soil colloids in saturated packed column: effects of pH and ionic strength. J Soils Sediments. 2011;11(3):491–503.10.1007/s11368-010-0331-2
- Li Y, Tan W, Koopal LK, et al. Influence of soil humic and fulvic acid on the activity and stability of lysozyme and urease. Environ Sci Technol. 2013;47(10):5050–5056.10.1021/es3053027
- Missana T, Benedicto A, Mayordomo N, et al. Analysis of anion adsorption effects on alumina nanoparticles stability. Appl Geochem. 2014;49:68–76.10.1016/j.apgeochem.2014.04.003
- Zhuang J, Tyner JS, Perfect E. Colloid transport and remobilization in porous media during infiltration and drainage. J Hydrol. 2009;377(1–2):112–119.10.1016/j.jhydrol.2009.08.011
- Torkzaban S, Bradford SA, Genuchten MTV, et al. Colloid transport in unsaturated porous media: the role of water content and ionic strength on particle straining. J Contam Hydrol. 2008;96(1–4):113–127.10.1016/j.jconhyd.2007.10.006
- Madej E, Klink S, Schuhmann W, et al. Effect of the specific surface area on thermodynamic and kinetic properties of nanoparticle anatase TiO2 in lithium-ion batteries. J Power Sources. 2015;297(1):140–148.10.1016/j.jpowsour.2015.07.079
- Arab D, Pourafshary P, Ayatollahi S, et al. Remediation of colloid-facilitated contaminant transport in saturated porous media treated by nanoparticles. Int J Environ Sci Technol. 2014;11(1):207–216.10.1007/s13762-013-0311-3
- Lamy E, Lassabatere L, Bechet B, et al. Effect of a nonwoven geotextile on solute and colloid transport in porous media under both saturated and unsaturated conditions. Geotext Geomembr. 2013;36(36):55–65.10.1016/j.geotexmem.2012.10.009
- Chowdhury I, Hong Y, Honda RJ, et al. Mechanisms of TiO2 nanoparticle transport in porous media: role of solution chemistry, nanoparticle concentration, and flowrate. J Colloid Interface Sci. 2011;360(2):548–555.10.1016/j.jcis.2011.04.111
- Liu L, Gao B, Wu L, et al. Deposition and transport of graphene oxide in saturated and unsaturated porous media. Chem Eng J. 2013;229(4):444–449.10.1016/j.cej.2013.06.030
- Chen G, Liu X, Su C. Transport and retention of TiO2 rutile nanoparticles in saturated porous media under low-ionic-strength conditions: measurements and mechanisms. Langmuir. 2011;27(9):5393–5402.10.1021/la200251v
- Godinez IG, Darnault CJG. Aggregation and transport of nano-TiO2 in saturated porous media: Effects of pH, surfactants and flow velocity. Water Res. 2011;45(2):839–851.10.1016/j.watres.2010.09.013
- Kowalkowski T, Tutu H, Cozmuta LM, et al. Assessment of mobility of heavy metals in two soil types by use of column leaching experiments and chemometric evaluation of elution curves. Int J Environ Anal Chem. 2010;90(10):797–811.10.1080/03067310903195003
- Missong A, Bol R, Willbold S, et al. Phosphorus forms in forest soil colloids as revealed by liquid-state 31P-NMR. J Plant Nutr Soil Sci. 2016;179(2):159–167.10.1002/jpln.201500119
- Gelman F, Binstock R, Halicz L. Application of the Walkley-Black titration for the organic carbon quantification in organic rich sedimentary rocks. Fuel. 2012;96(1):608–610.10.1016/j.fuel.2011.12.053
- Mishchuk NA, Dukhin SS. Electrophoresis of solid particles at large Peclet numbers. Electrophoresis. 2002;23(13):2012–2022.10.1002/1522-2683(200207)23:13<2012::AID-ELPS2012>3.0.CO;2-Y
- Sun H, Gao B, Tian Y, et al. Kaolinite and lead in saturated porous media: facilitated and impeded transport. J Environ Eng. 2010;136(11):1305–1308.10.1061/(ASCE)EE.1943-7870.0000250
- Yin XQ, Gao B, Ma LQ, et al. Colloid-facilitated Pb transport in two shooting-range soils in Florida. J Hazard Mater. 2010;177(1–3):620–625.10.1016/j.jhazmat.2009.12.077
- Mier MP, Ibañez R, Ortiz I. Influence of ion concentration on the kinetics of electrodialysis with bipolar membranes. Sep Purif Technol. 2008;59(2):197–205.10.1016/j.seppur.2007.06.015
- Derjaguin B, Landau L. Theory of the stability of strongly charged lyophobic sols and of the adhesion of strongly charged particles in solutions of electrolytes. Prog Surf Sci. 1941;43(1–4):30–59.
- Gregory J. Approximate expressions for retarded van der waals interaction. J Colloid Interface Sci. 1981;83(1):138–145.10.1016/0021-9797(81)90018-7
- Elimelech M, Jia X, Gregory J, et al. Particle deposition and aggregation. Part Deposition Aggregation. 1998;88(6):xiii–xv.
- Zhou D, Wang D, Long C, et al. Transport and re-entrainment of soil colloids in saturated packed column: effects of pH and ionic strength. J Soils Sediments. 2011;11(3):491–503.10.1007/s11368-010-0331-2
- Elimelech M, O’Melia CR. Effect of particle size on collision efficiency in the deposition of Brownian particles with electrostatic energy barriers. Langmuir. 1990;6(6):1153–1163.10.1021/la00096a023
- Hogg R, Healy TW, Fuerstenau DW. Mutual coagulation of colloidal dispersions. Trans Faraday Soc. 1966;62:1638–1651.10.1039/tf9666201638
- Bradford SA, Torkzaban S, Simunek J. Modeling colloid transport and retention in saturated porous media under unfavorable attachment conditions. Water Resour Res. 2011;47(10):599–609.
- Gurunathan S, Han JW, Eppakayala V, et al. Biocompatibility of microbially reduced graphene oxide in primary mouse embryonic fibroblast cells. Colloids Surf B. 2013;105(6):58–66.10.1016/j.colsurfb.2012.12.036
- Feinstein DT, Guo W. STANMOD: a suite of windows-based programs for evaluating solute transport. Ground Water. 2010;42(4):482–487.
- Jin Z, Lei J, Li S, et al. Metabolic characteristics of microbial communities of Aeolian sandy soils induced by saline water drip irrigation in shelter forests. Eur J Soil Sci. 2015;66(3):476–484.10.1111/ejss.2015.66.issue-3
- Zhang W, Tang XY, Xian QS, et al. A field study of colloid transport in surface and subsurface flows. J Hydrol. 2016;542:101–114.10.1016/j.jhydrol.2016.08.056
- Bijarbooneh FH, Zhao Y, Kim JH, et al. Aqueous colloidal stability evaluated by zeta potential measurement and resultant TiO2 for superior photovoltaic performance. J Am Ceram Soc. 2013;96(8):2636–2643.10.1111/jace.2013.96.issue-8
- Yang F, Niu Q, Lan Q, et al. Effect of dispersion pH on the formation and stability of Pickering emulsions stabilized by layered double hydroxides particles. J Colloid Interface Sci. 2007;306(2):285–295.10.1016/j.jcis.2006.10.062
- Xi J, He M, Kong L. Adsorption of antimony on kaolinite as a function of time, pH, HA and competitive anions. Environ Earth Sci. 2016;75(2):1–7.
- Borgnino L. Experimental determination of the colloidal stability of Fe(III)-montmorillonite: effects of organic matter, ionic strength and pH conditions. Colloids Surf A. 2013;423(423):178–187.10.1016/j.colsurfa.2013.01.065
- Shang SB, Wang FY, Xu-Qian Li. Study on stability and mobility of soil colloids based on physicochemical property. Soils. 2010;42(6):1015–1019.
- Hoek EMV, Agarwal GK. Extended DLVO interactions between spherical particles and rough surfaces. J Colloid Interf Sci. 2006;298(1):50–58.10.1016/j.jcis.2005.12.031
- Feriancikova L, Bardy SL, Wang L, et al. Effects of Outer Membrane Protein TolC on the transport of Escherichia coli within saturated quartz sands. Environ Sci Technol. 2013;47(11):5720–5728.10.1021/es400292x
- Konan KL, Peyratout C, Smith A, et al. Surface modifications of illite in concentrated lime solutions investigated by pyridine adsorption. J Colloid Interf Sci. 2012;382(1):17–21.10.1016/j.jcis.2012.05.039
- Chen Y, Liu S, Wang G. A kinetic investigation of cationic starch adsorption and flocculation in kaolin suspension. Chem Eng J. 2007;133(1):325–333.10.1016/j.cej.2007.02.019
- DiDonato N, Chen H, Waggoner D, et al. Potential origin and formation for molecular components of humic acids in soils. Geochim Cosmochim Acta. 2016;178:210–222.10.1016/j.gca.2016.01.013
- Xu S, Liao Q, Saiers JE. Straining of nonspherical colloids in saturated porous media. Environ Sci Technol. 2008;42(3):771–778.10.1021/es071328w
- Tombácz E, Libor Z, Illés E, et al. The role of reactive surface sites and complexation by humic acids in the interaction of clay mineral and iron oxide particles. Org Geochem. 2004;35(3):257–267.10.1016/j.orggeochem.2003.11.002
- Zhang L, Luo L, Zhang S. Integrated investigations on the adsorption mechanisms of fulvic and humic acids on three clay minerals. Colloids Surf A. 2012;406(14):84–90.10.1016/j.colsurfa.2012.05.003
- Ma H, Johnson WP. Colloid retention in porous media of various porosities: predictions by the hemispheres-in-cell model. Langmuir. 2010;26(3):1680.10.1021/la902657v
- Fang J, Xu MJ, Wang DJ, et al. Modeling the transport of TiO2 nanoparticle aggregates in saturated and unsaturated granular media: effects of ionic strength and pH. Water Res. 2013;47(3):1399–1408.10.1016/j.watres.2012.12.005
- Zevi Y, Dathe A, Gao B, et al. Transport and retention of colloidal particles in partially saturated porous media: Effect of ionic strength. Water Resour Res. 2009;45(12):69–76.
- Petzold G, Geissler U, Smolka N, et al. Influence of humic acid on the flocculation of clay. Colloid Polym Sci. 2004;282(7):670–676.