
 ?Mathematical formulae have been encoded as MathML and are displayed in this HTML version using MathJax in order to improve their display. Uncheck the box to turn MathJax off. This feature requires Javascript. Click on a formula to zoom.
ABSTRACT
Perceived quality is one of the most critical aspects of product development that defines the successful design. This paper presents a new approach to perceived quality assessment by examining its elements, decomposed into a structure with the bottom-up sensory approach from the level of basic (‘ground’) attributes, covering almost every aspect of quality perception from the engineering viewpoint. The paper proposes a novel method for perceived quality attributes relative importance ranking, resulting in the balanced perceived quality of the final product within the given conditions. The proposed method helps to reach the equilibrium of the product’s quality equation from the perspective of design effort, time, and costs estimations. The authors introduce the Perceived Quality Framework (PQF), which is the taxonomy system for perceived quality attributes and the core of the attributes importance ranking (PQAIR) method. The research outcomes are based on findings of the qualitative exploratory study, including European and North American premium and luxury automotive manufacturers. An empirical structural validity test was performed to assess the usability and rigour of the proposed method. The results indicate that perceived quality evaluation can be significantly improved during all stages of product development.
Abbreviations: PQF: Perceived Quality Framework; PQAIR: Perceived Quality Attributes Importance Ranking; TPQ: Technical Perceived Quality; VPQ: Value-based Perceived Quality; OEM: Original Equipment Manufacturer.
1. Introduction
Speaking of perceived quality, we are dealing with a complex, multifaceted adaptive system; a system where a human is the main agent. Therefore, as in any human adaptive system, single all-effective ‘causes’ cannot exist (Smil Citation2017). In this research, we justify the engineering viewpoint regarding perceived quality as an inevitable part of new product development. Making a product with excellent perceived quality is not an extremely difficult task for a product development project today – almost anything related to superior quality can be achieved with increased cost and time investments. The truly challenging task is to reach optimal perceived quality level based on given boundaries regarding technologies, development time, production systems capabilities, and financial limitations. For that reason, perceived quality must be controlled during all stages of product development. However, we were unable to identify up until now a framework or methodology which would explicitly define perceived quality and its elements and be able quantitively to assess the impact of a single perceived quality attribute on the product design as a whole. Ability to manage perceived quality can be expressed in the single open question, ‘Which perceived quality attributes do engineers have to focus on to receive the highest level of a customer’s appreciation?’ This normative question is usually followed by the prescriptive question, ‘How can we measure the importance of a single perceived quality attribute or a group of attributes for the customer?’ To address these questions, we propose a new method for perceived quality evaluation that can be applied to a variety of products. We present the Perceived Quality Framework (PQF), a taxonomy structure of perceived quality attributes and the Perceived Quality Attributes Importance Ranking (PQAIR) method. The PQF illustrates the attribute-centric engineering viewpoint on quality perception, developed through reciprocated studies of the automotive industry. The PQAIR method equips engineers with practical tools for perceived quality evaluation. The reason we have chosen the automotive industry is to set powerful goals. The automotive industry not only produces a complex product – the car, but it is a highly competitive production area itself and needs to spend its money on the right things to sustain competition. A combination of mechanical parts, software pieces, various types of materials, advanced manufacturing processes, and high production volumes make the automotive industry stand out in comparison to other sectors. We genuinely believe that the experience accumulated by the industry needs to be considered to maximise impact for researchers and their discoveries.
However, the PQF and PQAIR method are not limited to use in the automotive industry alone. The PQF focuses on the product attributes that communicate quality to the customer – i.e. perceived quality attributes. Perceived quality attributes can be defined as characteristics that convey functional and psychosocial benefits of a product to the customer (Steenkamp Citation1990). While we have collected, and structured information about perceived quality attributes applicable to the automotive industry, the same or a modified set of attributes can be used in various domains of product development for evaluation of perceived quality. Research in this area indicates the full spectrum of opportunities regarding the use of PQF and PQAIR method for consumer products. If a company wants to communicate quality aspects of the product, there is eventually a need to bring these characteristics into the measurable space of perceived quality attributes. There is evidence that insufficient methodological support causes the industry to employ intuitive rather than strategic or systematic communication practices (Liem, Abidin, and Warell Citation2009). In our previous work (Stylidis et al. Citation2014), we demonstrated how companies translate their core values into the perceived quality attributes and how customers perceive these core values. In practice, Original Equipment Manufacturers (OEMs) usually communicate their values to the customers according to their internal culture and traditions. At this point, the PQF can provide methodological support to the process of communication with the customer through product design. Today a variety of perceived quality attributes are in the spotlight of research interest for product development. For instance, according to Forslund, Karlsson, and Söderberg (Citation2013), misaligned or improperly positioned split-lines (a combination of the following attributes describes a quality of a split line in PQF: ‘Gap,’ ‘Flush,’ ‘Parallelism’) negatively influence customer perception of a product. Hoffenson, Dagman, and Söderberg (Citation2015), demonstrated a quantitative understanding of the customer-value split lines phenomena when evaluating product quality. While these experiments considered only single or just a few attributes – the PQF provides a holistic understanding of the design direction when speaking of a product’s perceived quality. Another example, illustrating the possibilities of PQF implementation, is the study presented by Skou and Munch (Citation2016), investigating the values and aesthetics in ‘New Nordic’ design. This research provides an example of the ‘typical Scandinavian’ armchair, where ‘pressed plywood wraparound veneer not only functions as a comfortable armrest but is also the mechanism that holds the chair together.’ The particular armchair already depicts attributes included in the PQF, such as ‘Gap,’ ‘Flush,’ ‘Surface Finish,’ ‘Material Pattern’ and others related to the material, geometry, appearance, paint, joining qualities and solidity (see Section 3.2) The relative importance of these attributes can be assessed with the PQAIR method to give the designer a full understanding and control over the impactful areas of the product with regard to perceived quality.
In this paper, we aim to contribute to the product development approach by introducing the Perceived Quality Framework. This attribute-centric framework can serve as a platform for robust discourse around the theme of perceived quality that is not limited by the product type or production method. To achieve this, we performed data-collection studies over four years, examining ten global automotive companies from five different countries. We will then demonstrate a method to evaluate the perceived quality of a product (PQAIR). This study builds on the assumption that multi-sensory information related to a product, assessed with the help of attribute-centric framework and mixed methods is a promising approach for tackling a complexity of the perceived quality evaluation.
The remainder of this paper is structured as follows: Section 2 introduces the background and problem statement; Section 3 describes the development of PQF and results of the exploratory study; Section 4 presents the PQAIR method; Section 5 demonstrates the outcomes of perceived quality attributes ranking pilot experiment, designed and performed to assess the applicability of the PQAIR method; Section 6 discusses findings and suggests further research; Section 7 concludes this work.
2. Background
Considerable research, including various approaches to perceived quality, has been conducted primarily to attempt to identify the dimensions and nature of product quality (Olson and Jacoby Citation1972; Gilmore Citation1974; Crosby Citation1980; Garvin Citation1984; Zeithaml Citation1988; Steenkamp Citation1990; Reeves and Bednar Citation1994; Mitra and Golder Citation2006; Aaker Citation2009). However, this body of work, contributing mainly to the field of marketing and manufacturing science, has often depicted perceived quality as the antagonistic entity to the ‘real’ or ‘objective’ quality (i.e. not quantifiable, imaginary, subjective). Only recently, Golder, Mitra, and Moorman (Citation2012) proposed an integrative quality framework as a prominent approach to link the connections between objective and subjective quality domains. Alas, the engineering approach remains ambiguously defined. Hereafter, we describe the evolution of the views on perceived quality in product development and engineering practice. We begin with the obvious question, ‘What is a perceived quality?’
2.1. Definition of perceived quality from engineering viewpoint
Perceived quality is a multi-dimensional entity, an outcome of designer/customer convention, and can be seen differently by the different research schools of thought (e.g. philosophy, marketing science, engineering, manufacturing), so it is essential to set definitions.
There are several ‘marketing-oriented’ interpretations of perceived quality. For example, Mitra and Golder (Citation2006), see perceived quality as ‘perception of the customer’ and oppose it to the ‘objective’ quality. These views on perceived quality derive from the earlier research of Zeithaml (Citation1988), where perceived quality is defined as a subjective customer’s judgment (different from objective quality) regarding overall product superiority. A similar opinion is expressed by Aaker (Citation2009), defining the perceived quality as ‘the customer’s perception of the overall quality or superiority of a product or service with respect to its intended purpose, relative to alternatives.’ However, these definitions do not consider the engineering part in the equilibrium of perceived quality and instead focus solely on the customer. As a result, it is hard to start a meaningful discussion about the quantification of quality perception. From the engineering point of view, the perceived quality domain is a place where the product meaning, form, sensorial properties, and their execution intersect with human experience. Such an experience is driven by the interplay between product quality and its context. For example, in contrast to a rigid, formal definition of manufacturing quality – engineering tradition regarding perceived quality is to produce events that make the customer aware of how things are done. High perceived quality means attractiveness of the product to the customer. Yet attractiveness is a relative degree. It is based on our previous experiences and exists only in contrast to what does not attract attention (Falk et al. Citation2017). In industrial practice, engineers are continuously challenged with a polylemma of choice between equally important attributes and their performance; i.e. in the automotive industry should time and resources be invested in the minimisation of split lines gaps around rear lights of a car, or focused on a cut & sew execution of interior materials? At this point, we define engineering design intent as a rationale for product attributes that conveys the intrinsic requirements of the design. The equation, where engineering design intent is meeting customer’s expectations regarding the product, has to reach an equilibrium. Therefore, the correct perceived quality attributes prioritisation for the new product will lead to a successful design and customers’ appreciation.
Previously, we proposed a two-dimensional typology of perceived quality: Technical Perceived Quality (TPQ) and Value-based Perceived Quality (VPQ) (Stylidis, Wickman, and Söderberg Citation2015). TPQ includes everything that is part of a product (or service) and can be controlled by engineering specifications together with the functional product requirements (intrinsic attributes). VPQ is more related to brand image, brand heritage, affective customer judgments, hedonic or social values, the impact from other global attributes, advertising, and marketing promotion techniques (extrinsic attributes). Such a distinction is essential since perceived quality can be seen differently depending on the academic field. The attribute-centric approach to TPQ at the ‘bottom’ level, expressed with the Ground Attributes. The Ground Attributes are measurable variables, isolated for a specific product as they depict a borderline for meaningful discussion between designer/engineer and customer. The nature of Ground Attributes can be composite and may include materials, shapes, joining methods or parts; however, their primary purpose is to communicate engineering design intent effectively to the customer. The Ground Attributes have a further advantage – the ability to convey a meaning of perceived quality attributes as engineers see it. It is only uninformative (for the customer) technical specifications that are left beyond the Ground Attributes level. We want to stress that perceived quality attributes can also be defined differently by different OEMs; however, the overall goal of the attribute’s definition is to secure correct content and execution of the final product. All components and system solutions shall be built in such a way that the product is perceived as being one of high quality. This paper focuses on TPQ and its derivatives as previously defined in the theoretical description of the engineering approach to perceived quality.
2.2. Perceived quality as a part of product quality models
In engineering science the notion of perceived quality, similar to this research, appeared as a part of bigger models; i.e. in the field of Robust Design (Taguchi, Chowdhury, and Wu Citation2005) and particularly in the area of Geometrically Robust Design (Söderberg and Lindkvist Citation1999). These research methodologies were among the first to consider perceived quality as an aftereffect of manufacturing processes (Wickman and Söderberg Citation2007; Wagersten et al. Citation2011). Robust Design is widely recognised as a consistent methodology for obtaining a high level of product quality. Consequently, a Geometrically Robust Design has been defined by Söderberg and Lindkvist (Citation1999), as ‘a design that fulfills its functional requirements and meets its constraints even when geometry is afflicted with small manufacturing or operational variation.’ Concerning early design phases (usually described as a ‘fuzzy front end’), product requirements have a tendency towards ambiguity, with follow up difficulties in their quantification. This problem is a central issue for the automotive industry regarding the definition of perceived quality attributes. For this reason, it is important to set robust target requirements to avoid quality loss induced by variation. To address these issues, Pedersen, Christensen, and Howard (Citation2016) proposed the Robust Design Requirements Specification (RDRS) approach for quantification of the early stage requirements, and also developed the Perceptual Approach to Robust Design (Pedersen Citation2017). Howard et al. (Citation2017) introduced a Variation Management Framework (VMF), linking variation during production with its impact on product and customer perception regarding quality loss. For the most part, Robust Design recognises the need to control perceived quality, as geometrical variation can significantly influence the visual and tactile perception of the product. Although we see Geometrically Robust Design as the bedrock of PQF, it focuses mainly on the visual part of perceived quality (e.g. split-lines).
Another approach, widely recognised in the literature as Affective or Emotional Engineering, sees perceived quality as an affective impact of a product on the customer. This emotional impact is consequently analysed as a result of the composition of the various product attributes (Schütte Citation2002). Examples of methodologies that aim to measure the impact of affect caused by the product on the customer are Kansei Engineering, Positive Design, and Pleasure-based approaches in product design. Kansei Engineering (Nagamachi Citation1995) is a form of emotional engineering that translates the customers’ feelings about a new product into the design specifications. There are four primary points that need to be taken into consideration when applying Kansei methodology: (1) understanding the customer’s emotions regarding the product in terms of psychological estimation; (2) identification of design characteristics for the product; (3) establishing the connections between customers’ feelings and design characteristics in order to maximise customer satisfaction, and (4) product design adjustments to the current trends. However, Kansei methodology implementation is quite challenging in practice. It is limited to the analysis of words (usually adjectives) and their emotional representation of a customer’s perception. The difficulties in extracting and transforming customer emotions into technical specifications often lead to weak results; e.g. the technical and functional complexity of a car and its components usually exceeds the knowledge, imagination and verbal apparatus of an average customer. Moreover, engineers are usually poorly trained in the data analysis used in Kansei Engineering; there is a lack of support systems and guidelines (Nordgren and Aoyama Citation2007). In addition, a typical Kansei study is quite a time-consuming process (even if the experienced design team performs it), and this fact often plays a negative role due to a continuously shrinking time for the product development processes.
Desmet and Pohlmeyer (Citation2013) introduced the Framework for Positive Design, which comprises three major pillars: design for virtue, design for pleasure, and design for personal significance. Positive Design is a customer-centric approach and focuses on a deep understanding of the customer’s context, lifestyle, values, and goals related to the design process. However, this particular framework needs to be elaborated further towards the development of practical methods and tools for product development, especially at its early stages. Jordan (Citation2002) proposed linking product benefits or ‘pleasures’ to product attributes, moving human factors in design beyond the usability-based approaches. Jordan adopted a framework for addressing pleasure issues – ‘The four pleasures: a framework for considering pleasure with products.’ This framework defines four types of pleasures: (i) Physio-pleasure (ii) Socio-pleasure (iii) Psycho-pleasure, and (iv) Ideo-pleasure. However, the challenge to ‘fit’ the product correctly to the customer needs remains open. Therefore, with the plethora of available methodologies for the translation of ‘pleasures’ into design decisions, fitting can be applied only in the specific personal or usability context. Jordan divides these methods into empirical and non-empirical, describing advantages and limitations for each method. In essence, this new approach to human factors in design gives a broad overview of the existing methodologies. However, if applied in practice, exceptional skills and knowledge of the qualitative and quantitative approaches are required from the design team, which in turn is rarely the case. Zöller and Wartzack (Citation2017) proposed a methodology (ACADE) that integrates interdisciplinary knowledge into the product development process by addressing the subjective needs of a customer. ACADE was designed as a system to support subjective quality creation based on customers’ attitudes. The system’s workflow consists of three major phases: product context, user context, and processing. The subsequent data analysis includes numerical methods, such as multivariate statistical analysis, fuzzy set theory, and artificial neural network processing and analysis. At this point, the applied data analysis techniques are similar to those used in Kansei Engineering. However, the authors admit that only visual sensory perception factors have been considered to date and the possibility of the particular methodology application for assessment of other sensory systems is a question for future research.
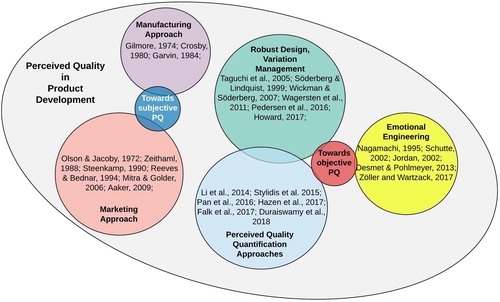
Generally speaking there are few major flows in product development related to perceived quality (see Figure ): the ‘old school’ manufacturing approach – not taking account of perceived quality; the ‘marketing’ approach – broadly customer-centric; the Emotional (Affective) engineering – subjective notion of perceived quality; the Robust Design and Geometrically Robust Design – although the engineering approach was introduced, it focuses mainly on visual quality. Alas, the comprehensive engineering approach, with a focus on perceived quality as a vantage point for new product development, together with questions regarding the importance of quantification, perceived quality attributes design impact on the customer – have not been widely covered in the literature, leaving a significant knowledge gap in applied and theoretical engineering science.
Figure 1. Perspectives on product and perceived quality.
2.3. Towards quantification of perceived quality
The quantification and inquiry of the ability to measure perceived quality or its elements have recently become a prominent theme in research. Hazen et al. (Citation2017) presented a methodology for evaluation of the perceived quality of remanufactured products (PQRP), admitting that no attempts to measure the perceived quality of remanufactured products were made in the past. Li, Liu, and Li (Citation2014), proposed a method for customer satisfaction evaluation using Entropy weight and Analytic Hierarchy Process (Saaty Citation1990). This methodology combines the Kano model with the Entropy weight determination for product evaluation criteria, which in turn is assigned with the use of AHP. Thus, the industry professionals’ knowledge utilisation, combined with the use of statistical methods, forms a new path in perceived quality quantification methodology. Wiesner and Vajna (Citation2018) argue for low measurability of industrial design in the context of new product development, bridging the cognitive gaps between designers and users regarding the perception of wearable devices. Furthermore, several methods have been proposed for the evaluation of single attributes. Duraiswamy et al. (Citation2018) developed a methodology for robust evaluation of the perceived quality of vehicle body panel gaps or split lines. Pan et al. (Citation2016) presented a quantitative model for prediction of visual attraction design regions related to automotive styling, where customer’s response to product design was modelled with the use of a deep convolutional neural network and crowdsourced Markov chain. Overall, the research mentioned above shapes the current trend towards the quantification of perceived quality and development of the new approaches regarding the evaluation of entities that previously have been seen as highly subjective and non-measurable.
2.4. Perceived quality approach in the automotive industry
In the car industry, during the cycles of product development, the desired performance of the vehicle is handled by various product attributes, such as fuel consumption, passive and active safety, noise, vibration and harshness (NVH), durability, and weight. The perceived quality is usually one of these product attributes. Consequently, a typical automotive OEM uses around 20–120 perceived quality attributes, depending on organisational structure. The perceived quality attributes are responsible for the definition of requirements and requirement levels that determine the perceived quality of the product. In the car industry, these attributes can be associated with the complete vehicle requirements, but also the component and system-level requirements. Quite often, the perceived quality attributes are also responsible for complete vehicle verification with the use of computer-aided engineering, as well as physical testing. Notably, TPQ, as it is defined in this paper, is not usually administered in the industry as a single global product attribute but rather as distributed among many attributes, such as visibility, drivability, ergonomics, craftsmanship, etc. However, alone or in combination, thoroughly or with limitations, these global attributes can be described in terms of a common framework. Therefore, throughout this research paper, we consider TPQ as a global product attribute.
With this in mind, it is important to stress that despite the accumulated experience, long-term goals and working culture, advanced methods for quality control – the perceived quality evaluation often remaining ‘hit or miss’ action. Therefore, industry requires not only theoretical descriptions and delineation of perceived quality attributes but a ‘toolbox’ of assessment methods (preferably not a time-consuming and easy to understand).
2.5. Summary
The multifaceted nature of perceived quality recognised in research as well as in industrial practice. It has been addressed in different disciplines with a plethora of views and approaches. In this research, we identified major exploration pathlines in the area of perceived quality: (i) manufacturing-based; (ii) marketing-based (iii) emotional engineering; (iv) robust design and its derivatives; (v) industrial practice. Analysis of the vast literature leads to the development of the perceived quality attributes framework (PQF) and taxonomy of perceived quality attributes. Subsequently, the absence of the comprehensive methodology regarding perceived quality evaluation, primarily inspired by the current industrial needs, shaped the new method (PQAIR) for perceived quality attributes relative importance ranking (see Section 4). The newly developed method is aiming towards understanding how the engineering design intent decisions will impact on customer satisfaction, and consequently can be used to produce products with the high perceived quality. After all, the engineering-based concept of perceived quality has been introduced.
3. Development of the Perceived Quality Framework
The primary objective of the approach described below was to determine ground perceived quality attributes and create a framework that will minimise the level of subjectivity in product design, develop taxonomy and terminology, generate a basis for meaningful discourse around the topic of perceived quality in engineering science.
3.1. Methodology
Eight European and two North American automotive OEMs were studied in terms of the decomposition of TPQ. All of the companies develop vehicles within different product types. All of the companies are global actors. The selected OEMs produce vehicles in the premium and luxury market segments. We applied design research in the form of an exploratory case study, including case design, data collection techniques, and approaches to data analysis (Yin Citation2013). With the aim to investigate the contemporary phenomenon of perceived quality in industry, information about perceived quality attributes was gathered through different channels. Semi-structured interviews with follow-up questions (Creswell and Clark Citation2007) served as the main source of information and were complimented with unstructured conversational interviews, together with informal conversations. The semi-structured interviews were performed with the OEM’s senior management personnel – key people from the companies who define development and the future look of their vehicles. We also studied the OEM’s internal documentation regarding perceived quality attributes structure, including presentations, descriptions of organisational structure, attributes structure descriptions, lists of functional and technical requirements, and working instructions. Several workshops were arranged, where employees from the three participating companies described the structures, processes and methods they use for understanding, defining, and assessing perceived quality. During workshops, framework and its structure were assessed, and we received feedback regarding form, meaning, and descriptions of perceived quality attributes. Few individuals who took part in workshops were previously subjects of semi-structured interviews. Examination of available internal documentation also contributed to verification of perceived attributes descriptions. Analysis of the received information allowed us to define 32 Ground Attributes and 9 Sensory Modalities comprising the PQF taxonomy.
3.1.1. Sampling
Our pool of interviewees comprised of 13 high-ranked professionals with a long track record in the automotive industry and experience in the global market. Their responsibilities include areas of PQ, supply quality, product marketing, complete vehicle requirements definition, environment, branding, and strategy management (see Table ).
Table 1. An overview of the interviewees for semi-structured interviews.
The main reason behind the interviewees’ selection was the intention to obtain a holistic view regarding perceived quality. We also performed unstructured conversational interviews with three senior engineers from the US premium automotive OEM and fifteen mid-level engineers from Swedish premium automotive OEMs (OEM 1, OEM 2 and OEM 3) who work within the attribute area of ‘Perceived quality.’ This work allowed a comprehensive understanding of TPQ as the Industry view it and documenting the current state of perceived quality attributes assessment working routines.
3.1.2. Data collection
Semi-structured interviews were completed in a place convenient for participants– (eleven face-to-face interviews at the OEMs’ premises and two phone interviews). During the semi-structured interviews, we asked the same questions of professionals from all companies involved in the study. The subsequent questions were focused on mapping perceived quality attributes. Sometimes we had to ask additional questions to explore topics widely and elicit perceived quality Ground Attributes as clearly as possible.
Briefly describing the protocol design, at the beginning of each interview, the questions were quite open and general, for example:
How would you define perceived quality?
What are the prerequisites for good perceived quality?
The subsequent questions narrowed the interest in mapping perceived quality attributes, for example:
What perceived quality attributes do you focus on when assessing materials quality?
What are perceived quality attributes that determine visual quality?
What perceived quality attributes do you focus on when assessing sound quality?
The complete list of questions can be found in Appendix 3. The mean semi-structured interview length was approximately 50 min. All semi-structured interviews were voice-recorded and transcribed verbatim. The unstructured interviews and informal conversations were also focused on knowledge distillation regarding Ground Attributes. Unstructured and conversational interviews had a mean time of 30 min and were performed as a follow-up procedure for perceived quality attributes elicitation. Following the initial data analysis, when categories and perceived quality attributes structure emerged, a series of workshops were organised with industry professionals to evaluate the relevance and accuracy of the perceived quality attributes structure and descriptions. Internal data from the OEMs, including customer clinics reports and internal attributes structures, were also carefully examined. The exploratory study was performed between November 2013 and October 2017.
3.1.3. Data analysis
To analyse the obtained data, we implemented Grounded Theory methodology (Corbin and Strauss Citation1990). The analysis commenced with open coding, where each of the interview transcripts was examined (Glaser Citation1992). The choice of methodology for data analysis was set to acquire knowledge regarding perceived quality and manufacturing processes. The type of knowledge that automotive OEMs are unlikely to share with the public. The text was coded and analysed with the help of qualitative data analysis software NVivo (QSR Citation2018). We used a bottom-up approach – i.e. reading the interview data and creating codes as they appeared. The coding procedure included two phases; (1) an initial phase of a coding strategy discussion, followed by (2) a focused phase of data analysis and synthesis of topic areas (nodes). The most significant problem was to synthesise the first-level nodes since the interview’s content included quite diversified topics. For example, the interviewees could touch the topics of company’s communication strategy regarding quality or core values declaration, manufacturing processes, design issues – all rooted in the background of the particular interviewee and the context of personal experience. The procedure included two intermediate coders’ workshops, where the coding strategies and preliminary results were discussed and evaluated. As a result, material for analysis was organised into the following nodes: (1) Communication strategies, i.e. a phenomenon derived from the interviews; (2) Competitors, i.e. self-assessment regarding the competitors – a phenomenon derived from the interviews; (3) Perceived Quality with the sub-node Perceived Quality attributes; (4) Product Development with the two sub-nodes Design & Engineering, and Manufacturing processes. During the data analysis we obtained new information regarding dimensions of perceived quality that was previously unavailable to us; collected rich data regarding internal processes in the OEMs, viewpoints on perceived quality, and lists of existing methods for perceived quality assessment. Altogether we revealed the need for more robust evaluation methodologies.
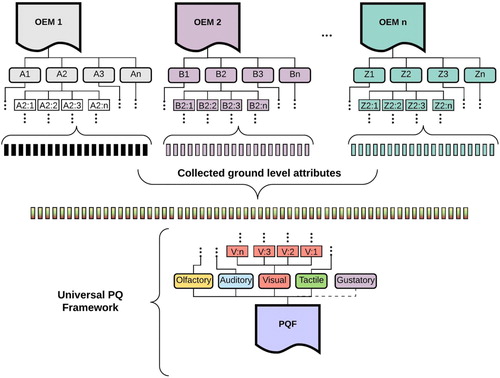
We were able to identify lists of perceived quality attributes from each OEM. All attribute structures, including Ground Attributes from the companies, have been documented. It must be mentioned again, that the majority of Ground Attributes can be delineated further into attribute characteristics (e.g. ‘Illumination Function’ into light tolerances, colour temperature, etc.); however, it becomes then more a matter of engineering specifications rather than elements that customers can perceive, understand and explain. Each ground attribute has been defined based on the data obtained during an exploratory study of the OEMs. During the PQF composition process (see Figure ), sometimes two or more of a company’s specific PQ attributes identified during the exploratory study have been merged into one or broken up into more Ground Attributes of PQF. Each attribute in the PQF has been described and supported with real examples. The attributes descriptions have been presented to the companies to verify that the data has been interpreted correctly. We organised several workshops with the industry professionals to evaluate PQF and Ground Attributes definitions, descriptions, and correct meaning. A complete list of all identified Sensory Modalities, Ground Attributes, and their meanings can be found in Appendix 1 and Appendix 2.
Figure 2. Procedure for the attributes complete list collection and PQF composition based on industry input.
3.1.4. Trustworthiness of data analysis
The rigour of data analysis was ensured through adherence to Grounded Theory methodology (Corbin and Strauss Citation1990). Four independent coders analysed the content of the semi-interviews to improve the internal validity of the work and minimise subjective discrepancy. Moreover, the process of data Unitizing (Krippendorff Citation2013) was conducted, in agreement with all coders, for the identification of content sections relevant to the purpose of this study, i.e. identification of perceived quality attributes.
3.2. Perceived Quality Framework (PQF) and Ground Attributes
The quality perception process is a physical and cognitive event, usually triggered by a physical signal received by our sensory apparatus. The information obtained through the human senses forms the basis of human experience. Thus, it is possible to communicate perceived quality-related technical elements in connection with the customer’s sensorial experience. The majority of perceived quality relationships (attributes) can be described by one of these sensory categories, or by several in combination. In essence, the PQF reflects human perceptual processing to delineate, test, and explore product designs. The perceived quality attributes within the framework are organised concerning primary human senses involved in their assessment; visual, tactile, auditory, olfactory, and gustatory (see Figure ). In our case, quality perception based on primary senses forms the first level of attributes; Visual Quality, Tactile Quality, Auditory Quality, Olfactory Quality, and Gustatory Quality.
Figure 3. Attributes levels of the PQF.
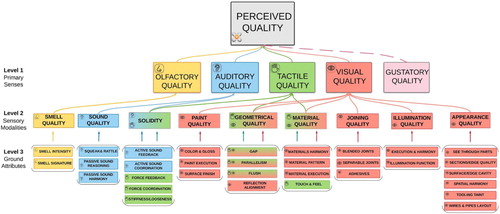
We acknowledge the fact that perception is not a fixed concept, as it is significantly modulated by many contextual factors such as multi-sensory information, past experiences, internal predictions, associations, ongoing product behaviour and internal or external spatial relations (Newell Citation2004), i.e. split-lines and overall design. Thus, we focus only on TPQ, disregarding any affective, perceptual issues related to VPQ. The second attributes level of PQF, based on industry knowledge input, is organised into Sensory Modalities. In our case, Sensory Modalities are the nine distinctive sets of product attributes encoded for presentation to humans. Each of these sets has a description (see Appendix 1) and includes a number of Ground Attributes. Our study revealed none of the attributes associated with gustatory perception or taste. For this reason, we were unable to form any modality linked to Gustatory Quality. However, gustatory-based perceived quality attributes can play an important role in the automotive industry, e.g. use of breath alcohol ignition interlock devices or alcolocks. These devices are likely to become a mandatory feature for new vehicles in the near future. The same can be applied to other types of products, such as wearables or while designing food products.
The Sensory Modalities (m = 9) and Ground Attributes (n = 32) are also colour-coded, depicting a human sensory system involved in their assessment (see Figure ). For example, if the ‘Gap’ can be evaluated not only by the visual sensory apparatus but also by haptic sensations, in the PQF this Ground Attribute depicted by the colour codes associated with ‘Tactile Quality’ and Visual Quality.’ The base (ground) level of attributes is the ‘lowest point’ where the engineers can still communicate technical details to the customers and receive meaningful feedback. To avoid ambiguity, every Ground Attribute has to be coherent to a customer’s experience so that the PQF can stand as a meaningful and accessible frame of reference for both the engineer and customer. Eventually, a customer must be able to understand the meaning of each Ground Attribute and at the same time be able to rank and prioritise its importance among other Ground Attributes. Such customer feedback is a key for the optimal perceived quality equation-balancing activity within the OEM.
The PQF is not limited to its status as a descriptive framework. The framework can be used widely to explore and test product designs with regard to perceived quality at all product development stages with the implementation of the PQAIR method described in Section 4.
4. Perceived Quality Attributes Importance Ranking (PQAIR) method
The Perceived Quality Attributes Importance Ranking (PQAIR) method was created to assist the engineer or designer in the decision-making process regarding the evaluation of a relative importance of perceived quality attributes for the final product. The PQAIR method intentionally combines the objective, measurable information of perceived quality with the subjective customer’s evaluation of product quality.
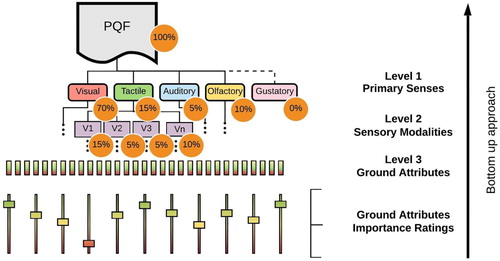
The core of the new method for perceived quality attributes evaluation is that all identified Ground Attributes are ranked with regard to their importance (see Figure ). The ranking can be obtained by utilising knowledge within the company (e.g. expert’s opinion) and/or analysing customer data (e.g. surveys, customers’ clinics, interviews, internal customer feedback systems, and large data sets). These rankings, applied to the PQF order, contribute to the importance score for each branch of the structure at all levels.
Figure 4. Each identified Ground Attribute is mapped into the PQF, and importance ratings can be calculated per attribute at every level.
The PQAIR method analysis procedure (see Figure ) begins with the initial stage – target definition for the desired level of perceived quality. Usually, the design intent includes identification of the critical perceived quality attributes for the complete product or just for the specific product’s area.
Figure 5. PQAIR method analysis procedure.
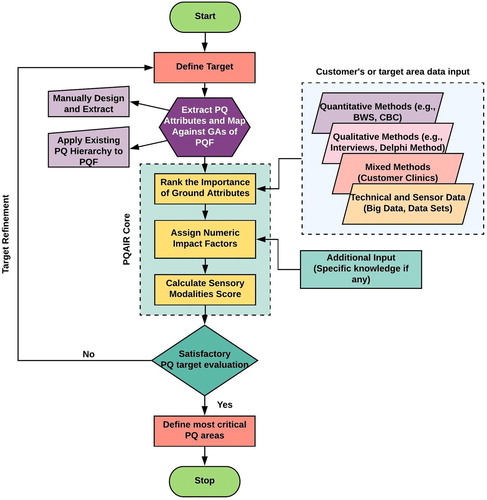
Consequently, before the PQAIR method application, each OEM has to map their product attributes to PQF. If the OEM already have internal product attribute structure, the existing perceived quality attributes have to be associated with the relevant Ground Attributes of PQF. Alternatively, the OEM can elicit perceived quality attributes of a product in coherence with the PQF principles. After that, the application of the PQAIR method will result in the obtaining of an importance score (ranking) for each attribute, considering the PQF as a reference model for perceived quality assessment. For example, initial ranking of Ground Attributes can be performed by the design of discrete-choice experiments and utilisation of a quantitative survey technique called Best-Worst Scaling (BWS) (Louviere Citation1993) The BWS is not the only methodology which can be employed to rank Ground Attributes; e.g. choice-based conjoint (CBC) is another popular discrete choice experiment method for acquiring information on customer preferences for individual product attributes (Louviere and Islam Citation2008; Sawtooth Software, Inc. Citation2008). We suggest that the strategy for the choice of methodology regarding obtaining rankings of Ground Attributes should be based on the current company needs and available resources. For example, in the case of luxury automotive manufactures the data obtained from the relatively small group of the car experts or car distributors (e.g. Delphi study), as an additional input, can be more informative comparing to the data obtained from the surveys (Stylidis et al. Citation2016).
The importance of each level attribute must be calculated based on the ranking of all Ground Attributes. As long as, all (1, … , k) Ground Attributes are ranked according to their importance, the impact factors are assigned at variance to the ranking of each Ground Attribute. The most important Ground Attribute assigned with the highest impact factor, R. Hence, the relation between all impact factors is linear. However, single Ground Attribute can have an impact on several Level 1 attributes (e.g. one Ground Attribute can effect Visual and Tactile Quality at the same time), therefore the number of occurrences, o, must be specified, since the total impact from that specific Ground Attribute shall be distributed in different modalities with the impact of R/o. Equal distribution of importance between modalities is assumed as a starting point. However, any distribution of the impact of a single Ground Attribute on different modalities can be applied. The following definitions are set:
R:Impact factor based on ranking position (k, … , 1)
o:Number of multiple occurrences for a single Ground Attribute
m:Number of sub-attributes on the level above Ground Attributes (Sensory Modalities level)
n:Number of Ground Attributes on the lowest sub-attribute level
Ssum:Summary of impact score for all sub-attributes on the lowest level.
When the importance of each attribute on the lowest level is known, it is then possible to calculate the importance score for the next attributes’ levels by summarising all Srel for each lower-level attribute. On the top level for complete perceived quality, the impact score will sum up to 100%. The modalities and Ground Attributes with the highest score indicate product areas where engineers have to focus in order to achieve the desired level of perceived quality. Overall, the process can be ‘single-stage’ or iterative until the OEM is satisfied with the outcomes.
5. Empirical structural validity test of PQAIR method (pilot experiment)
To assess the usability and rigour of the new ranking method, we designed and performed a pilot experiment. The PQAIR method, as a part of engineering design, concerned with the open problem of the perceived quality evaluation that involves objective and subjective elements. Therefore, according to the Pedersen’s Validation Square for design methodologies framework (Pedersen et al. Citation2000), the pilot experiment can be described as a test for Empirical Structural Validity. The PQF and PQAIR methods have been evaluated at the Perceived Quality Workshop during the Design Conference 2018, Dubrovnik, Croatia. The participants were given the task to rank the importance of the presented Ground Attributes. Our main intent was to test the method and the ability of participants to comprehend information about perceived quality attributes as initially designed.
5.1. Pilot survey design and procedure
To test the PQAIR method, we have conducted the following experimental study:
We asked the audience if there are any industry representatives present and received definite answers. These individuals subsequently were asked to join the ‘Designers’ team. The team consisted of five individuals and supposed to act as a single voice (N = 1); therefore, they had to find an agreement regarding given tasks. Subsequently, with the feedback forms analysis, it was revealed that ‘Designers’ team consisted of representatives from automotive companies such as Volvo Car Group, Daimler AG, BMW AG, and McLaren Automotive.
The rest of the participants (N = 21) were included in the ‘Customers’ group.
Both groups were asked to rank all presented Ground Attributes (n = 20) sequentially, to evaluate their importance regarding a ‘generic SUV vehicle’ intended for the EU premium market segment.
Consecutively we were able to provide live results of the online survey and show the differences in understanding perceived quality by the automotive industry professionals and the general public.
We collected feedback forms that allowed us to analyse the outcomes of the experiment and the feasibility of the PQAIR method.
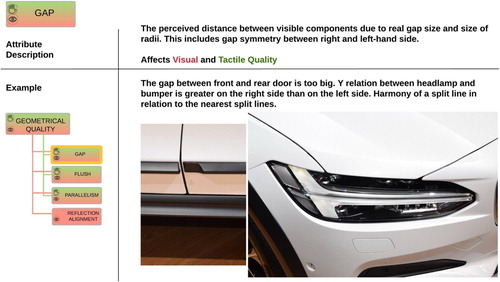
Before the survey, respondents were introduced to the descriptions of PQF Sensory Modalities and Ground Attributes (see Appendix 1 and 2). To measure respondents’ subjective preference regarding presented Ground Attributes, the Best-Worst Scaling elicitation method was used. The visual references (see Figure ) of the Ground Attributes were distributed among the participants in the form of print media to ensure correct interpretation of each attribute. The same set of still images was displayed in digital format during web-based Best-Worst Scaling exercise. During the experiment, four attributes (still image and description) were displayed per set with the total number of fifteen sets. There is to mention, in Best-Worst Scaling study, we used subset (n = 20) of Ground Attributes (n = 32) included in PQF. This was grounded based on exercise completing time. Our previous tests indicated that average exercise duration for the Ground Attributes complete set meaningful assessment may have a range from 40 to 60 min. A smaller number of Ground Attributes allowed us to ensure that exercise completing time will not exceed 40 min (the total workshop duration was limited by three hours). Survey design and results were subjected to data analysis using Discover Survey Software (Sawtooth Citation2018).
Figure 6. Descriptive and visual guidance regarding one Ground Attributes (‘Gap’).
The Best-Worst Scaling method was implemented since its main purpose is to aggregate and estimate rank-order information when there are too many attributes for a typical rank-order survey task. According to Marley and Louviere (Citation2005), best-worst tasks positively effect the consistency of the responses and can be easily understood by respondents.
5.2. Outcomes of the pilot experiment
In each task, the participants were asked to select the ‘most important’ and ‘least important’ attributes from subsets of Ground Attributes.
The choice tasks were presented to the respondents with different permutations of the attributes listed in Appendix 2, and the number of choice tasks in each series was adjusted to the number of attributes. The results of the BWS rank-order exercise for the team ‘Designers’ are shown in Table ; result for the team ‘Customers’ outlined in Table .
Table 2. The Ground Attributes importance ratings obtained from the team ‘Designers’ during the pilot study.
Table 3. The Ground Attributes importance ratings obtained from the team ‘Customers’ during the pilot study.
A linear impact factor has been assigned to each Ground Attribute, where the most important has k (i.e. R = 32) as its impact factor and the least important has 1 (i.e. R = 1) as its impact factor.
With the application of the proposed importance ranking method, this resulted in the attributes importance ranking score presented in Figure .
Figure 7. Perceived quality attributes importance ranking values for relevant PQF areas regarding a ‘generic’ SUV intended for the EU premium market segment for both teams.
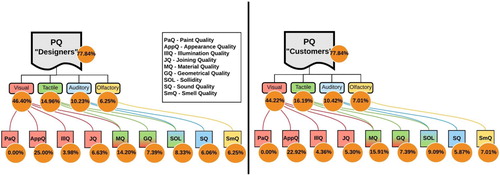
Despite the ‘illustrative’ nature of this experiment, its outcomes are quite interesting since it is modelled the real-life situation. Firstly, the meaning of Ground Attributes and PQF as a sensory attribute-centered framework were quite well understood not only by the automotive industry experts but by the general public as well. The analysis of the post-experiment specific competence measures in the feedback forms indicated an acceptable level of the Ground Attributes descriptions (Appendix 2). At the same time, the drawbacks of the use of still images are that the context of the specific attribute often is not revealed, i.e. just one viewing angle and exploration of the attribute is possible. As a designer of a perceived quality assessment experiment, one needs to be very careful and accurate to provide the ‘best’ picture for the specific Ground Attribute to ensure that the right thing is assessed. Secondly, the differences in the relative importance of Ground Attributes for ‘professionals’ and ‘customers’ were highlighted explicitly. The importance ratings obtained among Ground Attributes indicated great attention to the attributes such as ‘Squeak and Rattle,’ ‘Force Coordination’ and ‘Parallelism.’ At the same time, Ground Attributes such as ‘Smell Intensity’ and ‘Separable Joints’ were less important contributors to the overall perceived quality of the vehicle, according to the team ‘Designers.’ This means that in the real situation, to perform the initially required task ‘evaluate the company’s flagship SUV vehicle intended for the EU premium market segment,’ the focus of the engineering team responsible for perceived quality design would be on PQF modalities such as ‘Solidity’, ‘Appearance Quality’ and their derivatives, according to the internal OEM’s perceived quality attribute structure. However, if in the general lines this correlates with the preferences of the ‘Customers’ team, at the level of Ground Attributes the differences can be significant. A discussion which followed the exercise was quite intense, indicating the interest of the public to the topic of perceived quality. To sum up, the pilot experiment examined the feasibility and acceptability of the PQAIR method, indicating critical areas in the way of displaying Ground Attributes to the customers. At the same time, PQIAR method demonstrated the capability for use in the evaluation of product designs regarding perceived quality.
6. Discussion
In this section, we discuss a several important questions regarding applicability and implementation of PQF and PQAIR method.
6.1. Taxonomy and definition of perceived quality attributes
The PQF presents an engineering viewpoint on quality perception, where perceived quality is seen as one of the working product attributes; an attribute that includes a wide spectrum of expertise areas. Definitions of Ground Attributes in our case are based on data we received from the automotive OEMs, and these attributes could be defined differently. During the study, we have identified that many ‘low level’ attributes can significantly vary from one OEM to another. Some companies can effectively operate perceived quality with less than a dozen attributes, while others use more than a hundred. In the composition of the PQF, we defined Ground Attributes to serve as a ‘filter’ or ‘sway’ to perceived quality communication in product development. Therefore, the PQF contains a significant amount of Ground Attributes to manage perceived quality requirements for a wide range of products. The only condition is that the same attribute structure for one set of Ground Attributes is used for both benchmarking and evaluation during the product development phase. The notion of perceived quality in this context can be seen as an integrated process of engineering endeavour with regard to product attributes that communicate quality to the customer. The scope of Ground Attributes is to ensure the correct meaning, authenticity, and execution of the final product. Moreover, the definition of perceived quality from the engineering perspective contributes to the multi-disciplinary integration of the quality-related issues. The TPQ and VPQ definitions can bridge manufacturing operations with ‘hard’- defined conformance to design specifications and marketing-oriented approaches with the customer’s perception of quality in focus. Consequently, the PQF attributes taxonomy can fill the void of conceptual ambiguity about the perceived quality that obviously exists today.
6.2. Assessment of the PQAIR method for use in product development
The PQAIR method illuminates the interplay between technical characteristics of the product and customer perceptions. The successful implementation of the method can help find an answer to the question, ‘Which perceived quality attributes do engineers have to focus on to receive the highest level of a customer’s appreciation?’ This is, after all, a very ‘expensive’ question. Billion-dollar decisions in the automotive industry often rely on predictions and assumptions about how a customer will perceive and evaluate such a complex product as a car. The successful implementation of PQF and its principles shifts the perceived quality evaluation processes towards the objective and reproducible side. Ranking of the relative importance of Ground Attributes produces indices where the respondents’ choice estimations allow metric comparisons of perceived quality attributes. This helps to translate the subjective opinions of individuals into quantifiable measures and to avoid subjectivity in the assessment of perceived quality. The pilot experiment (see Section 5) demonstrated that the PQAIR method produced results and that there is a possibility for the method to be used in practice. However, several key points have to be addressed.
6.2.1. Impact factors and perceived quality attributes importance rankings
Many of the Ground Attributes and Sensory Modalities are multisensory in terms of their assessment by the customer. This fact raises the immediate question, ‘Which Sensory Modalities effect the customer the most and to what extent?’ Following the course of this article, the answer is expected to be given by the numbers. We have used a linear model to assign numeric impact factors for all Ground Attributes, but other approaches can be adopted. The research on sensory dominance and methods for capturing/eliciting sensory experience is represented mainly by the field of experimental psychology (Fenko, Schifferstein, and Hekkert Citation2010; Carbon Citation2015). This research also considers the relation of time and product appreciation regarding sensory dominance and product familiarisation issues. We believe such methods have to be adopted in the future development of the PQAIR method to increase the accuracy of results. Another promising approach could be a controllable creation of a product’s meaning by design, involving semiosis – the semiotic term of meaning making (Waltersdorfer, Gericke, and Blessing Citation2015). Moreover, perception of a product’s meaning occurs before or concurrently with the perception of the product as an object. We see a product’s intended meaning as fast or faster than we see what it is (Peterson Citation2018). In the same way, the Kano model (Kano et al. Citation1984) can be used to define a two-dimensional map for basic, linear, and exponential customer values regarding each Ground Attribute. The numerical impact factors could then be assigned based on the coordinates of the Ground Attributes. Secondly, additional aspects regarding perception of the Ground Attributes by the customer could be included in the overall importance score. For example, the position of a Ground Attribute for the product and its visibility to the evaluator could be implicitly included in the ranking (i.e. Ground Attributes that are not so visible, or generally hard to discover for an inexperienced customer, are likely to be ranked as less important). However, this assumption has to be confirmed with a larger customer study. Finally, ‘Why is it important to calculate importance score per sub-attribute on each level when you simply can prioritise the Ground Attributes that is highest in the ranking?’ is a question that has to be answered. In this case, sub-attributes, or modalities and Ground Attributes usually have a corresponding unit within the OEM organisational structure. This means that the overall balancing of resources can be conducted based on importance score per sub-attribute.
6.2.2. Important observations and feedback on the pilot experiment
While performing tasks regarding the importance ranking of Ground Attributes, some respondents experienced difficulties finding good reference points for their judgments. They were provided with the descriptions of Sensory Modalities and Ground Attributes, but without visual, exact and detailed references for ‘bad’ or ‘good’ examples of Ground Attributes execution it was nevertheless difficult even for the industry professionals to make decisions and rank the importance of given attributes. This means that future study designs, when displayed to respondents, have to be visually explicit and supported with precisely described examples of Ground Attributes. These descriptions and representations are the subjects of current and future research. Analysis of PQAIR method outcomes during the pilot experiment demonstrated an apparent bias regarding the perceived quality attributes importance ranking by industry experts. Industry professionals tend to overestimate the importance of the attributes they are currently working on. At the same time, they may rank low the attributes where OEM is performing relatively well (according to the internal benchmarking). For example, premium market segment automobile usually has a high level of materials quality across all competing OEMs (e.g. uniformity of ‘Material Pattern’). Therefore, it has a low level of importance for professionals. While ‘squeak and rattle’ issue is usually ranked high because currently, it can be a differentiator in the premium car market segment. This must be taking into consideration with the analysis of the studies involving professionals and customers.
6.2.3. PQ assessment process loop and the importance of customer feedback
When discussing the pilot experiment presented in Section 5, we have to admit that rankings obtained from the professionals can indicate the engineering design viewpoint but cannot provide a holistic picture regarding the importance of Ground Attributes for the customer. However, the received knowledge can be used to compare professionals’ vision with rankings based on customer data for internal evaluation within OEM. Therefore, the customer’s data acquisition is the key to a successful implementation of PQF and the ranking method for industrial use (see Figure ).
Figure 8. Perceived quality assessment process loop for successful engineering design intent implementation with customer feedback.
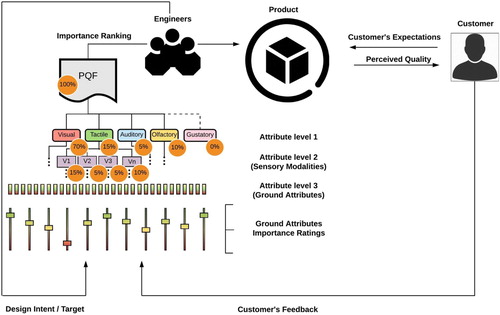
As mentioned previously, this process is not easy since the customers might not be familiar with the terminology and technical details of the product. However, only the customer’s opinion can help to make correct estimations regarding the importance of perceived quality attributes.
6.3. Generalisation of the PQF and PQAIR method for use in various product development domains
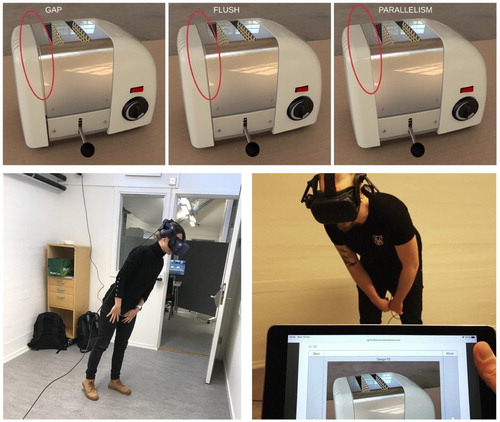
The cornerstone of the PQF is the ability to list desired perceived quality attributes related to the product of interest, and understand which attributes can be included in the notion of TPQ. The origin of PQF from the automotive industry allows handling products with the highest level of complexity. If required, the in-depth studies of the specific product towards the decomposition of its elements can naturally augment Sensory Modalities and Ground Attributes. The scalability of the PQF allows using the framework for targeting only specific perceived quality attributes that require assessment. For example, a plethora of household appliances use a harmonious relation of visible components (concurrently linked to the manufacturing processes) to differentiate in the market competition. A subset of these product attributes can be mapped to the Sensory Modality ‘Geometry Quality’ and its Ground Attributes. Therefore, the PQAIR method can be applied to the isolated Sensory Modality in order to correctly define requirements for the specific product attributes and achieve a high level of perceived quality. Recently we performed a study (Stylidis et al. Citation2019) with the ‘simple’ consumer product – a bread toaster. The three Ground Attributes were chosen for the evaluation of importance: Gap, Flush, and Parallelism. These Ground Attributes are primarily forming a spatial relationship (split-line) between the mating parts in an assembled product, and create visual cues that allow the customer to detect manufacturing variation. One of the study objectives was to understand ‘Which Ground Attributes are most influential regarding the perceived quality of a product?’ To ease the communication process between designers and customers in the products’ perceived quality assessment loop, the interactive experience in the simulated environments can be implemented almost immediately. When considering the inclusion of a variety of methods to enrich PQAIR method, it is possible to use immersive and semi-immersive technologies such as Virtual or Augmented Reality (see Figure ).
Figure 9. Fully immersive head-mounted display system exercise for evaluation of a bread toaster split-lines.
Understanding the level of manufacturing variation acceptability by the customer can not only improve product design but also decrease production time and cost. This suggests that OEMs can improve the perceived quality of their products by adopting the PQF and using the PQAIR method (e.g. assessment of kitchen furniture PQ, evaluation of portable devices, consumer products, remanufactured products).
6.4. Obtaining better data from customers
An important source of information is the customers’ data collection. In the case of the automotive industry, surveys are usually conducted by third-party companies, such as J.D. Power, ADAC or internal surveys/customer clinics that each OEM performs after a particular time of product use. One significant issue regarding customer surveys analysis is that it is hard to extract information about a single Ground Attribute explicitly. This is very critical for perceived quality evaluation, not only in the automotive industry but also in other product domains. In J.D. Power’s surveys, most questions that relate to perceived quality could also refer to product design (e.g. styling), ‘What is the appearance of the instrument panel?’ Of course, the perceived quality will have a considerable impact on the appearance of the instrument panel, but it is impossible to distinguish between perceived quality and product design in this case. Another example is the question in the ‘reason to buy’ part of the J.D. Power surveys (i.e. the customer is asked to pick several reasons for purchasing a particular car.) One of the possible options is ‘good workmanship,’ the meaning of which is equivalent to the ‘good’ perceived quality. Now the problem is that it is not possible to distinguish what sub-attributes of perceived quality are important.
The correct set up of a ranking study also essential. In our pilot experiment to acquire ordinal preferences without overloading respondents with overly challenging tasks, we implemented the Best-Worst Scaling method. One limitation of this method is that it can only provide ordinal information, for example, that one attribute is more important than another, without providing any absolute information, for instance, regarding whether of those attributes are even significant influencers in the decision-making process (Orme Citation2005). To overcome this issue, the Best-Worst Scaling tasks can be combined with a small number of semantic-differential tasks that ask for the perceived importance level of specific attributes or even modalities, ranging from not at all important to the highest priority of importance. Additionally, the impact factor of a single Ground Attribute can be manually assigned by the experts who have access to the relevant information about the importance of this attribute to the specific product design.
6.5. Limitations
There are a number of limitations in this work. Firstly, this paper focuses on the attribute Technical Perceived Quality (Stylidis, Wickman, and Söderberg Citation2015) and only includes a pilot experiment of automotive designs; however, the method can be applied to other product attributes with direct customer impact. The new method is used to understand how design decisions will impact customer satisfaction and consequently, optimal balancing of perceived quality attributes. Secondly, the pilot experiment involved a relatively small number of participants to be considered statistically rigorous. This fact means we were unable to remove possible bias and subjectivity from the procedure of perceived quality attributes ranking. However, we believe this was an absolutely necessary step before we implement PQAIR method as it is intended for the use with the customers at the full scale.
6.6. Future work
Future research suggests a design of exploratory studies, including other automotive OEMs within different market segments. Further research is also warranted to validate the findings of the pilot experiment using large customer response samples. Implementation of the PQAIR method regarding other products (e.g. in furniture design, consumer products) also has great importance and potential for establishing robust industrial practices for perceived quality evaluation. Enhancing the PQAIR method with new immersive technologies combined and linked with CAD/CAM systems can embed PQF into existing product architectures, providing immense opportunities for the future research of perceived quality.
7. Conclusions
In this work, we have investigated the possibility to measure the relative importance of a single perceived quality attribute or a group of attributes to the customer. Specifically, we studied ten automotive OEMs, defined perceived quality from the engineering viewpoint, introduced a taxonomy of the perceived quality attributes, and proposed the PQAIR method, based on data input from professionals and customers. Moreover, we performed a pilot experiment to rank the importance of perceived quality attributes with specific design task. Although there is still room for improvement in the proposed method and PQF architecture, our results indicate that the PQAIR method can potentially provide the long-awaited answer to the question, ‘Which perceived quality attributes are most required for successful product design?’
CJEN-2019-0002-File016.docx
Download MS Word (14.2 KB)CJEN-2019-0002-File015.docx
Download MS Word (16.1 KB)CJEN-2019-0002-File014.docx
Download MS Word (13.4 KB)Acknowledgment
This work was supported by the Swedish Governmental Agency for Innovation Systems (VINNOVA). That support is gratefully acknowledged.
Disclosure statement
No potential conflict of interest was reported by the authors.
ORCID
Kostas Stylidis http://orcid.org/0000-0002-2111-8089
Casper Wickman http://orcid.org/0000-0003-1111-3601
Rikard Söderberg http://orcid.org/0000-0002-9138-4075
Additional information
Funding
Related Research Data
References
- Aaker, David A. 2009. Managing Brand Equity. New York, NY: Simon and Schuster.
- Carbon, Claus-Christian. 2015. “Predicting Preferences for Innovative Design: The “Repeated Evaluation Technique”(RET).” GfK Marketing Intelligence Review 7 (2): 34–39. doi: 10.1515/gfkmir-2015-0016
- Corbin, Juliet M, and Anselm Strauss. 1990. “Grounded Theory Research: Procedures, Canons, and Evaluative Criteria.” Qualitative Sociology 13 (1): 3–21. doi: 10.1007/BF00988593
- Creswell, John W, and Vicki L. Plano Clark. 2007. Designing and Conducting Mixed Methods Research. Thousand Oaks, CA: Wiley Online Library.
- Crosby, Philip B. 1980. Quality Is Free: the Art of Making Quality Certain. New York: McGraw-hill.
- Desmet, Pieter MA, and Anna E. Pohlmeyer. 2013. “Positive Design: An Introduction to Design for Subjective Well-Being.” International Journal of Design 7 (3): 5–19.
- Duraiswamy, Vidya, Felician Campean, Steve Harris, and J. Eduardo Munive-Hernandez. 2018. “Development of a Methodology for Robust Evaluation of Perceived Quality of Vehicle Body Panel Gaps.” DS92: Proceedings of the DESIGN 2018 15th international design Conference, May 21–24.
- Falk, Björn, Konstantinos Stylidis, Casper Wickman, Rikard Söderberg, and Robert Schmitt. 2017. “Shifting Paradigm: Towards a Comprehensive Understanding of Quality.” DS 87-9 Proceedings of the 21st international Conference on engineering design (ICED 17) Vol 9: Design Education, Vancouver, Canada, August 21–25.
- Fenko, Anna, Hendrik NJ. Schifferstein, and Paul Hekkert. 2010. “Shifts in Sensory Dominance Between Various Stages of User–Product Interactions.” Applied Ergonomics 41 (1): 34–40. doi: 10.1016/j.apergo.2009.03.007
- Forslund, Karin, Mari Anne Karlsson, and Rikard Söderberg. 2013. “Impacts of Geometrical Manufacturing Quality on the Visual Product Experience.” International Journal of Design 7 (1): 69–84.
- Garvin, David A. 1984. “Product Quality: An Important Strategic Weapon.” Business Horizons 27 (3): 40–43. doi: 10.1016/0007-6813(84)90024-7
- Gilmore, Harold L. 1974. “Product Conformance Cost.” Quality Progress 7 (5): 16–19.
- Glaser, Barney G. 1992. Basics of Grounded Theory Analysis: Emergence vs Forcing. Mill Valley, CA: Sociology press.
- Golder, Peter N., Debanjan Mitra, and Christine Moorman. 2012. “What is Quality? An Integrative Framework of Processes and States.” Journal of Marketing 76 (4): 1–23. doi: 10.1509/jm.09.0416
- Hazen, Benjamin T., Christopher A. Boone, Yacan Wang, and Kuan Siew Khor. 2017. “Perceived Quality of Remanufactured Products: Construct and Measure Development.” Journal of Cleaner Production 142: 716–726. doi: 10.1016/j.jclepro.2016.05.099
- Hoffenson, Steven, Andreas Dagman, and Rikard Söderberg. 2015. “Visual Quality and Sustainability Considerations in Tolerance Optimization: A Market-Based Approach.” International Journal of Production Economics 168: 167–180. doi: 10.1016/j.ijpe.2015.06.023
- Howard, T. J., T. Eifler, S. N. Pedersen, S. M. Göhler, S. M. Boorla, and M. E. Christensen. 2017. “The Variation Management Framework (VMF): A Unifying Graphical Representation of Robust Design.” Quality Engineering 29 (4): 563–572. doi:10.1080/08982112.2016.1272121.
- Jordan, Patrick W. 2002. Designing Pleasurable Products: An Introduction to the new Human Factors. London: CRC press.
- Kano, Noriaki, Nobuhiko Seraku, Fumio Takahashi, and Shinichi Tsuji. 1984. “Attractive Quality and Must-Be Quality.” Journal of the Japanese Society for Quality Control 14 (2): 147–156.
- Krippendorff, K. 2013. Content Analysis: An Introduction to its Methodology. Thousand Oaks, CA: Sage.
- Li, Li, Fei Liu, and Congbo Li. 2014. “Customer Satisfaction Evaluation Method for Customized Product Development Using Entropy Weight and Analytic Hierarchy Process.” Computers & Industrial Engineering 77: 80–87. doi: 10.1016/j.cie.2014.09.009
- Liem, Andre, S. Abidin, and Anders Warell. 2009. “Designers’ Perceptions of Typical Characteristics of Form Treatment in Automobile Styling.” In 5th International Workshop on Design & Semantics of Form and Movement, DesForm.
- Louviere, Jordan J. 1993. “The Best-Worst or Maximum Difference Measurement Model: Applications to Behavioral Research in Marketing.” The American marketing association’s behavioral research Conference Phoenix, Arizona.
- Louviere, Jordan J., and Towhidul Islam. 2008. “A Comparison of Importance Weights and Willingness-to-pay Measures Derived From Choice-Based Conjoint, Constant Sum Scales and Best–Worst Scaling.” Journal of Business Research 61 (9): 903–911. doi: 10.1016/j.jbusres.2006.11.010
- Marley, Anthony AJ, and Jordan J Louviere. 2005. “Some Probabilistic Models of Best, Worst, and Best–Worst Choices.” Journal of Mathematical Psychology 49 (6): 464–480. doi: 10.1016/j.jmp.2005.05.003
- Mitra, Debanjan, and Peter N Golder. 2006. “How Does Objective Quality Affect Perceived Quality? Short-Term Effects, Long-Term Effects, and Asymmetries.” Marketing Science 25 (3): 230–247. doi: 10.1287/mksc.1050.0175
- Nagamachi, Mitsuo. 1995. “Kansei Engineering: A new Ergonomic Consumer-Oriented Technology for Product Development.” International Journal of Industrial Ergonomics 15 (1): 3–11. doi: 10.1016/0169-8141(94)00052-5
- Newell, Fiona N. 2004. “Cross-Modal Object Recognition.” In The Handbook of Multisensory Processes, edited by Gemma Calvert and Charles Spence, 123–139. Cambridge, MA: MIT Press.
- Nordgren, Andreas Kjell, and Hideki Aoyama. 2007. “Implicit Shape Parameterization for Kansei Design Methodology.” Journal of Advanced Mechanical Design, Systems, and Manufacturing 1 (4): 442–452. doi: 10.1299/jamdsm.1.442
- Olson, Jerry C., and Jacob Jacoby. 1972. “Cue Utilization in the Quality Perception Process.” ACR Special Volumes 167–179.
- Orme, B. 2005. “MaxDiff System Technical Paper.” Sawtooth Software Research Paper Series. http://www.sawtoothsoftware.com.
- Pan, Yanxin, Alex Burnap, Ye Liu, Honglak Lee, Richard Gonzalez, and Panos Papalambros. 2016. “A Quantitative Model for Identifying Regions of Design Visual Attraction and Application to Automobile Styling.” Proceedings of the 2016 international design Conference, May 16–19.
- Pedersen, Søren Nygaard. 2017. Perceptual Robust Design. Lyngby, Denmark: Technical University of Denmark (DTU).
- Pedersen, Søren Nygaard, Martin E. Christensen, and Thomas J Howard. 2016. “Robust Design Requirements Specification: a Quantitative Method for Requirements Development Using Quality Loss Functions.” Journal of Engineering Design 27 (8): 544–567. doi: 10.1080/09544828.2016.1183163
- Pedersen, Kjartan, Jan Emblemsvag, Reid Bailey, Janet K. Allen, and Farrokh Mistree. 2000. “Validating Design Methods and Research: the Validation Square.” ASME Design Engineering Technical Conferences, September 10–14, page 1–12.
- Peterson, Jordan B. 2018. 12 Rules for Life: An Antidote to Chaos. Toronto: Random House Canada.
- QSR Nvivo [Computer program]. Accessed December 29, 2018. https://www.qsrinternational.com/nvivo/home.
- Reeves, Carol A, and David A. Bednar. 1994. “Defining Quality: Alternatives and Implications.” Academy of Management Review 19 (3): 419–445. doi: 10.5465/amr.1994.9412271805
- Saaty, Thomas L. 1990. “How to Make a Decision: The Analytic Hierarchy Process.” European Journal of Operational Research 48 (1): 9–26. doi: 10.1016/0377-2217(90)90057-I
- Sawtooth Software [Computer program]. Accessed December 14, 2018. https://www.sawtoothsoftware.com.
- Sawtooth Software, Inc. 2008. The CBC System for Choice-based Conjoint Analysis. Technical Report. Sawtooth Software, Sequim, WA, USA, June.
- Schütte, Simon. 2002. “Designing Feelings into Products: Integrating kansei Engineering Methodology in Product Development.” PhD diss., Institutionen för konstruktions-och produktionsteknik.
- Skou, Niels Peter, and Anders V. Munch. 2016. “New Nordic and Scandinavian Retro: Reassessment of Values and Aesthetics in Contemporary Nordic Design.” Journal of Aesthetics & Culture 8 (1): 1–12. doi: 10.3402/jac.v8.32573
- Smil, Vaclav. 2017. Energy: a Beginner's Guide. London: Oneworld Publications.
- Söderberg, Rikard, and Lars Lindkvist. 1999. “Computer Aided Assembly Robustness Evaluation.” Journal of Engineering Design 10 (2): 165–181. doi: 10.1080/095448299261371
- Steenkamp, Jan-Benedict EM. 1990. “Conceptual Model of the Quality Perception Process.” Journal of Business Research 21 (4): 309–333. doi: 10.1016/0148-2963(90)90019-A
- Stylidis, Konstantinos, Alexander Burnap, Monica Rossi, Casper Wickman, Rikard Söderberg, and Panos Y. Papalambros. 2016. “A Preliminary Study of Trends in Perceived Quality Design Attributes in the Automotive Luxury Market Segment.” DS 84: Proceedings of the DESIGN 2016 14th international design Conference, May 16–19 , page 2189–2196.
- Stylidis, Kostas, Andreas Dagman, Håkan Almius, Liang Gong, and Rikard Söderberg. 2019. “Perceived Quality Evaluation with the Use of Extended Reality.” In Proceedings of the Design Society: International Conference on Engineering Design, 1993–2002. Cambridge: Cambridge University Press.
- Stylidis, Konstantinos, Steven Hoffenson, Casper Wickman, Mikael Söderman, and Rikard Söderberg. 2014. “Corporate and Customer Understanding of Core Values Regarding Perceived Quality: Case Studies on Volvo Car Group and Volvo Group Truck Technology.” Procedia CIRP 21: 171–176. doi: 10.1016/j.procir.2014.03.144
- Stylidis, Konstantinos, Casper Wickman, and Rikard Söderberg. 2015. “Defining Perceived Quality in the Automotive Industry: An Engineering Approach.” Procedia CIRP 36: 165–170. doi: 10.1016/j.procir.2015.01.076
- Taguchi, Genichi, Subir Chowdhury, and Yuin Wu. 2005. Taguchi’s Quality Engineering Handbook. Hoboken, NJ: Wiley.
- Wagersten, Ola, Karin Forslund, Casper Wickman, and Rikard Söderberg. 2011. “A Framework for Non-Nominal Visualization and Perceived Quality Evaluation.” In ASME 2011 International Design Engineering Technical Conferences and Computers and Information in Engineering Conference, 739–748. Washington, DC: American Society of Mechanical Engineers.
- Waltersdorfer, Gregor, Kilian Gericke, and Lucienne Blessing. 2015. “Fostering Sustainable User Behaviour: Exploring Meaning and its Creation in Products and Services.” In The Value of Design Research, Proceedings of the 11th International Conference of the European Academy of Design, 1–14. Boulogne Billancourt, France: Sheffield Hallam University.
- Wickman, Casper, and Rikard Söderberg. 2007. “Perception of Gap and Flush in Virtual Environments.” Journal of Engineering Design 18 (2): 175–193. doi:10.1080/09544820600751023.
- Wiesner, Martin, and Sándor Vajna. 2018. “Conception of a Crowdsourcing Tool to Support Industrial Design Decisions.” DS92: Proceedings of the DESIGN 2018 15th International Design Conference, May 21–24.
- Yin, Robert K. 2013. Case Study Research: Design and Methods. London: Sage publications.
- Zeithaml, Valarie A. 1988. “Consumer Perceptions of Price, Quality, and Value: A Means-End Model and Synthesis of Evidence.” Journal of Marketing 52: 2–22. doi: 10.1177/002224298805200302
- Zöller, Susan Gretchen, and Sandro Wartzack. 2017. “Considering Users’ Emotions in Product Development Processes and the Need to Design for Attitudes.” In Emotional Engineering, Vol. 5, 69–97. Cham: Springer.
Appendix 3. Interview guide
The purpose of this interview is to identify with what perceived quality attributes professionals of selected companies are working with and map these attributes according to the Perceived Quality Framework (sensorial). Our focus is to determine areas within perceived quality they work with, e.g. visual, sound, haptic. The primary goal is to map their areas of perceived quality with our Framework.
Interview ingress:
Thank you for participating in this interview. We work at … . We are conducting study trying to identify different areas of perceived quality you are working on. Our goal is to map different dimensions of perceived quality; understand how you work with the different perceived quality attributes. We are conducting the same study at different automotive companies within premium and luxury segment and really appreciate your contribution in this study. This is an open question interview which means you can speak freely in the way convenient to you.
Is it all right that I voice record the interview?
Start with the general questions:
What are your responsibilities at the company?
How would you define Perceived Quality?
What is Perceived Quality from the engineering point of view?
Are you trying to predict customer opinion? To what extent?
If you are the trendsetter, how you define a new trend?
What are the prerequisites for good perceived quality?
What are the factors you pay attention?
How would you describe an ‘ultra-quality’ (delighter) in terms of perceived quality attributes?
What are the current methods that you’re using for translation customer emotions into the requirements? (Kano, Kansei, QFD)
The central part regarding mapping attributes:
Can you please explain what an attribute is and how you work with attributes?
(7.1) (if not in 7) How many do you have?
(7.2) (if not in 7) How do you rank your attributes?
What Perceived Quality attributes determine visual quality?
(8.1) Exterior?
(8.2) Interior?
To what Perceived Quality attributes you focus on assessing Material Quality?
To what Perceived Quality attributes you focus on assessing Geometry Quality?
To what Perceived Quality attributes you focus assessing Paint Finish?
To what Perceived Quality attributes you focus on assessing Illumination?
To what Perceived Quality attributes you focus on assessing Solid Function
What perceived quality attributes determine Feel Quality (Haptic)
To what Perceived Quality attributes you focus on assessing Sound Quality?
What attributes in your opinion are more critical for exterior and why?
What attributes in your opinion are more critical for interior and why?
Generalisation, influence of external factors, information asymmetry:
Could you name specific attributes that define DNA of the brand?
Is there a gap between design intention and execution?
How do you ‘code’ designer intentions so a customer will understand it?
What is the role of HMI in the impact on Perceived Quality?
What tool or method you as an engineer would like to have to build excellent perceived quality?