
Abstract
Purpose
In a nuclear or radiological event, an early diagnostic tool is needed to distinguish the worried well from those individuals who may later develop life-threatenFing hematologic acute radiation syndrome. We examined the contribution of the peripheral blood's cell populations on radiation-induced gene expression (GE) changes.
Materials and methods
EDTA-whole-blood from six healthy donors was X-irradiated with 0 and 4Gy and T-lymphocytes, B-lymphocytes, NK-cells and granulocytes were separated using immunomagnetic methods. GE were examined in cell populations and whole blood.
Results
The cell populations contributed to the total RNA amount with a ratio of 11.6 for T-lymphocytes, 1.2 for B-cells, 1.2 for NK-cells, 1.0 for granulocytes. To estimate the contribution of GE per cell population, the baseline (0Gy) and the radiation-induced fold-change in GE relative to unexposed was considered for each gene. The T-lymphocytes (74.8%/80.5%) contributed predominantly to the radiation-induced up-regulation observed for FDXR/DDB2 and the B-lymphocytes (97.1%/83.8%) for down-regulated POU2AF1/WNT3 with a similar effect on whole blood gene expression measurements reflecting a corresponding order of magnitude.
Conclusions
T- and B-lymphocytes contributed predominantly to the radiation-induced up-regulation of FDXR/DDB2 and down-regulation of POU2AF1/WNT3. This study underlines the use of FDXR/DDB2 for biodosimetry purposes and POU2AF1/WNT3 for effect prediction of acute health effects.
Introduction
In a large-scale radiological casualty event, the medical evaluation of exposed and unexposed individuals is needed. Such an evaluation allows predicting the severity of radiation injuries and to prioritize appropriate treatment (Chaudhry Citation2008). A high throughput testing capability is required for incidents involving hundreds or thousands of individuals. Several scenarios encompass widespread contamination following a dirty bomb or the release of radioactivity from a nuclear power plant. Limited clinical resources make it imperative to identify the truly highly exposed individuals from the many who believe they were exposed (the worried well).
We recently identified a candidate set of four gene transcripts (WNT3, POU2AF1, FDXR and DDB2) expressed in the peripheral blood of baboons within 1–2 days after radiation exposure (Port, Herodin, Valente, Drouet, Lamkowski, et al. Citation2016). The candidate markers were subsequently validated in irradiated human patients (Port et al. Citation2018). Analysis of the changes in expression of this gene set allowed us to discriminate between radiation-exposed individuals who developed a mild vs. those who developed a more severe degree of haematological acute radiation syndrome (HARS). HARS is a life-threatening disease requiring early treatment decisions and therapeutic support (Port, Herodin, Valente, Drouet, Lamkowski, et al. Citation2016; Port, Herodin, Valente, Drouet, Ullmann, et al. Citation2016; Port et al. Citation2017). In particular, up-regulation of FDXR and DDB2 expression changes were limited to lower dose exposures that resulted in a mild degree of the HARS while down-regulated WNT3 and POU2AF1 combined with up-regulated FDXR and DDB2 were predictive for severe HARS (Manning et al. Citation2013). No change in gene expression was associated with no radiation exposure and identified the worried well. In our previous work, we always focused on the gene-to-disease relation (effect prediction) rather than a dose-to-gene expression relationship (dose estimation) (Port, Majewski, et al. Citation2019). Our goal was to predict the effect (disease) based on early changes in gene expression after irradiation and not to estimate the dose.
In earlier studies, we conjectured about the reasons for the changes in gene expression, such as the targets of ionizing radiation leading to the changes observed: Is it the radiation exposed peripheral blood or is it a transcriptomic response of the irradiated body areas that are subsequently reflected in the peripheral blood (a so-called liquid biopsy) (Majewski et al. Citation2018)? In previous studies, we performed in vivo measurements in baboons (Port, Herodin, Valente, Drouet, Lamkowski, et al. Citation2016) and human leukemia patients (Port, Herodin, Valente, Drouet, Lamkowski, et al. Citation2018) and corresponding to these examinations we employed in vitro models and looked for gene expression changes of the four genes of interest (Port, Ostheim, et al.. Citation2019). Significantly, in this in vitro model, the altered expression of FDXR, DDB2, WNT3, POU2AF1 replicated our observations in exposed baboons and humans indicating that irradiated peripheral blood cells probably represent the origin of the gene expression changes measured in vivo and in vitro (Port, Herodin, Valente, Drouet, Lamkowski, et al. Citation2016).
In the present study, we examined which cell populations (granulocytes, T- and B-lymphocytes, and NK-cells) of the peripheral blood were contributing to radiation-induced gene expression changes of these four genes. Measurements in peripheral whole blood were performed as a positive control to ensure that the in vitro model accurately reflected the expected outcome in gene expression as examined in previous studies (see above). This study deepens our understanding of radiation-induced gene expression changes that are of diagnostic significance for developing HARS and might provide new strategies for better diagnostic procedures.
Materials and methods
Sample collection, irradiation and cell culture
Peripheral whole blood from six healthy donors (four male and two female volunteers, aged 24–37) was collected into several EDTA blood tubes (). Leucocyte blood cell counts were performed using the Neubauer counting chamber. Differential blood cell counts of all donors showed normal values (data not shown).
Figure 1. Study overview. Study design overview including X-irradiation of EDTA-whole blood samples, in vitro culture, whole blood cell population separation (including one whole blood cell culture), RNA isolation and gene expression measurements, and flow cytometry measurements showing successful cell separation.
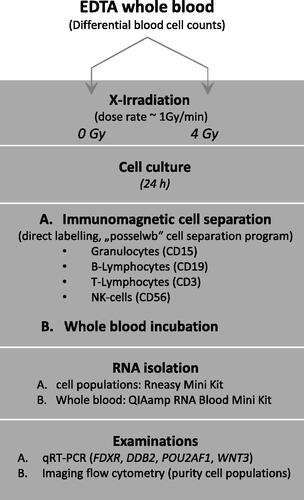
The EDTA blood tubes were either sham irradiated or exposed to 4 Gy (related to a more severe HARS degree according to our previous work (Port, Herodin, Valente, Drouet, Lamkowski, et al. Citation2016), ). In vitro irradiation was performed at 37 °C using single doses of X-rays filtered with 3 mm beryllium and 3 mm aluminum to give a mean photon energy of 100 keV delivered at approximately 1.0 Gy/min (Maxishot SPE cabin, Yxlon, Hamburg, Germany). The absorbed doses were measured using a UNIDOS webline 10021 dosimeter (PTW, Freiburg, Germany). The dose-rate was approximately 1.0 Gy/min at 13 mA and accelerating potential 240 kV (maximum photon energy of 240 keV).
Exposed blood samples were diluted 1:1 in pre-warmed RPMI cell culture medium supplemented with 10% fetal calf serum and incubated over 24 h. Vitality (dye exclusion assay using Trypan Blue) of whole blood was measured after erythrocyte lysis of aliquots from the cultured whole blood (see chapter ‘RNA extraction and quality control’ below) and vitality of cell populations was measured after cell separation (see chapter ‘Immunomagnetic cell separation’ below) using a Neubauer counting chamber. Vitality ranged between 95.5 to 98.7% and was in the same range for all blood subpopulations and whole blood (data not shown).
All samples were obtained with informed consent. Due to the minimal-invasive collection and the fully anonymized processing of the samples, the experiment did not require approval by the local ethical commission. This experimental design was granted by the Ethics committee (Bayerische Landesärztekammer, Munich, Germany).
Immunomagnetic cell separation
The peripheral blood cell populations were labeled with antibody conjugated MicroBeads followed by cell separation using the autoMACS Pro Separator (Miltenyi Biotec GmbH, Bergisch Gladbach, Germany, ). Protocols for use of MicroBeads (e.g. StraightFrom Whole Blood CD15 MicroBeads human protocol) and manual instructions for the autoMACS Pro Separator were utilized as provided by the manufacturer. The ‘direct labelling’ method with magnetic cell separation (MACS) MicroBeads (microbeads conjugated to anti-human CD antibodies) which specifically bind directly to antigens on the cell surface proved to be sufficient in pre-experimental data (not shown). During the method specified as ‘positive selection’, the target cells were magnetically labeled and collected as the positive fraction using the program ‘posselwb’ (positive selection in standard mode from whole blood). Magnetic-beads were used for whole blood cell separation of
Granulocytes (StraightFrom™ Whole Blood CD15 MicroBeads human),
B-Lymphocytes (StraightFrom™ Whole Blood CD19 MicroBeads human),
T-Lymphocytes (StraightFrom™ WholeBlood CD3 MicroBeads human) and
NK-cells (StraightFrom™ Whole Blood CD56 MicroBeads human).
In short, magnetic labeling was performed manually by adding 50 μL MicroBeads conjugates per 1 ml whole blood in cell culture. The suspension was mixed, incubated at 4 °C for 15 min, centrifuged (speed at 445 × g, 10 min, at room temperature), the supernatant was discarded and the pellet was resuspended in 1 ml separation buffer. Magnetic separation was performed automatically using the program ‘Posselwb’ on the autoMACS Pro Separator. After that, RNA was isolated as shown below. Each cell population was separated from a total of 10 ml whole blood per independent experiment and donor. All material was ordered by Miltenyi Biotec GmbH (Bergisch Gladbach, Germany).
Purity and quantity of isolated cell populations
Following the immunomagnetic cell separation, the purity (and cell counts) of the cell populations (T-, B-Lymphocytes, NK-cells and granulocytes) was assessed using the ImageStream® X mkII (Luminex, Austin, TX, USA) imaging flow cytometer. Whole blood samples were treated with erythrocyte lysis buffer (EL-Buffer, Qiagen, Hilden, Germany) according to the manufacturer’s protocol, MACS sorted cells were washed once with PBS (–Ca/–Mg) prior to further use. Live-cell staining was performed for 15 min on ice at 106 cells per ml of previously prepared antibody cocktail prepared in PBS + 0.5% BSA and containing (i) mouse anti-Human CD3 (HIT3a) – FITC, (ii) Mouse anti-Human CD56 (5.1H11) – APC, (iii) Mouse anti-Human CD15 (MMA) – PacificBlue (BioLegend, San Diego, CF, USA) and (iv) Mouse anti-Human CD20 (REA780) – PE (Miltenyi Biotec GmbH, Bergisch Gladbach, Germany). Although CD19 was used to purify the B-Lymphocytes, CD20 was used for analysis, as CD19 could not be detected any longer via flow cytometry following MACS purification using CD19 as a target. After the incubation period, cells were washed twice using PBS and resuspended in 100 µl PBS for flow cytometry measurement.
Excitation Lasers with 405, 488 and 642 nm were used at laser powers adjusted to the sample with the highest expected signal for each data set, side scatters laser was using 785 nm. Channel compensation values were generated using single stained samples and analysis was performed by gating high intensities within the corresponding channels.
The total number of stained cells (CD3, CD15, CD20, CD56 positive cells) was summed up within each sample and compared to the number of cells of the desired subset to yield the purity. Non-fluorescently marked objects, mainly debris and erythrocytes were not included in purity calculations.
RNA extraction and quality control
RNA from whole blood was isolated by QIAamp® RNA Blood Mini kit following the manufacturer’s protocol, but with a doubling of the centrifugation time to increase yields. In brief, one volume of whole blood was mixed with five volumes of the erythrocyte lysis (EL) buffer, incubated on ice and centrifuged for 20 min at a speed of 400 g and 4 °C. After discarding the supernatant, this step was repeated with another two volumes of EL buffer. White blood cells of the pellet were lysed (RLT buffer), homogenized, and ethanol added. The samples were applied to the QIAamp® membrane spin column, wash buffer added and spun. DNA was digested (DNase) on the column, samples were washed several times and RNA eluted in RNAse-free water.
RNA from cell populations was isolated following the RNeasy Mini Kit (Qiagen). In brief, cells were lysed (RLT-buffer) with RNA precipitated by adding ethanol. The samples were transferred on a spin column containing a silica-membrane which binds RNA and washed three times. DNA was digested (DNase) on the column, samples washed several times and RNA eluted in RNAse-free water.
The isolated RNA was quantified spectrophotometrically (NanoDrop™, PeqLab Biotechnology, Erlangen, Germany). RNA integrity was assessed by 2100 Agilent Bioanalyzer (Life Science Group, Penzberg, Germany). Possible contamination by sample genomic DNA was controlled by PCR using primers for the actin gene. RNA specimens with a ratio of A260/A280 nm ≥2.0 and RNA integrity number (RIN) ≥8 were processed for qRT-PCR analysis.
Real-time quantitative reverse transcription polymerase chain reaction (qRT-PCR)
Aliquots of total RNA (e.g. 0.25, 0.5 or 1 µg) were reverse transcribed with the High-Capacity cDNA Reverse Transcription Kit (Applied Biosystems™, Life Technologies, Darmstadt, Germany). The PCR reactions were performed using commercial TaqMan® assays (FDXR, Hs01031617_m1; WNT3, Hs00902257_m1; POU2AF1, Hs01573369_m1; DDB2, Hs03044949_m1; 18S rRNA (Human), Hs03003631_g1) following the qRT-PCR 7900er amplification protocol.
The cycle threshold (Ct) values reflect RNA copy numbers in an inverse log2 transformed fashion. Therefore, lower Ct-values reflect higher RNA copy numbers and the other way around. In the next step, Ct-values of the four genes were normalized relative to 1:1000 diluted 18S rRNA in order to make samples comparable with each other (ensuring the same RNA yield). Normalized Ct-values of the unexposed samples represents the baseline RNA copy numbers. Finally, fold-change differences (FC) of irradiated samples relative to the unexposed sample at the same time point were determined. An FC of one corresponds to a gene expression similar to unexposed samples or baseline levels. A FC higher or lower than one refers to a several-fold over- or under-expression of the gene of interest after exposure relative to the reference. In order to better address the very well established way of data analysis, we developed Supplemental Table 1 exemplifying the calculations (-DD CT-approach) for one gene (FDXR). All materials and consumables used were ordered from Thermo Fisher/Applied Biosystems (Weiterstadt, Germany). All experimental work was performed according to the standard operating procedures implemented in our laboratory since 2008 when the Bundeswehr Institute of Radiobiology became DIN-accredited by TÜV Süd München, Germany (DIN EN ISO 9001/2008).
Table 1. Overview on radiation-induced gene expression changes in whole blood and four cell populations under different considerations.
Statistics
We compared radiation-induced copy number changes among four cell populations in peripheral blood. Three calculations were performed to consider differences among cell populations given by the (1) RNA yield, (2) baseline differences among genes and (3) fold-differences after irradiation (). These combined provided a final judgment on the quantity of the origin of the RNA copy numbers among cell populations. Initially, we adjusted RNA yields of cell populations relative to the lowest RNA yield measured in granulocytes and used this as the reference. The fold-changes reflected the fold-differences in RNA yield relative to each cell population. Whole blood was not considered, because of a different workflow from the cell populations. The baseline gene expression values (0 Gy) were expressed as normalized Ct-values which represent the inverse log2-transformed gene copy number. Adjusted fold-changes relative to the lowest gene copy number (represented by the highest Ct-values) observed in the cell populations (throughout granulocytes) were used as the reference. Fold-changes after irradiation were calculated using the unexposed samples as the reference. The so called ‘overall fold-change after exposure’ per cell population was expressed as the product of adjusted fold-changes regarding RNA yield, baseline gene expression (expressed as normalized Ct-values) and the fold-change after irradiation. These values were finally presented in percent of the examined gene expression relative to all four cell populations.
Statistics were performed using Sigma Plot 14 (Jandel Scientific, Erkrath, Germany). Group comparisons were performed using either parametrical (Student’s t-test or Welch’s test, if the equality of the population variances of the two groups is in doubt) or non-parametrical tests (Mann–Whitney Rank Sum Test), where applicable. Data are reported as mean ± standard error of mean.
Results
Cell population quantity and purity
Unirradiated samples cultured over 24 h showed about 2-fold borderline significant (p = .07) decreased whole blood leucocyte counts in comparison to unirradiated whole blood, cultured over a few minutes (, left part of the graph). This effect depended on the culture time and did not significantly diminish after radiation exposure (, left part of the graph, p > .4). Leucocyte counts appeared smaller compared to expected normal leukocyte counts which was caused due to additional preparation steps (e.g. erythrocyte lysis and centrifugation steps) performed before the cell count measurements using the Neubauer chamber. The relative composition of leucocyte cell populations (given in percent) appeared unaffected (p-values > .05, data not shown) with respect to the cell culture time or the radiation exposure and was highest for T-lymphocytes (56.0–61.2%), followed by granulocytes (20.7–32%), NK-cells (10.3–13.7%) and B-lymphocytes (1.7–4.3%, , right part of the graph and corresponding table below the figure).
Figure 2. Quantities in leucocyte counts and relative composition of four cell populations with and without irradiation. The left part of the figure presents leucocyte counts (left Y-scale) in unirradiated (0 Gy) and irradiated (4 Gy) whole blood cultures (‘cult’) which were either incubated for a few minutes (referred to as ‘0h cult’) or 24 h (referred to as ‘24h cult’). The right part of the figure depicts the relative composition (in percent, right Y-scale) of the four leucocyte cell populations on the x-axis. Bars represent the mean and error bars the standard error of mean (n = 4). Differences between groups (absolute leucocyte counts and relative compositions of cell populations) are not statistically significant.
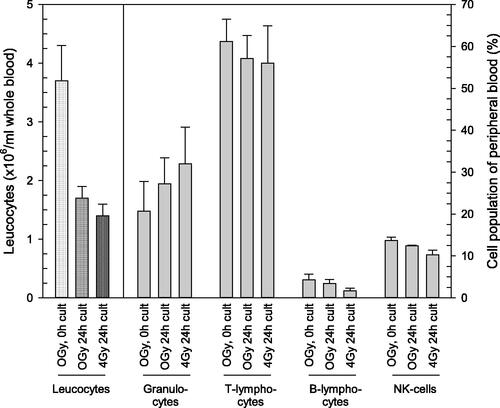
Figure 3. Purity of four cell populations after immunomagnetic cell separation. After immunomagnetic cell separation of T-lymphocytes, B-lymphocytes, NK-cells and granulocytes, these cells were examined using flow cytometry for the efficiency of the cell separation process. Typical density plots (0 h, 0 Gy, single donor) are presented for the cell populations as outlined in the images. The density plot represents a three dimensional scatter plot and shows quantities of cell counts using a color code (red = highest, blue = lowest quantities). The table below reflects the corresponding purity of each separated cell type (in percent) and treatment conditions.
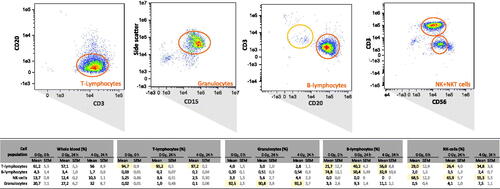
The purity of isolated T-lymphocytes and granulocytes ranged between 90.8–97.2% ( and the corresponding table below the figure). NK-cells (mean of 63.2% over all treatments) as well as B-lymphocytes (mean of 52.7% over all treatments) did show a 5.2 and 16.8-fold enrichment of cell counts relative to the whole blood percentages (12.1% for NK-cells and 3.1% for B-lymphocytes), but about one-third of cell counts represented T-lymphocytes ().
RNA quantity and quality in cell populations
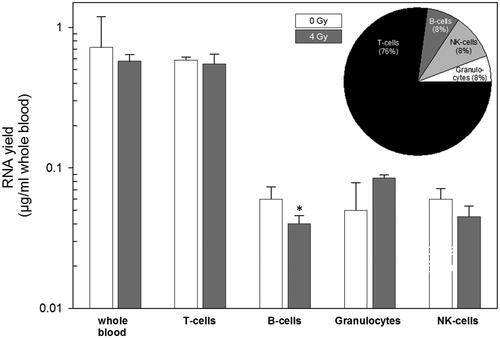
For whole blood on average 0.72 and 0.58 µg/ml RNA was isolated in unexposed and irradiated samples, respectively, and the majority of RNA with 0.59 at 0 Gy and 0.56 µg/ml at 4 Gy irradiation originated from T-lymphocytes (, upper panel). The cell populations on average contributed to the total RNA amount with a ratio of 11.6 (T-lymphocytes): 1.2 (B-cells): 1.2 (NK-cells): 1.0 (granulocytes, , upper panel and pie chart, ). RNA yields (per ml whole blood) showed no significant differences between radiation-exposed and unexposed whole blood as well as the cell populations, except for B-lymphocytes (p = .04).
Figure 4. Examining RNA yields in whole blood and cell populations with and without irradiation. Isolated RNA yields (µg/ml whole blood) in whole blood (showing expected values based on previous experiments and served as positive control) and four cell populations of peripheral blood is indicated on the x-axis. Measurements were performed in irradiated (4 Gy, gray filled bars) and unirradiated (0 Gy, white filled bars) whole blood cell cultures. The inserted pie chart represents the relative contribution of the four cell population on RNA yield measurements in percent. Bars refer to the mean and error bars to the standard error of the mean (n = 6). A p-value of .04 is marked with one asterisk and refers to RNA yield differences between unexposed and exposed B-cells.
Mean RIN values generated in unirradiated samples decreased (from highest to lowest, in parenthesis) in T-cells (10.0, ±0.0), B-cells (9.1, ±0.1), NK-cells (9.0, ±0.2), whole blood (8.9, ±0.3) and were lowest for granulocytes (7.9, ±0.2), respectively, but remained in a range to run qRT-PCR successfully. These values were not significantly different from exposed samples, except for B-lymphocytes (p = .004).
Gene expression in whole blood and cell populations
An expected (positive control) radiation-induced up-regulation of FDXR and DDB2 (, upper panel) and corresponding lower normalized Ct-values were found in the whole blood (, lower panel).
Figure 5. Gene expression measurements of four genes in whole blood and four cell populations. The figure describes fold-differences relative to unexposed in the upper panel and normalized gene expression changes in the lower panel. Upper panel: Differential gene expression of FDXR, DDB2, POU2AF1 and WNT3 was measured in peripheral whole blood and four cell populations of peripheral blood in six healthy donors after irradiation (cell culture). Fold changes were calculated relative to the corresponding unexposed samples used as a reference and set to the value 1. Symbols reflect the geometric mean and error bars show the standard error of mean (n = 6). Missing error bars in irradiated samples (e.g. granulocytes) reflect measurements performed in one individual only (see Supplemental figures). Lower panel: Normalized gene expression (expressed as Ct-values) of FDXR, DDB2, POU2AF1 and WNT3 was measured in peripheral blood and four cell populations of peripheral blood in six healthy donors at 0 Gy (baseline) and 4 Gy. Symbols reflect the geometrical mean and error bars show the standard error of mean (n = 6). Ct-values represent inverse log-2 transformed gene expression changes. For instance, higher Ct-values refer to less RNA copy numbers and the other way around and one Ct-value difference corresponds to two-fold differences in RNA copy numbers. p-Values were calculated between exposed and unexposed samples for each cell population and p-values ≤.05–.01, <.01–.001 and <.0001 are marked with one, two and three asterisks. Abbreviations. nd: not determined, due to missing multiple measurements.
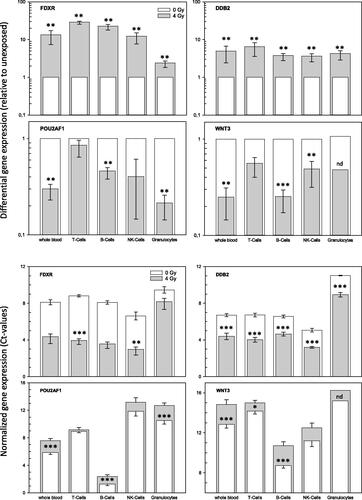
Baseline copy numbers and radiation-induced fold-changes in FDXR gene expression were lowest in granulocytes ( and ). T- and B-cells showed about 1.5- to 2.5-fold higher baseline copy numbers and FDXR was 23- to 29-fold up-regulated after exposure. The highest baseline levels were found for NK-cells, but FDXR was 12.4-fold up-regulated after exposure. The inter-individual variance of baseline levels and fold changes were low among all six donors (Supplemental Figures 1 and 2). All these FDXR fold-changes combined originated from T-cells (74.8%) followed by NK-cells (15.0%), B-cells (9.8%) and granulocytes (0.3%, ).
A similar pattern was found for DDB2: a low inter-individual variance of baseline levels and fold changes were observed in all six donors (Supplemental Figures 3 and 4). Granulocytes revealed the lowest baseline copy numbers followed by T-cells, B-cells and highest baseline fold-changes of 59.7 relative to granulocytes were found in NK-cells (Supplemental Figures 3 and 4 and ). Fold-changes after irradiation were about 4-fold up-regulated in all cell populations, but 6.5-fold up-regulation in T-cells, resulting in DDB2 overall fold changes that were based on T-cells (80.5%) followed by NK-cells (14.0%), B-cells (5.2%) and granulocytes (0.2%, ).
An expected (positive control) radiation-induced down-regulation of POU2AF1 and WNT3 (, upper panel) and corresponding higher Ct-values were found in the whole blood (, lower panel). In particular, B-cells showed much lower Ct-values compared to the other cell populations which converted to 576-times and 88.6-times higher than baseline copy numbers of POU2AF1 and WNT3 relative to granulocytes (, ). POU2AF1 and WNT3 radiation-induced copy numbers increased about 2- to 4-fold in B-cells, NK-cells and Granulocytes, but remained almost unchanged in T-lymphocytes. This pattern resulted in POU2AF1 and WNT3 overall fold changes associated with 97.1% and 83.8% from B-cells (). T-cells and NK-cells contributed another 8.1% and 7.7% to the overall fold change of WNT3, respectively (). Inter-individual variance for both genes appeared very high in NK-cells and granulocytes regarding POU2AF1, while WNT3 could not be detected in granulocytes of most donors except one (Supplemental Figures 5–8).
Comparisons with respect to the total copy numbers per gene appeared lowest for WNT3 (508) followed by FDXR (689), POU2AF1 (1547) and DDB2 (1844, ).
Discussion
Nuclear or radiological casualty events require early triage and high-throughput diagnostic testing for predicting the severity of late hematologic acute radiation syndrome (H-ARS). Recently, our laboratory identified several genes that discriminated against radiation unexposed from exposed individuals and those developing different degrees of H-ARS (Port, Herodin, Valente, Drouet, Lamkowski, et al. Citation2016; Port et al. Citation2018). Of note, our approach did not focus on dose estimation but rather converted radiation-induced gene expression changes into medically relevant information. This facilitated the interface of radiobiology with clinical decisions about treatment with respect to HARS severity. In our view, individual medical intervention can be improved beyond a reliance on difficult to interpret dose estimates.
In previous studies, we performed in vivo and corresponding in vitro gene expression measurements on baboons (Port, Herodin, Valente, Drouet, Lamkowski, et al. Citation2016) and human leukemia patients (Port et al. Citation2018). We showed similar altered expression of FDXR, DDB2, POU2AF1, WNT3 in vivo and in vitro indicating that irradiated peripheral blood cells probably represent the origin of the gene expression changes measured (Port, Ostheim, et al. Citation2019).
In the present study, we examined gene expression separately in granulocytes, T- and B-lymphocytes as well as NK-cells. Here, we identified T-cells as the predominant source contributing to about 12-times more total RNA yield when using this in vitro model (). In order to estimate the contribution of gene expression per cell population, differences in RNA yield, as well as the baseline (0 Gy) and the radiation-induced fold-changes in gene expression relative to unexposed, were considered for each gene. After considering all three parameters, it was the T-lymphocytes (74.8%/80.5%) that contributed predominantly to the radiation-induced up-regulation observed for FDXR/DDB2 and the B-lymphocytes (97.1%/83.8%) for down-regulated POU2AF1/WNT3. These gene expression changes were predominantly found in T-cells and B-cells, resulting in a corresponding impact on whole peripheral blood gene expression measurements reflecting the same order of magnitude ().
To our knowledge, this is the most comprehensive study systematically examining well known and established radiation-inducible genes such as FDXR and DDB2 in different cell populations of the peripheral blood. Other studies that examined these genes in T-lymphocytes or B-cells and cited FDXR and DDB2 measurements were in agreement with our findings (Mori et al. Citation2005; Pogosova-Agadjanyan et al. Citation2010; Boldt et al. Citation2012; Kabacik et al. Citation2015). References regarding the use of radiation-induced POU2AF1 and WNT3 are still limited, since both genes were introduced and validated only recently as predictive genes for severe HARS (Templin et al. Citation2011; Abend et al. Citation2016; Port et al. Citation2018; Port, Ostheim, et al. Citation2019). However, the association of the WNT pathway with radioresistance of esophageal squamous cell carcinoma has been reported (Liu et al. Citation2019). Also, the repair of the small intestine following exposure to radiation appeared to be mediated via increased activation of the Wnt/β-catenin signaling pathway (Gong et al. Citation2016).
Peripheral blood cell populations differ in their cellular response to ionizing radiation (Prosser Citation1976; Louagie et al. Citation1999; Bogdándi et al. Citation2010). This suggests differential regulation of genes and presents the potential for improved diagnostic ability when examining gene expression in cell populations instead of the overall gene expression in whole peripheral blood. Our results regarding FDXR and DDB2 argue against it because (1) T-lymphocytes represented the major source regarding total RNA of whole blood (, ); (2) T-lymphocytes appeared to be particularly radio-responsive and large fold-changes relative to unexposed samples were observed for FDXR and DDB2 ( and ); (3) all cell populations behaved similarly so that the direction of gene expression was always the same (up- or down-regulated). Therefore, an improved diagnosis via gene expression measurements of FDXR or DDB2 in specific cell populations of the peripheral blood is unlikely and this is in agreement with previous work (Riecke et al. Citation2012). With respect to POU2AF1 and WNT3, B-cells are mainly contributing to radiation-induced gene expression changes. For these H-ARS predictive genes, an enrichment strategy to increase the sensitivity could be pursued. Our studies showed a weak contribution from all other cell populations (, ). However, fold-differences in gene expression in whole blood reflected the same order of magnitude (4-fold decreased radiation-induced gene expression) as it was examined in the B-cells. Hence, when using whole blood or performing a B-cell separation as an additional step, baseline copy numbers with Ct-values below 20 would be easily detectable and radiation-induced fold-differences would not differ, but the workflow would become more complicated due to the additional cell separation step ().
Our study has limitations and strengths. For instance, peripheral blood was incubated in vitro over 24 h. So, we cannot discriminate (1) whether, for example, irradiated T-cells or B-cells directly responded to ionizing radiation; (2) whether T-cells or B-cells got stimulated by other cell populations (e.g. via released cytokines, (Cho et al. Citation2018)) or (3) whether a combination of both effects took place. Nevertheless, this design appeared closest to the in vivo situation and irradiating cell populations after cell separation and cultivating them separately would have introduced additional biases into the study design. Since we performed these examinations at 24 h after irradiation, we can only speculate whether radiation-induced gene-expression changes at other time points would show the same pattern. However, according to previous examinations, gene expression changes are of comparable magnitude between 4 and 24 h after irradiation (Ostheim et al. Citation2020).
The approximate 5-fold reduction in total leucocyte counts observed after 24 h cell culture time represents an undesired limitation of our in vitro model (, left part) and this has been examined before (Goldhofer et al. Citation1979; Wasserman et al. Citation1982; Fujimori et al. Citation2000; Ostheim et al. Citation2020). Also, other studies observed radiation-induced decreased cell counts which differed among leucocyte cell populations (Gridley et al. Citation2009; Paul et al. Citation2013), but in our in vitro model, the relative composition of leucocyte cell populations appeared almost unaltered and changed only slightly after irradiation (, right part). Presumably, radiation-induced cell count alterations are masked by the cell culture conditions of our widely used in vitro whole blood model. Otherwise, altered cell counts were reported several days after exposure (Gridley et al. Citation2009; Paul et al. Citation2013; El-Shanshoury et al. Citation2016), and our work examined changes 24 h after radiation exposure which could be another explanation of our findings. However, regarding decreased cell counts the in vitro whole blood model used probably does not reflect the in vivo situation. Nevertheless, this widely used in vitro model correctly reflects the in vivo situation on the gene expression level regarding certain genes, namely FDXR and DDB2, which are very established in the field of biodosimetry (Paul & Amundson Citation2008; Pogosova-Agadjanyan et al. Citation2010; Boldt et al. Citation2012; Kabacik et al. Citation2015; Macaeva et al. Citation2019; O’Brien et al. Citation2018; Port et al. Citation2018). Previous work indicated these gene expression changes to reflect a response of irradiated peripheral blood cells (Port et al. Citation2018) and this aspect qualifies the model to be used for this purpose only. This again underlines the artificiality of in vitro models and researchers have to characterize the in vitro models employed to be aware of limitations and strength.
Of note, we recently published work that indicates stable leucocyte counts up to 12 h of cell culture and corresponding radiation-induced fold differences in the same order of magnitude as observed after 24 h in this in vitro model (Ostheim et al. Citation2020). Hence, in future examination using this in vitro model it might be advisable to perform examinations up to 12 h of cell culture and no longer without losing sensitivity.
Another limitation reflects the isolation and measurements on only four cell populations, which altogether represent the majority but not all different cell types of the peripheral blood.
A limitation is that our study included only six healthy donors. The consistency of FDXR and DDB2 results and the low variance found in all cell populations and donors, argues in favor of the robustness of our observations. More inter-individual variance for POU2AF1 and WNT3 gene expression measurements among cell populations and in particular difficulties in WNT3 detection in granulocytes was observed. However, the observed pattern (e.g. predominant radiation-induced gene expression changes in B-lymphocytes) was similar among donors, indicating this reliably reflected features of the in vitro model.
The magnetic separation of T-lymphocytes and granulocytes was very efficient (91–97%) which supports the idea that gene expression measurements performed in both cell populations really reflect changes inherent to them. For B-lymphocytes and NK-cells a 5- to 17-fold enrichment in cell counts relative to percentages measured in the peripheral whole blood could be observed, but about one-third of cell counts represented T-lymphocytes. Hence, fold-differences of POU2AF1 and WNT3 measured in separated B-lymphocytes are probably lowered due to the T-lymphocyte contamination and would have been even increased in a B-lymphocyte culture of higher purity. Furthermore, considerable quantities of erythrocytes were detected after magnetic separation in all cell populations. Recently, transcripts originating from 859 genes were identified in erythrocytes (Kabanova et al. Citation2009) and several studies report radiation-induced damage and changes in gene expression in red blood cells (Schjeide et al. Citation1983; Peslak et al. Citation2011; Xu et al. Citation2012). Due to erythrocyte omnipresence in all cell populations and divergent gene expression patterns measured in the cell populations, a major impact of erythrocytes on our gene expression measurements appears unlikely.
Our study identified T- and B-lymphocytes as the ‘driving’ sources for baseline and radiation-induced gene expression of FDXR/DDB2 and POU2AF1/WNT3. More details regarding their function are not known and require further study.
In summary, T-lymphocytes and B-lymphocytes contributed predominantly to the radiation-induced up-regulation of FDXR/DDB2 and down-regulation of POU2AF1/WNT3 with a corresponding effect on whole blood gene expression measurements reflecting this order of magnitude. Hence, further separation of cell populations will not increase the sensitivity of radiation-induced gene expression in this in vitro model and for these four genes but complicate an efficient workflow. Also, this study deepens our understanding and clearly identifies undesired limitations of widely used whole blood in vitro models and after considering all of this, it still underlines the use of FDXR and DDB2 for biodosimetry purposes and POU2AF1 and WNT3 for effective prediction of acute health effects.
Supplemental_figure_8_WNT3_CT_statist_MA.pdf
Download PDF (536.2 KB)Supplemental_figure_7_WNT3_FC_statist_MA.pdf
Download PDF (537.3 KB)Supplemental_figure_6_POU2AF1_CT_statist_MA.pdf
Download PDF (540.3 KB)Supplemental_figure_5_POU2AF1_FC_statist_MA.pdf
Download PDF (540.4 KB)Supplemental_figure_4_DDB2_CT_statist_MA.pdf
Download PDF (537.1 KB)Supplemental_figure_3_DDB2_FC_statist_MA.pdf
Download PDF (539.5 KB)Supplemental_figure_2_FDXR_CT_statist_MA.pdf
Download PDF (536.4 KB)Supplemental_figure_1_FDXR_FC_statist_MA.pdf
Download PDF (537.9 KB)Suppl_table_1_FDXR_CT_FC_SiS_MA_V3.xlsx
Download MS Excel (45.4 KB)Acknowledgments
This work represents, in part, data from the Doctoral thesis of A. Don Mallawaratchy. The carefully performed introduction into laboratory methods and techniques and the irradiation of the samples was done by Thomas Müller, Sven Doucha-Senf and Oliver Wittmann and is highly appreciated.
Disclosure statement
No potential conflict of interest was reported by the author(s).
Additional information
Funding
Notes on contributors
Patrick Ostheim
Patrick Ostheim, MD, is a Post-Doctoral Researcher of Radiobiology and a resident in Radiology at the Bundeswehr Institute of Radiobiology, Munich, Germany.
Alan Don Mallawaratchy
Alan Don Mallawaratchy is a Doctoral Student at the Bundeswehr Institute of Radiobiology, Munich, Germany and a Medical Student at the Technical University of Munich, Germany.
Thomas Müller
Thomas Müller is a Technical Assistant at the Bundeswehr Institute of Radiobiology, Munich, Germany.
Simone Schüle
Simone Schüle, MD, is a Research Assistant of Radiobiology and a resident in Radiology at the Bundeswehr Institute of Radiobiology, Munich, Germany.
Cornelius Hermann
Cornelius Hermann is a Research Assistant of Radiobiology and a Pharmacist at the Bundeswehr Institute of Radiobiology, Munich, Germany.
Tanja Popp
Tanja Popp, PhD, is a Post-Doctoral Researcher and a Biologist at the Bundeswehr Institute of Radiobiology, Munich, Germany.
Stefan Eder
Stefan Eder, MD, is a Post-Doctoral Researcher of Radiobiology and a Doctor of Occupational Medicine at the Bundeswehr Institute of Radiobiology, Munich, Germany.
Stephanie E. Combs
Stephanie E. Combs, MD, is a Professor of Radiotherapy and Head of the Department of Radiation Oncology at the Klinikum rechts der Isar, Technical University of Munich, Germany.
Matthias Port
Matthias Port, MD, is a Professor of Radiobiology and Head of the Bundeswehr Institute of Radiobiology, Munich, Germany.
Michael Abend
Michael Abend, MD, is a Professor of Radiobiology and Deputy Head of the Bundeswehr Institute of Radiobiology, Munich, Germany.
Related Research Data
References
- Abend M, Badie C, Quintens R, Kriehuber R, Manning G, Macaeva E, Njima M, Oskamp D, Strunz S, Moertl S, et al. 2016. Examining radiation-induced in vivo and in vitro gene expression changes of the peripheral blood in different laboratories for biodosimetry purposes: first RENEB gene expression study. Radiat Res. 185(2):109–123.
- Bogdándi EN, Balogh A, Felgyinszki N, Szatmári T, Persa E, Hildebrandt G, Sáfrány G, Lumniczky K. 2010. Effects of low-dose radiation on the immune system of mice after total-body irradiation. Radiat Res. 174(4):480–489.
- Boldt S, Knops K, Kriehuber R, Wolkenhauer O. 2012. A frequency-based gene selection method to identify robust biomarkers for radiation dose prediction. Int J Radiat Biol. 88(3):267–276.
- Chaudhry MA. 2008. Biomarkers for human radiation exposure. J Biomed Sci. 15(5):557–563.
- Cho SJ, Kang H, Hong EH, Kim JY, Nam SY. 2018. Transcriptome analysis of low-dose ionizing radiation-impacted genes in CD4+ T-cells undergoing activation and regulation of their expression of select cytokines. J Immunotoxicol. 15(1):137–146.
- El-Shanshoury H, El-Shanshoury G, Abaza A. 2016. Evaluation of low dose ionizing radiation effect on some blood components in animal model. J Radiat Res Appl Sci. 9(3):282–293.
- Fujimori Y, Saheki K, Itoi H, Okamamoto T, Kakishita E. 2000. Increased expression of Fas (APO-1, CD95) on CD4+ and CD8+ T lymphocytes during total body irradiation. Acta Haematol. 104(4):193–196.
- Goldhofer W, Kreienberg R, Kutzner J, Lemmel EM. 1979. Der Einfluss von Röntgenstrahlen auf die B- und T-Zellen in der Milz der Maus und deren Reaktivität auf Mitogene. Strahlentherapie. 155:277–283.
- Gong W, Guo M, Han Z, Wang Y, Yang P, Xu C, Wang Q, Du L, Li Q, Zhao H, et al. 2016. Mesenchymal stem cells stimulate intestinal stem cells to repair radiation-induced intestinal injury. Cell Death Dis. 7(9):e2387.
- Gridley DS, Slater JM, Luo-Owen X, Rizvi A, Chapes SK, Stodieck LS, Ferguson VL, Pecaut MJ. 2009. Spaceflight effects on T lymphocyte distribution, function and gene expression. J Appl Physiol. 106(1):194–202.
- Kabacik S, Manning G, Raffy C, Bouffler S, Badie C. 2015. Time, dose and ataxia telangiectasia mutated (ATM) status dependency of coding and noncoding RNA expression after ionizing radiation exposure. Radiat Res. 183(3):325–337.
- Kabanova S, Kleinbongard P, Volkmer J, Andrée B, Kelm M, Jax TW. 2009. Gene expression analysis of human red blood cells. Int J Med Sci. 6(4):156–159.
- Liu J, Xue N, Guo Y, Niu K, Gao L, Zhang S, Gu H, Wang X, Zhao D, Fan R. 2019. CircRNA_100367 regulated the radiation sensitivity of esophageal squamous cell carcinomas through miR-217/Wnt3 pathway. Aging. 11(24):12412–12427.
- Louagie H, Van Eijkeren M, Philippe J, Thierens H, De Ridder L. 1999. Changes in peripheral blood lymphocyte subsets in patients undergoing radiotherapy. Int J Radiat Biol. 75(6):767–771.
- Macaeva E, Mysara M, De Vos WH, Baatout S, Quintens R. 2019. Gene expression-based biodosimetry for radiological incidents: assessment of dose and time after radiation exposure. Int J Radiat Biol. 95(1):64–75.
- Majewski M, Nestler T, Kägler S, Richardsen I, Ruf CG, Matthies C, Willms A, Schmelz HU, Wagner W, Schwab R, et al. 2018. Liquid biopsy using whole blood from testis tumor and colon cancer patients-a new and simple way? Health Phys. 115(1):114–120.
- Manning G, Kabacik S, Finnon P, Bouffler S, Badie C. 2013. High and low dose responses of transcriptional biomarkers in ex vivo X-irradiated human blood. Int J Radiat Biol. 89(7):512–522.
- Mori M, Benotmane MA, Tirone I, Hooghe-Peters EL, Desaintes C. 2005. Transcriptional response to ionizing radiation in lymphocyte subsets. Cell Mol Life Sci. 62:1489–1501.
- O’Brien G, Cruz-Garcia L, Majewski M, Grepl J, Abend M, Port M, Tichý A, Sirak I, Malkova A, Donovan E, et al. 2018. FDXR is a biomarker of radiation exposure in vivo. Sci Rep. 8(1):684.
- Ostheim P, Coker O, Schüle S, Hermann C, Combs SE, Trott K-R, Atkinson M, Port M, Abend M. 2020. Identifying a diagnostic window for the use of gene expression profiling to predict acute radiation syndrome. Radiat Res. 195(1):38–46.
- Paul S, Amundson SA. 2008. Development of gene expression signatures for practical radiation biodosimetry. Int J Radiat Oncol Biol Phys. 71(4):1236–1244.
- Paul S, Smilenov LB, Amundson SA. 2013. Widespread decreased expression of immune function genes in human peripheral blood following radiation exposure. Radiat Res. 180(6):575–583.
- Peslak SA, Wenger J, Bemis JC, Kingsley PD, Frame JM, Koniski AD, Chen Y, Williams JP, McGrath KE, Dertinger SD, et al. 2011. Sublethal radiation injury uncovers a functional transition during erythroid maturation. Exp Hematol. 39(4):434–445.
- Pogosova-Agadjanyan EL, Georges FW, Schwartz GE, Kepler JL, Lee CM, Suchanek H, Cronk Mr AL, Brumbaugh A, Engel JH, et al. 2010. Identification of Radiation-Induced Expression Changes in Nonimmortalized Human T Cells. Radiat Res. 175(2):172–184.
- Port M, Herodin F, Valente M, Drouet M, Lamkowski A, Majewski M, Abend M. 2016. First generation gene expression signature for early prediction of late occurring hematological acute radiation syndrome in baboons. Radiat Res. 186(1):39–54.
- Port M, Herodin F, Valente M, Drouet M, Ullmann R, Doucha-Senf S, Lamkowski A, Majewski M, Abend M. 2016. MicroRNA expression for early prediction of late occurring hematologic acute radiation syndrome in baboons. PLoS One. 11(11):e0165307.
- Port M, Hérodin F, Valente M, Drouet M, Ullmann R, Majewski M, Abend M. 2017. Pre-exposure gene expression in baboons with and without pancytopenia after radiation exposure. Int J Mol Sci. 18(3):541.
- Port M, Majewski M, Abend M. 2019. Radiation dose is of limited clinical usefulness in persons with acute radiation syndrome. Radiat Prot Dosimetry. 186(1):126–129.
- Port M, Majewski M, Herodin F, Valente M, Drouet M, Forcheron F, Tichy A, Sirak I, Zavrelova A, Malkova A, et al. 2018. Validating baboon ex vivo and in vivo radiation-related gene expression with corresponding human data. Radiat Res. 189(4):389–398.
- Port M, Ostheim P, Majewski M, Voss T, Haupt J, Lamkowski A, Abend M. 2019. Rapid high-throughput diagnostic triage after a mass radiation exposure event using early gene expression changes. Radiat Res. 192(2):208–218.
- Prosser JS. 1976. Survival of human t and b lymphocytes after x-irradiation. Int J Radiat Biol. 30(5):459–465.
- Riecke A, Rufa CG, Cordes M, Hartmann J, Meineke V, Abend M. 2012. Gene expression comparisons performed for biodosimetry purposes on in vitro peripheral blood cellular subsets and irradiated individuals. Radiat Res. 178(3):234–243.
- Schjeide OA, Schjeide S, Briles WE. 1983. Changes in expressions of red blood cell antigens following gamma irradiation of chicken embryos. Cytobios. 36(143–144):187–196.
- Templin T, Amundson SA, Brenner DJ, Smilenov LB. 2011. Whole mouse blood microRNA as biomarkers for exposure to -rays and 56Fe ions. Int J Radiat Biol. 87(7):653–662.
- Wasserman J, Blomgren H, Petrini B, Baral E, Strender LE, Jarstrand C, von Stedingk LV. 1982. Effect of radiation therapy and in vitro X-ray exposure on lymphocyte subpopulations and their functions. Am J Clin Oncol Cancer Clin Trials. 5(2):195–208.
- Xu D, Peng M, Zhang Z, Dong G, Zhang Y, Yu H. 2012. Study of damage to red blood cells exposed to different doses of γ-ray irradiation. Blood Transfus. 10(3):321–330.