
Abstract
Purpose
A vast amount of data regarding the effects of radiation stressors on transcriptional changes has been produced over the past few decades. These data have shown remarkable consistency across platforms and experimental design, enabling increased understanding of early molecular effects of radiation exposure. However, the value of transcriptomic data in the context of risk assessment is not clear and represents a gap that is worthy of further consideration. Recently, benchmark dose (BMD) modeling has shown promise in correlating a transcriptional point of departure (POD) to that derived using phenotypic outcomes relevant to human health risk assessment. Although frequently applied in chemical toxicity evaluation, our group has recently demonstrated application within the field of radiation research. This approach allows the possibility to quantitatively compare radiation-induced gene and pathway alterations across various datasets using BMD values and derive meaningful biological effects. However, before BMD modeling can confidently be used, an understanding of the impact of confounding variables on BMD outputs is needed.
Methods
To this end, BMD modeling was applied to a publicly available microarray dataset (Gene Expression Omnibus #GSE23515) that used peripheral blood ex-vivo gamma-irradiated at 0.82 Gy/min, at doses of 0, 0.1, 0.5 or 2 Gy, and assessed 6 hours post-exposure. The dataset comprised six female smokers (F-S), six female nonsmokers (F-NS), six male smokers (M-S), and six male nonsmokers (M-NS).
Results
A combined total of 412 genes were fit to models and the BMD distribution was noted to be bi-modal across the four groups. A total of 74, 41, 62 and 62 genes were unique to the F-NS, M-NS, F-S and M-S groups. Sixty-two BMD modeled genes and nine pathways were common across all four groups. There were no differential sensitivity of BMD responses in the robust common genes and pathways.
Conclusion
For radiation-responsive genes and pathways common across the study groups, the BMD distribution of transcriptional activity was unaltered by sex and smoking status. Although further validation of the data is needed, these initial findings suggest BMD values for radiation relevant genes and pathways are robust and could be explored further in future studies.
Introduction
The growing availability of omics data and the emergence of novel methods for analysis thereof has led to the identification of relevant earlier molecular changes that predict downstream overt biological effects (Aardema and MacGregor Citation2002; Collins et al. Citation2003; Borgert Citation2007; Kyrtopoulos Citation2013; National Toxicology Program Citation2018). This has provided avenues to use these high-throughput and data-rich approaches to better understand the risks of external stressors to human health. However, the translation of this knowledge to support regulatory decision-making remains unexplored. These types of new approaches could help decrease the uncertainties in health risks from low dose and low dose-rate exposures, which is of growing interest to the radiation field (Laurier et al. Citation2021). Recently, in the chemical field, omics data have shown value for hazard identification and translating transcriptional responses to meaningful health outcomes (Yang et al. Citation2007; Chepelev et al. Citation2015; Buesen et al. Citation2017; Phillips et al. Citation2019). One approach that has emerged to support this type of analysis is benchmark dose (BMD) modeling.
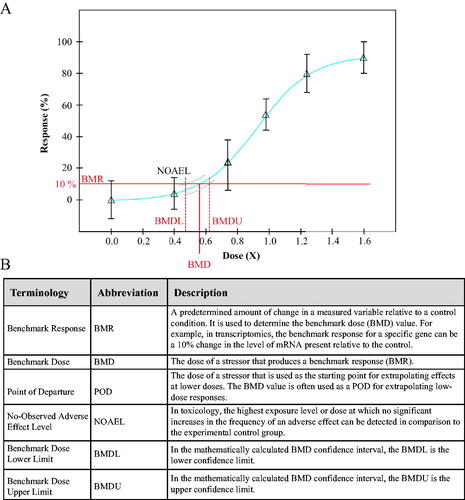
BMD modeling bypasses challenges of the traditional toxicological assessments that use the No-Observed Adverse Effect Level (NOAEL) methodology to determine a point of departure (POD) for chemical risk assessment (Haber et al. Citation2018). In this approach, a series of mathematical models are applied to the experimental dose-response relationship and statistically validated. The model that most accurately fits the data of the dose-response curve is chosen and used to determine the benchmark dose (BMD) (United States Environmental Protection Agency Citation2012). This BMD value is the extrapolated or interpolated dose at which a pre-determined benchmark response (BMR) occurs. With the BMD modeling approach, a POD can be identified using any chosen endpoint and correlated to the NOAEL. Typically, the BMR is defined as a 10% or one standard deviation change in an effect in comparison to the control group. By using stringent mathematical modeling, the BMD value is the dose of a stressor at which a pre-determined change in an endpoint occurs ().
Figure 1. (A) Representative dose-response curve used in determining a NOAEL or BMD value following exposure to a stressor. The blue line indicates the fitted curve, while the grey dashed lines indicates the 95% confidence interval of the fit (BMDL/U). For more information. see Benchmark Dose Technical Guidance Document (US EPA, Citation2012). (B) Definitions of abbreviations commonly used in reference to BMD modeling.
While this method has previously been applied to traditional endpoints, BMD modeling is now being used as an effective approach for large datasets generated from omics-based studies, and one that is more precise, simpler, and more adaptable to inter-dataset comparisons (Filipsson et al. Citation2003; Sand et al. Citation2008; Davis et al. Citation2011). In chemical risk assessments, while the approach is still exploratory, BMD modeling is being proposed as a methodology to determine a benchmark dose of response for individual genes as well as biochemical pathways and gene ontologies, underscoring its molecular utility in identifying pathways and genes relevant to the particular exposure scenario being studied (Bourdon et al. Citation2013; Thomas et al. Citation2013; Clewell et al. Citation2014; Labib et al. Citation2016; Harrill et al. Citation2019; Gwinn et al. Citation2020; Krewski et al. Citation2020).
Given the growing support for the use of transcriptomic BMD modeling in chemical toxicity assessment, in recent years a number of studies from our group have investigated its utility specifically for radiation-relevant datasets, with the ultimate vision of supporting radiation risk assessment. In this context, the approach has been tested for reproducibility and the ability to generate meaningful results across a range of experimental conditions and radiation doses (Chauhan et al. Citation2016). This work has highlighted the ability to identify a benchmark dose of pathway and gene activation in radiation-exposed human lens epithelial cells (Chauhan et al. Citation2019) and keratinocytes (Qutob et al. Citation2018). Studies demonstrate a high correlation of transcriptomic benchmark doses with those based on phenotypic changes that have been derived using human data (Qutob et al. Citation2018). Furthermore, the reproducibility of BMD modeling across studies with similar experimental setups and dose-ranges show that the approach is robust and consistent, supporting its reliability for use in risk assessment (Chauhan et al. Citation2021).
These initial studies have also highlighted the value of BMD modeling in comparing quantitative transcriptional differences in pathway and gene activation in the context of radiation quality, whereby an alpha particle exposure exhibits lower BMDs for radiation-induced pathways than a photon exposure (Chauhan et al. Citation2016). Moreover, the approach has shown that BMD distributions for radiation stressors can induce bi-modal pathway activation, whereby BMD pathways responding at high vs. low dose values can be identified that correlate with expected mechanisms of radiation-induced injury (Chauhan et al. Citation2016). Specifically, lower BMD values correlated well with DNA damage/repair pathways and higher BMD values were associated with pathways of immune response, cell death and cancer induction (Chauhan et al. Citation2016, Citation2021).
Another area of interest is understanding the impact of confounding factors on gene and pathway BMDs, specifically smoking and sex. In previous studies, both these variables were found to impact transcriptional profiles (Beane et al. Citation2007; Chari et al. Citation2007; Harvey et al. Citation2007; Lodovici et al. Citation2007; Landi et al. Citation2008; Boelens et al. Citation2009). The objective of the present study is to examine whether BMD values are influenced by sex and smoking status, in the context of known radiation-induced genes and pathways, using a relevant publicly available data set.
Methods
Datasets
A transcriptional response dataset (Paul and Amundson Citation2011) was downloaded from GEO (www.ncbi.nlm.nih.gov/geo). It consisted of transcriptional data from 24 human participants’ blood exposed at a dose rate of 0.82 Gy/min to 0, 0.1, 0.5, or 2 Gy γ-rays using a Gammacell-40 137Cs irradiator (Atomic Energy of Canada, Limited, Ottawa, Ontario, Canada) and analyzed for transcriptional changes 6 hours post-exposure. Gene expression data (Gene Expression Omnibus #GSE23515) from these participants was separated into four study groups each consisting of 6 participants as follows: female smokers (F-S), male smokers (M-S), female nonsmokers (F-NS), and male nonsmokers (M-NS) and subjected to BMD analysis.
BMD modeling
BMD modeling was performed as previously described (Chauhan et al. Citation2021) using BMDExpress software version 2.30 (Phillips et al. Citation2019). For additional information BMD videos can be found on the following websites: https://www.epa.gov/bmds and https://www.sciome.com/bmdexpress. Briefly, microarray data were pre-filtered using a Williams’ Trend Test with a p-value cutoff of < .05 and a linear fold change of ≥ 1.5. All probes meeting these criteria were subjected to BMD modeling with nine different continuous models (Hill, Power, Linear, Polynomial 2, Polynomial 3, Exponential 2, Exponential 3, Exponential 4, Exponential 5), with a BMR factor of 1.349 (approximating a 10% change). Filtering criteria to identify gene BMDs included: BMD ≤ highest dose, best fit P Value ≥ .1, BMDU/BMDL ≤ 40, BMDU/BMD ≤ 20, and BMD/BMDL ≤ 20 (where BMDL and BMDU are the lower and upper 95% confidence intervals of the BMD, respectively). All genes passing these filtering criteria were carried forward to Defined Category Analysis using the Reactome pathway database (downloaded on December 18, 2018; https://reactome.org/). Post-modeling parameters identifying responding pathways were: genes that passed all filters ≥ 3, and percentage of pathway ≥ 5. Pathway BMDs are represented as the median of the gene BMDs from the pathway gene set.
Data visualization
Data was visualized in the RStudio Version 1.4.1106 (http://www.rstudio.com/) statistical environment, with the packages ggplot2, dplyr, and pheatmap. These packages were used to generate bar graphs showing model type distributions, paneled histograms of gene BMD values, accumulation plots for both genes and pathways, paneled line graphs showing the full BMD intervals (BMDL, BMD, and BMDU), and heatmaps with dendrograms for all four study groups.
Results
Gene BMD outputs
Microarray datasets derived from blood samples exposed to various doses of radiation across four study groups (M-S, M-NS, F-S, and F-NS) were subjected to BMD analysis. Following data filtering, the generated outputs included information on the best-fit dose-response model for each gene, the number of genes modeled, and the BMD values and distributions for genes and pathways. Radiation-responsive gene and pathway BMD outputs were compared across the study groups, with the intent to examine the consistency in the BMDs.
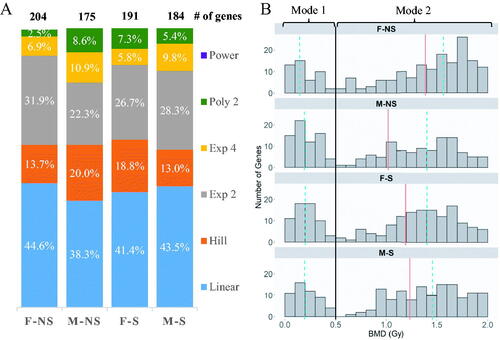
The combined analysis of the four groups showed a total of 412 genes modeled (Table S1). The range of BMD values across these genes was from 0.012 to 2.0 Gy, with a median of 1.2 Gy. Across the four groups, the dose-responses were fit to six of the nine mathematical models: linear, Hill, exponential 2, exponential 4, polynomial 2 and power. The proportion of genes fitting these mathematical models was similar across all four groups (), with the linear model fitting the highest percentage of genes in every group. There was minimal difference in the total number of genes modeled across the four groups: for nonsmokers 204 and 173 genes, while for the smokers 191 and 184 genes, were included in the models from the female and male groups respectively (). The BMD distribution of the genes was bi-modal in nature across all four groups (), with the first mode spanning 0–0.5 Gy and the second mode spanning 0.5–2.0 Gy. The composition of genes in mode 1 (0–0.5 Gy) was similar across the study groups, where 29 genes overlap in all groups. However, majority of the unique transcripts (i.e. those identified only in one group) were found in mode 2 (Table S1). Common mode 1 genes had similar BMD values across the four groups.
Figure 2. (A) The proportion of mathematical models used in the modeling of genes from irradiated cells of each group of participants. Female (F) and male (M) are the sexes of the participants, and nonsmoking (NS) and smoking (S) denote their smoking status. (B) Histogram of the distribution of genes in the four study groups based on best BMD values. The black line (–) separates genes between the two modes at 0.5 Gy. The red line (–) indicates the overall median BMD of each group, while dashed-blue line (--) indicates the median for the respective mode.
A comparative visualization of the BMD gene responses across the confounding groups using an upset plot highlighted distinct sets of genes in each of the study groups. A total of 74 (F-NS), 41 (M-NS), 62 (F-S) and 62 (M-S) genes were unique to each the four study groups (, far right columns). A smaller proportion of genes overlapped two or three comparison groups. There were 62 common genes modeled in all four study groups of which 62% had BMD values less than 0.5 Gy (), which associated with mode 1 of the gene distribution plot in .
Figure 3. (A) Upset plot of the genes from the irradiated white blood cells that were successfully modeled by BMD analysis. The set size refer to the total number of genes per group. (B) Hierarchical cluster analysis of the 62 genes modeled by BMD methodology across the four study groups. The color scale corresponds to the BMD values (in Gy) of the genes.
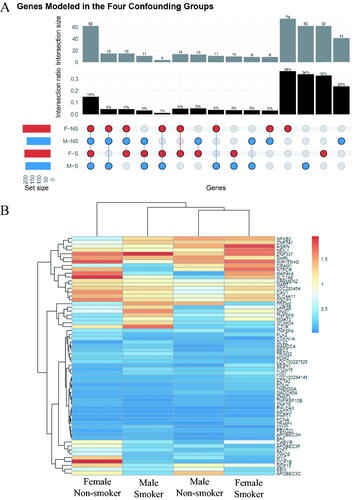
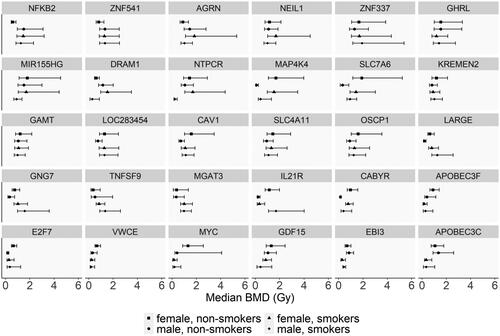
Hierarchical cluster analysis of the 62 common genes revealed largely similar BMD profiles across the four confounding groups, with no defined clustering based on smoking or sex (). Many genes that were common in all four groups displayed very similar BMD values. Differences in gene BMD values among the groups were observed, but when the BMD confidence intervals (BMDL and BMDU) were plotted, the ranges for most of these genes overlapped (, not all genes plotted).
Figure 4. BMD values of selected genes successfully modeled across the four study groups. The selected genes in this figure are the clusters of genes where differences among the groups that may be observed in . The error bars indicate the lower BMD (BMDL) and upper BMD (BMDU) values in Gy, indicating the 95% confidence interval of the gene.
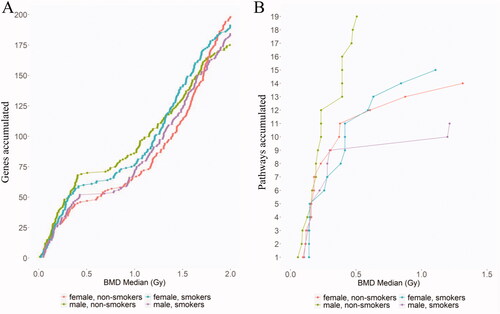
Finally, the shapes of the gene accumulation plots were examined for all of the genes across the four study groups (). In these accumulation plots, the relationship between the number of genes modeled and the corresponding BMD value appear to show a similar trend for all groups. The curves overlapped for the first 50 genes of each group, with most of the genes showing lower BMD values, which were associated with the first mode of the BMD distribution plot.
Figure 5. Accumulation plot showing the number of (A) genes and (B) pathways modeled from the lowest to the highest BMD for each of the study groups.
Pathway BMD outputs
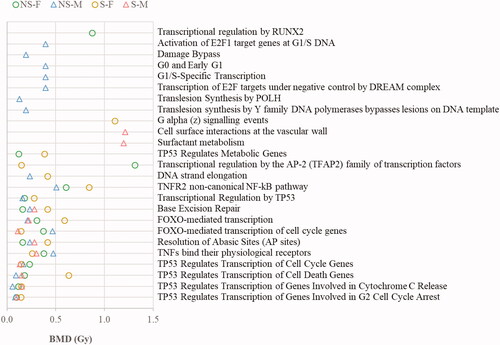
The 412 genes modeled by BMD across all groups were associated with a total of 25 pathways. An accumulation plot of the total pathways and their associated BMD median values show that the M-NS curve had a unique profile in comparison to the other three groups, where more pathways fit models at lower BMD values (, green curve). There were 14 (F-NS) and 19 (M-NS) pathway BMDs derived for the nonsmoker groups, and 15 (F-S) and 11 (M-S) pathways for the smoker groups ( and , and Table S2). A total of one (F-NS), seven (M-NS), one (F-S), and two (M-S) unique pathway(s) were identified for each of the groups. However, the majority of these unique pathways displayed broad confidence intervals (Figure S1). Three pathways with narrow confidence intervals included: “Damage Bypass,” “Translesion Synthesis of POLH” and “Translesion Synthesis by Y family DNA polymerases bypasses lesions on DNA template,” which were modeled only in the male nonsmoker group. Nine of the 25 pathways (36%) were common to all four groups ( and and Table S2), and an additional 20% were common to at least two groups. Hierarchical cluster analysis of the BMDs of the nine common pathways shows some small differences between males and females as well as smokers and nonsmokers (); however, pathway BMDL to BMDU plots for each pathway were largely overlapping (Figure S1).
Figure 6. (A) Upset plot of the responsive pathways with BMDs. F and M are the sex of the participants, and their smoking status are either nonsmoker (NS) or smoker (S). The set size refer to the total number of pathways per group. (B) Hierarchical cluster analysis of the common pathways fitting BMD models across four confounding groups. The color scale corresponds to the BMD values (in Gy) of the pathways. F and M are the sex of the participants, and their smoking status are either nonsmoker (NS) and smoker (S).
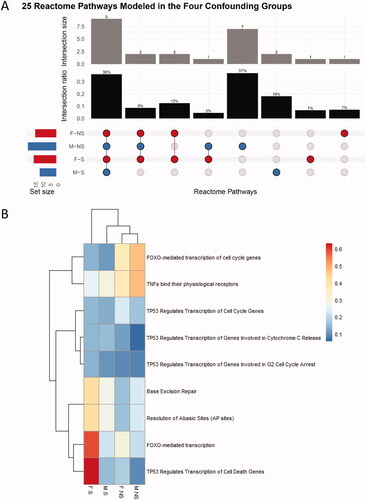
Figure 7. Median BMD values of the pathways successfully modeled across the four study groups. M are the sex of the participants, and their smoking status are either nonsmoker (NS) or smoker (S). The number of pathways modeled for each confounding group is 14 (F-NS), 19 (M-NS),15 (F-S) and 11 (M-S).
Discussion
BMD modeling has emerged as an effective tool for analyzing transcriptional dose-response data to identify a dose at which a defined change in gene expression occurs (Thomas et al. Citation2013; Jackson et al. Citation2014; Chepelev et al. Citation2015; Webster et al. Citation2015; Farmahin et al. Citation2017; National Toxicology Program Citation2018; Ramaiahgari et al. Citation2019). Previous work from our laboratory has shown this approach to be reliable and reproducible when analyzing radiation datasets (Chauhan et al. Citation2021). However, the impact of confounding factors on BMD values were not examined. This was of interest since studies have shown that sex and smoking can impact transcriptional responses (Pogribny et al. Citation2004; Beane et al. Citation2007; Chari et al. Citation2007; Harvey et al. Citation2007; Lodovici et al. Citation2007; Ilnytskyy et al. Citation2008; Landi et al. Citation2008; Meadows et al. Citation2008; Boelens et al. Citation2009; Paul and Amundson Citation2011).
To address this question, a focused analysis of a dataset with available information on smoking status and sex was undertaken. This dataset consisted of 24 healthy human volunteers, whose cells were exposed ex vivo to a broad dose-range of gamma radiation (Paul and Amundson Citation2011). The dataset was separated into four confounding groups based on sex (male/female) and smoking status (smoker/nonsmoker). The microarray data were subjected to BMD analysis with the goal of understanding the impact of these confounders on BMD outputs, including the identities of the genes modeled and their associated gene/pathway BMD values. BMD analysis modeled a total of 412 genes that were responsive to gamma radiation across four groups of study. Among these genes, 128 were common to the original study (Paul and Amundson Citation2011). The types of models as well as the relative distribution of the models were consistent across the four study groups. All groups exhibited highly similar bi-modal gene BMD frequency distributions; i.e. there were two distinct peaks of gene BMDs – genes with lower BMD values (≤ 0.5 Gy) and those with higher values (> 0.5 Gy). The composition of genes was highly correlated for mode 1 across the four study groups; the majority of the unique responses were noted in mode 2. This bi-modal response is consistent with our previous findings demonstrating that a subset of genes are activated at low BMD values (i.e. < 0.5 Gy), while others are initiated at higher BMD values (Qutob et al. Citation2018; Chauhan et al. Citation2019).
Among the total genes that were modeled, unique transcripts were identified for each study group (F-NS = 74, M-NS = 41, F-S = 62 and M-S = 62) and 62 common genes were identified to all four confounding groups. Of these 62 common genes, 33 transcripts were previously identified to be part of a signature that is capable of determining the radiation dose received by a patient (Paul and Amundson Citation2008). A follow-on study from this same research group used a more heterogeneous population of volunteers of varied smoking status and sex grouped as one cohort (Paul and Amundson Citation2011) and identified 253 genes whose expression was altered by exposure to gamma radiation across all four radiation doses in the applied dose range of 0–2.0 Gy. In fact, this list of 253 genes had substantial overlap with that of the present study; 49 out of 62 (79%) of our common genes are in this larger Paul and Amundson (Citation2011) list, with their BMD values ranging from 0.03 to 1.95 Gy (Table S1). Interestingly, only 8.8% of all the unique genes identified overlap with the original study, while 79% of the common genes overlap with the original study (Paul and Amundson Citation2011). Therefore, these common genes became the focus of further discussion. Hierarchical cluster analysis of the common genes revealed a subset of genes with highly consistent BMD values across the four groups; these included the typical radiation-responsive genes CDKN1A, GADD45A, and BAX. This highlights that the BMD modeling approach identifies similar transcriptional alterations to more conventional gene expression analysis approaches, but provides valuable additional information to inform gene and pathway dose thresholds.
In the Paul and Amundson (Citation2011) study from which the transcriptional data being studied originates, 8 genes were identified that had altered expression between the smokers and nonsmokers, with only one transcript, FHL2, having been previously identified in the list of 289 radiation-responsive genes. FHL2 displayed a different dose-response relationship in smokers vs. nonsmokers (Paul and Amundson Citation2011). In the present study, the BMD value of FHL2 in female nonsmokers was higher (1.59 Gy) than in female smokers (0.30 Gy) (Table S1). The lower BMD value in female smokers suggests that this gene is activated at lower doses of gamma radiation in individuals who have previously been exposed to smoking particulate matter. Studies have shown that FHL2 expression is increased in disease states (Alnajar et al. Citation2013) and it may also be implicated in the radioresistance of pancreatic cancer cells (Scholl et al. Citation2000) and cell cycle dysregulation following regenerative stress in hematopoietic stem cells (Hou et al. Citation2015). Of note, FHL2 could not be modeled in male nonsmokers (Table S1). Specifically, it did not meet the filtering criteria of the Williams’ trend test (p-value < .05 and fold change > 1.5) filtering criterion due to the extreme variability in response between the individuals. This gene may thus warrant further focused studies to determine its status as a biomarker of radiation response in both males and females.
In examining sex-related differences in BMD values in ex-vivo irradiated samples, hierarchical clustering did not cluster the groups based on sex or smoking status. Previous work on the same dataset by Paul and Amundson (Citation2011) identified fourteen genes that were modulated by radiation. These genes exhibited sex-related differences according to microarray data, but more targeted quantitative RT-PCR analysis of these genes did not support these modulations. In the present study, of these fourteen genes, only three were successfully modeled by BMD analysis in one or more of the confounding groups. Thus, the BMD approach was effective in reducing noise to identify robust radiation-responsive genes. In particular, two of these three genes (CACNA2D3 and M54A6A) were only modeled in the two male groups, while modeling was unsuccessful in females. The third gene, APOBEC3H, was successfully modeled across all four groups but showed no differences in BMD values (Table S1). Overall, the consistency in BMD values across the 62 common genes underscores that gene activation for this robust set of radiation-responsive genes is not impacted by sex. Interestingly, the hierarchical cluster analysis did highlight some genes that were common across the groups with varied BMD values across the sex groups. However, in examining the 95% confidence intervals side-by-side (), many of these differences were not significant, emphasizing the reproducibility of the responses. Although sex-related differences in BMD-derived gene responses were not observed for common radiation responsive genes, it was noted that some unique genes to each study group could be further validated using a larger cohort. Particularly, as some studies have reported sex-related differences in radiation sensitivity in occupational workers and those exposed accidently (Narendran et al. Citation2019) and sex-specific changes in gene expression in animal models (López-Nieva et al. Citation2016).
Given the dynamic nature of gene expression and the complexity of the resulting datasets, pathway analyses are generally preferred over analyses of individual genes (Khatri et al. Citation2012). As expected, there was a much higher degree of overlap at the pathway level than observed with individual genes, with nine of the 25 pathways common to all four groups. These pathways are typically associated with radiation response, including those related to TP53 regulation of cell cycling and FOXO-mediated transcription. These pathways had BMD median values that were consistent across the four groups (< 0.65 Gy) and could support strategies for developing risk models.
It was noted that the male nonsmoking (M-NS) group had some unique pathways with much lower BMD values relative to the other three groups, leading to a visually distinct shape in the pathway accumulation plot for this group (, green curve). However, this difference may not be a true biological effect but rather an artifact of inefficiently modeled genes that did not pass the minimal pathway filtering criteria in the other three groups. For this reason, our study focused on common robust pathways and genes across the four groups and not unique pathways to any one group. To improve confidence in the understanding of unique responses, future studies could explore this further in a larger cohort of individuals and across a broad dose-range, which would improve BMD modeling outputs.
It should be noted that this study has a number of limitations. Firstly, the dataset selected for the analysis had a small cohort, as each study group consisted of only six individuals. In order to fully evaluate the effects of biological sex and smoking status, a much larger cohort of subjects would improve reliability of BMD outputs. Furthermore, increasing the cohort size would enable the groups to be stratified even further based on other possible confounding variables, including age, ethnicity, health status and various other lifestyle factors. Indeed, each group used in this study included individuals spanning a wide range of ages, which may have contributed to a lack of statistical power in generating dose-response curves that met all the filtering criteria. Lastly, it is important to note that this study used gene expression data from only one post-exposure time point. The biological response to radiation exposure is highly time-dependent, and it would thus be beneficial to explore across a range of time points (e.g. 6, 12, 24, 36 and 72 hr, etc.).
In conclusion, this preliminary analysis has highlighted the reproducibility and specificity of BMD values for radiation responsive genes derived from ex-vivo irradiated white blood cells. Across the four study groups, a robust set of responding genes and pathways that are typical radiation-responsive genes had highly similar BMD values that were not influenced by sex or smoking status. This level of consistency in the transcriptionally derived benchmark doses provides confidence in exploring this approach further in areas of radiation research, possibly for use in understanding tissue/organ sensitivities, personalized dose assessment in medicine and extrapolating dose thresholds for adverse effects. However, further work in this area would be beneficial using a larger cohort of individuals and using varied radiation parameters of dose range, dose-rate and radiation quality. Other factors can also be explored such as smoking frequency, smoking duration (number of years), age, ethnicity, and health status. Future endeavors will evaluate this through experimental work alongside examining the correlation of transcriptional BMDs with phenotypic endpoints for use in radiation risk assessment.
Supplemental_Tables_All_revision2_2022_07_21.xlsx
Download MS Excel (53 KB)Supplemental_Figures_v1.pptx
Download MS Power Point (230.3 KB)Acknowledgments
The authors would like to acknowledge Drs. Katya Feder and Robert Stainforth for insightful comments and edits to the manuscript. This work was funded by the Genomics Research and Development Initiative. CLY acknowledges support from the Canada Research Chairs Program.
Disclosure statement
The authors declare they have no competing interests.
Additional information
Notes on contributors
Nadine Adam
Nadine J. Adam, M.Sc., is a Laboratory Biologist at Health Canada, and she previously worked with the Consumer and Clinical Radiation Protection Bureau. She completed her M.Sc. studies in Biochemistry at the University of Ottawa.
Ngoc Q. Vuong
Ngoc Q. Vuong, Ph.D, is a Senior Technician at the Radiation Protection Bureau (RPB) of Health Canada. He graduated from the University of Ottawa with a Ph.D degree in Biochemistry (specialized in environmental toxicology). He joined the RPB in 2018, and he supports projects in both the RPB and the Consumer and Clinical Radiation Protection Bureau.
Hailey Adams
Hailey Adams, B.Sc., is a Laboratory Biologist at Health Canada, and she previously worked with the Consumer and Clinical Radiation Protection Bureau. She completed B.Sc. studies in Biology and Biotechnology at Carleton University.
Byron Kuo
Byron Kuo, M.Sc., is a Computational Biologist at Health Canada.
Afshin Beheshti
Afshin Beheshti, Ph.D., is a Principal Investigator and Bioinformatician at KBR at NASA Ames Research Center, a Visiting Researcher at Broad Institute of MIT and Harvard, and President of a nonprofit formed on March 2020 working on COVID-19 called COVID-19 International Research Team (COV-IRT, www.cov-irt.org). His research interests include applying systems biology approaches to a broad range of topics which include: mitochondria, noncoding RNAs/miRNAs, radiation biology, space biology, cancer, COVID-19, and cardiovascular disease.
Carole Yauk
Carole Yauk, Ph.D., is a Professor in the Department of Biology, University of Ottawa, where she holds the Canada Research Chair in Genomics and the Environment. Dr. Yauk serves as a Canadian delegate to the OECD's Extended Advisory Group on Molecular Screening and Toxicogenomics. Within this group, she contributed to the development of the AOP Users' Handbook and is an AOP developer and reviewer.
Ruth Wilkins
Ruth C. Wilkins, Ph.D, is a Research Scientist at the Consumer and Clinical Radiation Protection Bureau of Health Canada and the Chief of the Ionizing Radiation Health Sciences Division. She graduated with a Ph.D in Medical Physics from Carleton University and has been employed at Health Canada for the past 25 years. She is an Adjunct Professor and lecturer in Radiobiology in the Department of Physics at Carleton University and the alternative representative of Canada to the United Nations Scientific Committee on the Effects of Atomic Radiation (UNSCEAR).
Vinita Chauhan
Vinita Chauhan, Ph.D, is a Senior Research Scientist at the Consumer and Clinical Radiation Protection Bureau of Health Canada. She is a Canadian delegate of the HLG-LDR and Extended Advisory Group on Molecular Screening and Toxicogenomics (EAGMST) of the OECD. She chairs the HLG-LDR Rad/Chem AOP Joint Topical Group and is the co-founder of Canadian Organization of Health Effects from Radiation Exposure (COHERE) initiative.
Related Research Data
References
- Aardema MJ, MacGregor JT. 2002. Toxicology and genetic toxicology in the new era of “toxicogenomics”: impact of “-omics” technologies. Mutat Res. 499(1):13–25.
- Alnajar A, Nordhoff C, Schied T, Chiquet-Ehrismann R, Loser K, Vogl T, Ludwig S, Wixler V. 2013. The LIM-only protein FHL2 attenuates lung inflammation during bleomycin-induced fibrosis. PLOS One. 8(11):e81356.
- Beane J, Sebastiani P, Liu G, Brody JS, Lenburg ME, Spira A. 2007. Reversible and permanent effects of tobacco smoke exposure on airway epithelial gene expression. Genome Biol. 8(9):R201.
- Boelens MC, Van Den Berg A, Fehrmann RSN, Geerlings M, De Jong WK, Te Meerman GJ, Sietsma H, Timens W, Postma DS, Groen HJM. 2009. Current smoking-specific gene expression signature in normal bronchial epithelium is enhanced in squamous cell lung cancer. J Pathol. 218(2):182–191.
- Borgert CJ. 2007. Predicting interactions from mechanistic information: can omic data validate theories? Toxicol Appl Pharmacol. 223(2):114–120.
- Bourdon JA, Williams A, Kuo B, Moffat I, White PA, Halappanavar S, Vogel U, Wallin H, Yauk CL. 2013. Gene expression profiling to identify potentially relevant disease outcomes and support human health risk assessment for carbon black nanoparticle exposure. Toxicology. 303:83–93.
- Buesen R, Chorley BN, da Silva Lima B, Daston G, Deferme L, Ebbels T, Gant TW, Goetz A, Greally J, Gribaldo L, et al. 2017. Applying ’omics technologies in chemicals risk assessment: report of an ECETOC workshop. Regul Toxicol Pharmacol. 91(Suppl 1):S3–S13.
- Chari R, Lonergan KM, Ng RT, MacAulay C, Lam WL, Lam S. 2007. Effect of active smoking on the human bronchial epithelium transcriptome. BMC Genomics. 8:297.
- Chauhan V, Adam N, Kuo B, Williams A, Yauk CL, Wilkins R, Stainforth R. 2021. Meta-analysis of transcriptomic datasets using benchmark dose modeling shows value in supporting radiation risk assessment. Int J Radiat Biol. 97(1):31–49.
- Chauhan V, Kuo B, McNamee JP, Wilkins RC, Yauk CL. 2016. Transcriptional benchmark dose modeling: Exploring how advances in chemical risk assessment may be applied to the radiation field. Environ Mol Mutagen. 57(8):589–604.
- Chauhan V, Rowan-Carroll A, Gagné R, Kuo B, Williams A, Yauk CL. 2019. The use of in vitro transcriptional data to identify thresholds of effects in a human lens epithelial cell-line exposed to ionizing radiation. Int J Radiat Biol. 95(2):156–169.
- Chepelev NL, Moffat ID, Labib S, Bourdon-Lacombe J, Kuo B, Buick JK, Lemieux F, Malik AI, Halappanavar S, Williams A, et al. 2015. Integrating toxicogenomics into human health risk assessment: lessons learned from the benzo[a]pyrene case study. Crit Rev Toxicol. 45(1):44–52.
- Clewell HJ, Efremenko A, Campbell JL, Dodd DE, Thomas RS. 2014. Transcriptional responses in the rat nasal epithelium following subchronic inhalation of naphthalene vapor. Toxicol Appl Pharmacol. 280(1):78–85.
- Collins FS, Green ED, Guttmacher AE, Guyer MS. 2003. A vision for the future of genomics research. Nature. 422(6934):835–847.
- Davis JA, Gift JS, Zhao QJ. 2011. Introduction to benchmark dose methods and U.S. EPA’s benchmark dose software (BMDS) version 2.1.1. Toxicol Appl Pharmacol. 254(2):181–191.
- Farmahin R, Williams A, Kuo B, Chepelev NL, Thomas RS, Barton-Maclaren TS, Curran IH, Nong A, Wade MG, Yauk CL. 2017. Recommended approaches in the application of toxicogenomics to derive points of departure for chemical risk assessment. Arch Toxicol. 91(5):2045–2065.
- Filipsson AF, Sand S, Nilsson J, Victorin K. 2003. The benchmark dose method – review of available models, and recommendations for application in health risk assessment. Crit Rev Toxicol. 33(5):505–542.
- Gwinn WM, Auerbach SS, Parham F, Stout MD, Waidyanatha S, Mutlu E, Collins B, Paules RS, Merrick BA, Ferguson S, et al. 2020. Evaluation of 5-day in vivo rat liver and kidney with high-throughput transcriptomics for estimating benchmark doses of apical outcomes. Toxicol Sci. 176(2):343–354.
- Haber LT, Dourson ML, Allen BC, Hertzberg RC, Parker A, Vincent MJ, Maier A, Boobis AR. 2018. Benchmark dose (BMD) modeling: current practice, issues, and challenges. Crit Rev Toxicol. 48(5):387–415.
- Harrill J, Shah I, Setzer RW, Haggard D, Auerbach S, Judson R, Thomas RS. 2019. Considerations for strategic use of high-throughput transcriptomics chemical screening data in regulatory decisions. Curr Opin Toxicol. 15:64–75.
- Harvey BG, Heguy A, Leopold PL, Carolan BJ, Ferris B, Crystal RG. 2007. Modification of gene expression of the small airway epithelium in response to cigarette smoking. J Mol Med. 85(1):39–53.
- Hou Y, Wang X, Li L, Fan R, Chen J, Zhu T, Li W, Jiang Y, Mittal N, Wu W, et al. 2015. FHL2 regulates hematopoietic stem cell functions under stress conditions. Leukemia. 29(3):615–624.
- Ilnytskyy Y, Zemp FJ, Koturbash I, Kovalchuk O. 2008. Altered microRNA expression patterns in irradiated hematopoietic tissues suggest a sex-specific protective mechanism. Biochem Biophys Res Commun. 377(1):41–45.
- Jackson AF, Williams A, Recio L, Waters MD, Lambert IB, Yauk CL. 2014. Case study on the utility of hepatic global gene expression profiling in the risk assessment of the carcinogen furan. Toxicol Appl Pharmacol. 274(1):63–77.
- Khatri P, Sirota M, Butte AJ. 2012. Ten years of pathway analysis: current approaches and outstanding challenges. PLOS Comput Biol. 8(2):e1002375.
- Krewski D, Andersen ME, Tyshenko MG, Krishnan K, Hartung T, Boekelheide K, Wambaugh JF, Jones D, Whelan M, Thomas R, et al. 2020. Toxicity testing in the 21st century: progress in the past decade and future perspectives. Arch Toxicol. 94(1):1–58.
- Kyrtopoulos SA. 2013. Making sense of OMICS data in population-based environmental health studies. Environ Mol Mutagen. 54(7):468–479.
- Labib S, Williams A, Yauk CL, Nikota JK, Wallin H, Vogel U, Halappanavar S. 2016. Nano-risk Science: Application of toxicogenomics in an adverse outcome pathway framework for risk assessment of multi-walled carbon nanotubes. Part Fibre Toxicol. 13:15.
- Landi MT, Dracheva T, Rotunno M, Figueroa JD, Liu H, Dasgupta A, Mann FE, Fukuoka J, Hames M, Bergen AW, et al. 2008. Gene expression signature of cigarette smoking and its role in lung adenocarcinoma development and survival. PLOS One. 3(2):e1651.
- Laurier D, Rühm W, Paquet F, Applegate K, Cool D, Clement C. 2021. Areas of research to support the system of radiological protection. Radiat Environ Biophys. 60(4):519–530.
- Lodovici M, Luceri C, De Filippo C, Romualdi C, Bambi F, Dolara P. 2007. Smokers and passive smokers gene expression profiles: correlation with the DNA oxidation damage. Free Radic Biol Med. 43(3):415–422.
- López-Nieva P, Malavé M, González-Sánchez L, Fernández-Piqueras J, Fernández-Navarro P, Santos J. 2016. Transcriptomic analysis reveals sex-specific differences in the expression of Dcl1 and Fis1 genes in the radio-adaptive response of thymocytes to TRP53-mediated apoptosis. BMC Genomics. 17(1):12.
- Meadows SK, Dressman HK, Muramoto GG, Himburg H, Salter A, Wei Z, Ginsburg GS, Ginsburg G, Chao NJ, Nevins JR, et al. 2008. Gene expression signatures of radiation response are specific, durable and accurate in mice and humans. PLOS One. 3(4):e1912.
- Narendran N, Luzhna L, Kovalchuk O. 2019. Sex difference of radiation response in occupational and accidental exposure. Front Genet. 10(260):260.
- National Toxicology Program. 2018. NTP research report on national toxicology program approach to genomic dose-response modeling. In NTP research report on national toxicology program approach to genomic dose-response modeling: research report 5. National Toxicology Program. https://www.ncbi.nlm.nih.gov/books/NBK531562/.
- Paul S, Amundson SA. 2008. Development of gene expression signatures for practical radiation biodosimetry. Int J Radiat Oncol Biol Phys. 71(4):1236–1244.
- Paul S, Amundson SA. 2011. Gene expression signatures of radiation exposure in peripheral white blood cells of smokers and non-smokers. Int J Radiat Biol. 87(8):791–801.
- Phillips JR, Svoboda DL, Tandon A, Patel S, Sedykh A, Mav D, Kuo B, Yauk CL, Yang L, Thomas RS, et al. 2019. BMDExpress 2: enhanced transcriptomic dose-response analysis workflow. Bioinformatics. 35(10):1780–1782.
- Pogribny I, Raiche J, Slovack M, Kovalchuk O. 2004. Dose-dependence, sex- and tissue-specificity, and persistence of radiation-induced genomic DNA methylation changes. Biochem Biophys Res Commun. 320(4):1253–1261.
- Qutob SS, Chauhan V, Kuo B, Williams A, Yauk CL, McNamee JP, Gollapudi B. 2018. The application of transcriptional benchmark dose modeling for deriving thresholds of effects associated with solar-simulated ultraviolet radiation exposure. Environ Mol Mutagen. 59(6):502–515.
- Ramaiahgari SC, Auerbach SS, Saddler TO, Rice JR, Dunlap PE, Sipes NS, Devito MJ, Shah RR, Bushel PR, Merrick BA, et al. 2019. The power of resolution: contextualized understanding of biological responses to liver injury chemicals using high-throughput transcriptomics and benchmark concentration modeling. Toxicol Sci. 169(2):553–566.
- Sand S, Victorin K, Filipsson AF. 2008. The current state of knowledge on the use of the benchmark dose concept in risk assessment. J Appl Toxicol. 28(4):405–421.
- Scholl FA, McLoughlin P, Ehler E, De Giovanni C, Schäfer BW. 2000. DRAL is a p53-responsive gene whose four and a half LIM domain protein product induces apoptosis. J Cell Biol. 151(3):495–505.
- Thomas RS, Philbert MA, Auerbach SS, Wetmore BA, Devito MJ, Cote I, Rowlands JC, Whelan MP, Hays SM, Andersen ME, et al. 2013. Incorporating new technologies into toxicity testing and risk assessment: moving from 21st century vision to a data-driven framework. Toxicol Sci. 136(1):4–18.
- United States Environmental Protection Agency. 2012. Benchmark dose technical guidance. In (EPA/100/R-12/001) https://www.epa.gov/sites/default/files/2015-01/documents/benchmark_dose_guidance.pdf.
- Webster AF, Zumbo P, Fostel J, Gandara J, Hester SD, Recio L, Williams A, Wood CE, Yauk CL, Mason CE. 2015. Mining the archives: a cross-platform analysis of gene expression profiles in archival formalin-fixed paraffin-embedded tissues. Toxicol Sci. 148(2):460–472.
- Yang L, Allen BC, Thomas RS. 2007. BMDExpress: a software tool for the benchmark dose analyses of genomic data. BMC Genomics. 8(387):387–388.