
 ?Mathematical formulae have been encoded as MathML and are displayed in this HTML version using MathJax in order to improve their display. Uncheck the box to turn MathJax off. This feature requires Javascript. Click on a formula to zoom.
Abstract
Purpose
Development of an integrated time and dose model to explore the dynamics of gene expression alterations and identify biomarkers for biodosimetry following low- and high-dose irradiations at high dose rate.
Material and methods
We utilized multiple transcriptome datasets (GSE8917, GSE43151, and GSE23515) from Gene Expression Omnibus (GEO) for identifying candidate biological dosimeters. A linear mixed-effects model with random intercept was used to explore the dose-time dynamics of transcriptional responses and to functionally characterize the time- and dose-dependent changes in gene expression.
Results
We identified genes that are correlated with dose and time and discovered two clusters of genes that are either positively or negatively correlated with both dose and time based on the parameters of the model. Genes in these two clusters may have persistent transcriptional alterations. Twelve potential transcriptional markers for dosimetry—ARHGEF3, BAX, BBC3, CCDC109B, DCP1B, DDB2, F11R, GADD45A, GSS, PLK3, TNFRSF10B, and XPC were identified. Of these genes, BAX, GSS, and TNFRSF10B are positively associated with both dose and time course, have a persistent transcriptional response, and might be better biological dosimeters.
Conclusions
With the proposed approach, we may identify candidate biomarkers that change monotonically in relation to dose, have a persistent transcriptional response, and are reliable over a wide dose range.
1. Introduction
Human beings are exposed to ionizing radiation (IR) from various sources including the environment, medical diagnostics and treatment, industrial applications, and potential mass-casualty nuclear disasters (UNSCEAR, Citation2008). There are several types of IR, including α particles, β particles, positrons, neutron particles, X-rays, and γ-rays (Hill Citation2020). Exposure to IR may cause DNA damage, cell death, and alterations in DNA, RNA, and protein levels, which can lead to a higher risk of cancer and other diseases in the long term (Kamiya et al. Citation2015; Ozasa et al. Citation2019; Ghosh and Ghosh Citation2021; Nagane et al. Citation2021). To understand the biological effects of IR exposure, it is critical to explore the underlying molecular mechanisms and identify IR-related biomarkers (IAEA, Citation2010).
With advances in biotechnology, multi-omics data—including gene expression—have been produced at great speed and low cost, allowing us to more efficiently investigate the cellular responses and biological effects of high- and low-dose IR. The major goals of transcriptome studies are to determine the cell- and condition-specific dynamics of transcriptional activity and to investigate regulating mechanisms of mRNA production (Brackmann et al. Citation2020; ICRP Citation2007). It is known that acute exposure to low- or high-dose IR leads to profound changes in expression patterns (Sokolov and Neumann Citation2015). In radiation protection, very low, low, moderate, and high doses of IR exposure are defined as mGy,
mGy,
mGy, and
mGy, respectively (Little et al., Citation2021). Transcriptomic responses to different dose ranges might involve different genes. Some genes may only have a short-term response, while others may exhibit changes over a long period of time (Jafer et al. Citation2020). Despite significant progress made in understanding radiation pathogenesis, IR-related persistent alterations at the molecular level are still not fully explored (Garikipati et al. Citation2021). However, investigating the persistent transcriptional responses of radiation may help us understand the biology of radiation-induced cellular alterations and can have potential implications for the health-effect studies of A-bomb survivors.
One potential application of radiation-induced expression changes is retrospective estimation of radiation dose (Ostheim et al. Citation2022). Biodosimetry refers to the measurement of biological markers that are correlated with the magnitude of the dose. Accurately estimating the received radiation dose of accidentally exposed individuals within a population might help to assist medical decision-making in rapid triage and assessing the risk of long-term consequences from radiation exposure (Abend et al. Citation2022). Even though the gold standard for IR biodosimetry remains the dicentric chromosome assay (DCA) (Sullivan et al., Citation2013; Sproull et al., Citation2017; Escalona et al., Citation2022), gene expression profiles from peripheral blood lymphocytes (PBL) have attracted great interest for biodosimetry development. Gene expression profiles are more time-efficient and less expensive, providing an appealing strategy for biodosimetry (Macaeva et al. Citation2019). Differentially expressed (DE) genes have been identified from microarrays or RNA-seq in several studies (Lacombe et al. Citation2018). However, gene expression-based biodosimetry is still an ongoing topic of research. One of the major challenges for expression as a biomarker of IR exposure is that the signal is highly transient and dynamic. Expression changes depend on both time and dose, and the temporal kinetics of expression differ by gene (Manning et al. Citation2013; Macaeva et al. Citation2019). To date, biomarkers have been mainly identified with statistical tests or supervised classification, ignoring the time and dose dynamics of the responses, which contributes to poor reproducibility (Serra et al. Citation2020).
The requirements of a good biological dosimeter are that it should be IR sensitive with changes linear in dose, exhibit a stable signal without temporal fluctuations (no or linear correlation with time), be reliable over a wide dose range, and be subject to no influence of gender, age, or health status (Hladik et al. Citation2022). Moreover, an IR biodosimetry study focuses on the expression of candidate biomarkers between 1– 7 days; therefore, the transcriptional response of a good IR biodosimeter must be stable beyond the first day after exposure. However, most whole genome expression datasets available in the public domain were measured within 24 hours of exposure (Lacombe et al. Citation2018) and are likely more dynamic, adding to the challenges of dosimetry biomarker identification. Therefore, in this pilot study, we propose a linear mixed effects model to simultaneously explore the effects of both dose and time on transcriptomic changes. The influence of individual characteristics such as sex and age is adjusted explicitly through the random effects; fixed effects are used to explore the IR-related molecular changes and thus identify candidate dosimetry biomarkers.
2. Materials and Methods
2.1. Datasets
As demonstrated in , three microarray datasets—GSE8917, GSE53151, and GSE23515—were downloaded from the GEO (https://www.ncbi.nlm.nih.gov/geo/) database and utilized for this study.
Table 1. Microarray datasets studied.
2.2. GSE8917 (high-dose irradiation)
This radiation gene expression dataset was originally generated from an Agilent DNA Microarray with peripheral blood samples obtained from 10 healthy donors including 5 men and 5 women (Paul and Amundson Citation2008). The dataset was obtained and preprocessed with the GEOquery R package. Fifty microarray samples were generated after irradiation of whole blood at 0.82 Gy/min to total doses of 0, 0.5, 2, 5, or 8 Gy. Irradiated blood was then diluted 1:1 with fetal bovine serum and incubated for 6 or 24 hours at 37 °C in a humidified incubator with 5% CO2 before total blood RNA extraction, labeling, and hybridization. Each of the five doses was applied to blood samples from the same donor, but data at 6 and 24 hours of post-exposure were from different donors: at 6 hours, 2 men (mean age 46) and 3 women (mean age 30.3); at 24 hours, 3 men (mean age 38.3) and 2 women (mean age 34.5). This study has a high dose (HD) with a maximum of 8 Gy. We get the gene-level expression data by averaging out the expressions at the probe level and excluding genes with missing values. There is a total of 8639 genes after preprocessing. We also normalize both the dose and time into the range of 0–1 to facilitate visualization.
2.3. GSE43151 (low-dose irradiation)
This gene expression dataset was originally collected to study gene-expression changes in CD4+ T lymphocytes after exposure of whole blood (diluted 1:10 in IMDM [Iscove’s Modified Dulbecco’s Medium]) to low and very low doses (LD) of ionizing radiation (Nosel et al. Citation2013). CD4+ T lymphocytes were extracted by using negative cell sorting (i.e., labeling and removal of unwanted cell types). These data were generated from 5 male donors by using an Agilent-026652 Whole Human Genome Microarray 4x44K v2. Whole blood exposures were performed with a 60Co source at a relatively low dose rate (50 mGy min−1) and exposures were performed independently on blood samples of each donor. There are 103 microarray subjects with doses of 0, 5, 10, 25, 50, 100, and 500 mGy and times of 0, 2.5, 5, 7.5, and 10 hours post-irradiation before RNA extraction. Note that the design is not saturated; the reason why some samples at certain combinations of dose and time are not included is unknown. There are 13447 genes after we average out the expression at the probe level and exclude genes with missing values. We also normalize the dose and time into the range of 0 − 1 before model fitting.
2.4. GSE23515 (validation dataset)
This dataset was generated with Agilent’s one-color microarray technology. Peripheral blood cells from each of 24 different donors were exposed to four doses of ionizing radiation (0, 0.1, 0.5, or 2 Gy). The donors comprise 12 women and 12 men, in each sex half of whom were smokers and half nonsmokers. The 6x2x2x4 design is nearly saturated, except that there are only 5 results for female smokers at 2 Gy (total of 95 samples). Peripheral blood from volunteers was first drawn into 0.105 mol/l sodium citrate Vacutainer tubes and exposed at a rate of 0.82 Gy/min to 0, 0.1, 0.5, or 2 Gy γ-rays. Gene expressions were measured 6 hours after irradiation (Paul and Amundson Citation2011). We made a log transform and quantile normalization and excluded genes with missing values. There are 12152 genes available for downstream analysis. This dataset does not have a time dimension and is mainly used to validate the biomarkers identified from the other datasets.
2.5. Methods
2.5.1. Linear Mixed-Effects (LME) model
A linear mixed-effects (LME) model (linear mixed model) is a linear regression model containing both fixed effects and random effects. When the observations are not independent, the random effects in the model allow for an individual-level intercept and/or slope, so that the parameters of a linear regression are no longer fixed but rather can vary around their mean values. In the following model, we account for the variations in baseline gene expression for different persons by including an additional random intercept. Assuming that the baseline expression level of a gene without exposure at time 0 is and the expression level at time
and dose
is
a simple dose-response model is defined as:
Taking the natural log, The LME model is specified as:
where LFC is defined as the log-fold change,
are the fixed-effect parameters,
measures the random effect of the intercept that varies randomly for each person, and
To detect the linear association between dose/time and LFC, it is assumed that individuals only have a random effect on the intercept, i.e., that there are no random effects on dose and time course, so personal characteristics have no influence on the dose and time associations with LFC. Although the assumption is unlikely to be true globally, we are solely interested in identifying genes where this assumption holds for the purpose of biodosimetry. The model was fitted with the fitlme function from the statistical and machine learning toolbox in MATLAB (www.mathworks.com). P-values of the F-test were first examined. The F-test evaluates the amount of variance explained by the proposed model against the constant model with only A large P-value also suggests there is no linear dose-response effect. For genes with a small F-test P-value (
), differentially expressed (DE) genes were further identified through strong dose-LFC association with a small P-value of
(
The cutoff
is chosen to control the family-wise error rate with the conservative Bonferroni correction (Goeman and Solari Citation2014). Genes with a positive
have increased expression with larger dose and are therefore upregulated, while those with a negative
are downregulated.
2.5.2. Other statistical software
R packages including VennDiagram and ggplot2 are used to generate the Venn diagram and pathway enrichment figures. Dose-response surface plots are generated with our own script in MATLAB. Enrichment analysis was performed with Enrichr (https://maayanlab.cloud/Enrichr/) and STRING (https://string-db.org/).
3. Results and discussion
3.1. Different genes but similar functional pathways respond to low- and high-dose IR exposure
We identified 354 and 266 DE genes for low (GSE43151) and high (GSE8917) dose IR exposures, respectively, with the P-value of (
(Supplementary Table 1).
As demonstrated in , only 25 DE genes are common to both datasets, indicating that for the most part, different genes are involved after low- and high-dose exposures. Note that the low-dose dataset (GSE43151) was based on CD4+ lymphocytes whereas the other datasets were based on whole blood. Transcriptional responses may depend on both the dose of radiation and the type of cells.
Figure 1. Differentially expressed (DE) genes after low- and high-dose IR exposures. A: Venn diagram of the DE genes. B: the percentages of identified DE genes that Overlapped with known functional databases. C: top 5 bioprocesses (biological process), KEGG (Kyoto Encyclopdia of genes and Genomes), and Wiki (Wikipedia) pathways enriched in DE genes after low-dose IR exposure. D: top 5 biological process, KEGG and Wiki pathways enriched in DE genes after high-dose IR exposure.
shows percentages of identified genes involved in various known functional databases, including cell cycle (https://cyclebase.org/) (Santos et al. Citation2015; Riba et al. Citation2022), immune-related genes (https://www.innatedb.com/), and DNA damage repair (https://repairtoire.genesilico.pl/) (Milanowska et al. Citation2011). Respectively, 31.2%, 10.9%, and 3.0% of high-dose DE genes are represented in these functional databases, whereas 23.7%, 13.3%, and 3.1%, of the low-dose DE genes overlap with these functional databases. Therefore, different percentages of DE genes are involved in immune functions and cell cycle after low- and high-dose exposures. Besides the dose variations, distinct cell types of the low- and high-dose datasets may also contribute to the differences in DE genes.
are the functional enrichment analysis for DE genes after low- and high-dose IR exposures, respectively. We report the top 5 pathways, from the BioProcess (biological process), KEGG (Kyoto Encyclopedia of Genes and Genomes), and Wiki (Wikipedia: https://www.wikipathways.org/) databases, that are enriched within the DE gene sets. Interestingly, although only 25 DE genes are common to both gene sets, both groups of responding genes are involved in similar biological functions. For instance, both low- and high-dose DE genes are involved in the biological processes of regulation of programmed cell death and regulation in the apoptotic process. Moreover, both are enriched in 3 KEGG pathways: p53 signalling pathways, Epstein-Bar virus infection, and Chronic myeloid leukemia. They are also involved in 4 common Wiki pathways: p53 transcriptional gene network, genotoxicity pathway, DNA damage response, and miRNA regulation of DNA damage response. KEGG and Wiki are alternative representations of the same biological pathways, so it is not surprising that they overlap substantially. These pathways were also reported in previous investigations (Khan and Wang, Citation2022; Lumniczky et al., Citation2021; Huang & Zhou, Citation2020).
3.2. Distinct DE genes are involved in different phases of the cell cycle
The cell cycle is a process fundamental to cell growth and replication. It is typically divided into 4 phases: G1 (Gap1), S (Synthesis), G2 (Gap 2), and M (Mitosis). IR exposure can cause DNA damage and affect cell cycle progression (Lonati et al. Citation2021). Cell-cycle genes with known phases were downloaded from Cyclebase (https://cyclebase.org/). We further report DE genes with known phases and checkpoint functions in .
Figure 2. DE genes with known cell-cycle phases and checkpoint functions, where genes in red are upregulated with a positive and genes in blue are down-Regulated with a negative
A: Cell cycle related DE genes after high-dose IR exposure (GSE8917). B: Cell cycle associated DE genes after low-dose IR exposure (GSE43151).
Genes in red indicate upregulation and a positive association ( between dose and the LFC of expression, whereas genes in blue denote downregulation and a negative correlation between dose and LFC with
One observation from is that there are fewer DE genes for cell cycle with known phases after high-dose () than low-dose () irradiation. For instance, 9 and 4 DE genes are upregulated at the G2M and S1 phases after low-dose IR exposure (), but only 3 and 2 DE genes are positively associated with dose during G2M and S1 phases after high-dose exposure (). Furthermore, most DE genes during these phases are different and more DE genes are involved during the G2M phase than other phases after both low- and high-dose exposures. Both the dose of radiation and the type of cells may induce distinct DE genes in the two datasets.
Interestingly, although most DE genes at different phases are distinct for low- and high-dose irradiation, there are several DE checkpoint genes common to both. There are 16 checkpoint DE genes (13 upregulated and 3 downregulated) after low-dose IR exposure and 8 checkpoint DE genes (6 upregulated and 2 downregulated) after high-dose exposure. Of these DE genes, 5 out of 6 checkpoint genes upregulated after high-dose IR exposure (BAX, GADD45A, PCNA, PLK3, XPC) are also upregulated after low-dose irradiation. The G1 phase gene BBC3 is also upregulated after both low- and high-dose IR exposures. Gene RNF113A, on the other hand, has a negative association with LFC after a high-dose IR exposure but is positively associated with LFC after a low-dose exposure.
3.3. Persistent transcriptional responses of low- and high-dose IR exposure
DE genes may or may not be persistent over time, depending on the sign of To study persistent transcriptional responses after irradiation, we further divide the DE genes into 4 distinct clusters with positive and negative
and
values as demonstrated in .
demonstrate the 4 clusters for high-dose (HD) and low-dose (LD) IR exposures, respectively. The average LFCs in each cluster against both dose and time are plotted in columns 1 and 3 of , while the marginal 2D plots of average LFCs vs either dose or time are presented in columns 2 and 4 of . Cluster 1 (C1) includes the DE genes with both and
having positive values (
Positive
and
indicate that LFCs in C1 are positively associated with both dose and time. Cluster 2 (C2) consists of the DE genes with positive
but negative
(
The LFCs in C2 increase with dose but decrease with time course. Cluster 3 (C3) contains the DE genes with negative
but positive
(
Genes in C3 are negatively associated with dose but positively associated with time. Cluster 4 (C4) consists of DE genes with both
and
being negative
indicating that DE genes in C4 are downregulated over both dose and time. The kinetics of genes in each cluster with normalized dose and time (0 − 1) are reported in . As demonstrated in , DE genes in C1 and C4 are likely to have a persistent effect, because LFCs are up or down, respectively, over both time course and dose. Genes in C2 and C3, on the other hand, might represent the process of DNA damage and cell recovery over time and only have a short-term transcriptional response, because gene expression is either up over time but down with dose or vice versa. In these clusters, the effects of dose and time on LFCs are in opposite directions, so that LFC might return to zero within a short amount of time. Therefore, DE genes in C1 and C4 merit more attention. Some of these genes might be useful as radiation biomarkers.
Figure 3. Average log-fold changes (LFC) of the DE genes in each cluster over time and dose DE genes are divided into 4 clusters with the sign of and
where cluster I (C1) contains DE genes with
and
oth being positive (+ +); cluster 2 (C2) consists of DE genes with positive
but negative
(+ -); cluster 3 (C3) comprises DE genes with negative
but positive
(- +); and cluster 4 (C4) includes DE genes with
and
both being negative (- -). A: the 4 clusters after high-dose (HD) IR exposure. B: the 4 clusters after low-dose (LD) IR exposure. From left to right, columns 1 and 3 are the 3D plots for LFC vs both dose and time course, while columns 2 and 4 are the marginal 2D plots for LFC against dose and time, separately.
The results of further analysis are reported in . As demonstrated in , the components of DE genes following high- and low-dose IR exposures are different. Overall, there are 36% upregulated genes (C1 + C2) and 64% downregulated genes (C3 + C4) after high-dose exposure, but 55% upregulated genes (C1 + C2) and 45% downregulated genes (C3 + C4) after low-dose exposure. For genes in clusters C1 and C4 with potentially persistent effect, there are 9% and 35% of DE genes in C1 and C4, respectively, after high-dose irradiation, but 38% and 17% of DE genes in C1 and C4, respectively, after low-dose irradiation. Although transcriptional responses may vary due to different cell types in the two datasets, fewer upregulated and more downregulated genes after high-dose IR exposure might indicate reduced biological activities due to DNA damage and cell death.
Figure 4. Pie charts showing the percentage of DE genes in different clusters and the KEGG pathway enrichment analysis for genes in clusters C1 ( > 0 &
> 0) and C4 (
< 0 &
< 0) following low- and high-dose IR exposures. LD-C1: Top 5 KEGG (Kyoto Encyclopedia of genes and Genomes) pathways for upregulated genes dose IR exposure; and HD-C1: Top 5 KEGG pathways for upregulated genes in C1 after a high-dose IR exposure. There is no KEGG pathway enriched for downregulated genes in LD-C4.
DE genes with cluster information are reported in Supplementary Tables 1 and 2. The top 5 enriched KEGG pathways for DE genes in C1 and C4 after low- and high-dose exposures are reported in . The 135 (38%) upregulated genes in cluster 1 (C1) after low-dose irradiation is enriched primarily in the p53 signalling pathway, natural killer (NK) cell-mediated cytotoxicity, and glutathione metabolism, whereas the 25 (9%) upregulated genes in C1 after high-dose irradiation are enriched primarily in the p53 signalling pathway and apoptosis. The 93 (35%) downregulated genes in C4 after high-dose IR exposure are enriched primarily in the NK cell-mediated cytotoxicity, the B cell receptor signalling pathway, and the T cell receptor signalling pathway. There are no enriched KEGG pathways for the 61 (17%) downregulated genes after low-dose exposure.
Table 2. Common DE genes over high- and low-dose IR exposure.
3.4. Biomarker identification
We identified 25 genes common to both datasets () with the P value for (
). Full descriptions of the identified genes can be found at https://www.genecards.org/. The fixed-effect coefficients
and cluster information
after high and low-dose IR exposures are reported in .
These 25 genes have a linear correlation with both time and dose over a wide range of doses and are potential candidate biomarkers for dosimetry. Ideally, a candidate biodosimeter should belong to the same cluster and have the same positive or negative linear association with both dose and time in the two datasets. When a gene has different (positive and negative) associations with time in different datasets, the P-value of should be insignificant (
) in at least one dataset. We identified 12 genes as candidate biodosimeters—ARHGEF3, BAX, BBC3, CCDC109B, DCP1B, DDB2, F11R, GADD45A, GSS, PLK3, TNFRSF10B, and XPC—as reported on the top panel of (shaded in yellow) and Supplementary Figure 1. Of these, BAX, F11R, GSS, and TNFRSF10B, which belong to cluster C1, have a persistent effect and might be better candidates for biodosimetry. Another 3 genes (CBX3, PPP3CC, and RNF113A) on the middle panel of (shaded in Orange) and in Supplementary Figure 2 have opposite associations with dose after low- and high-dose IR exposures. They are activated with a positive
after low-dose exposure but have reduced activities with a negative
after high-dose exposure. Although these 3 genes are not appropriate for use as dosimetry markers, they might be important for understanding the effects on expression of radiation dose and cell type. The remaining ten genes (ASCC3, FBXO22, FBXW7, FDXR, PCNA, PHPT1, PPM1D, REV3L, SESN1, and SRA1) have opposite associations with time after low- and high-dose irradiation ( and Supplementary Figure 3). These genes might have nonlinear dose-time interactions and are therefore excluded from the candidate biodosimeters.
3.5. Validation with an independent dataset
We further validate the 12 candidate biomarkers with an independent dataset (GSE23515). There are 10 out of 12 of our candidate genes (BAX, BBC3, DCP1B, DDB2, F11R, GADD45A, GSS, PLK3, and TNFRSF10B) present in this validation dataset; the two other candidate genes (CCDC109B and XPC) were not measured by this microarray platform. Boxplots for the LFC at 3 different doses of irradiation (0.1 Gy, 0.5 Gy, and 2 Gy) are presented in .
Figure 5. Boxplots of the LFC of 10 candidate biomarkers following different doses of IR exposure (0.1 Gy, 0.5 Gy, and 2 Gy) in the validation dataset (GSE23515). the y-Axis represents LFC. The red dot and the horizontal line inside each box represent the median.
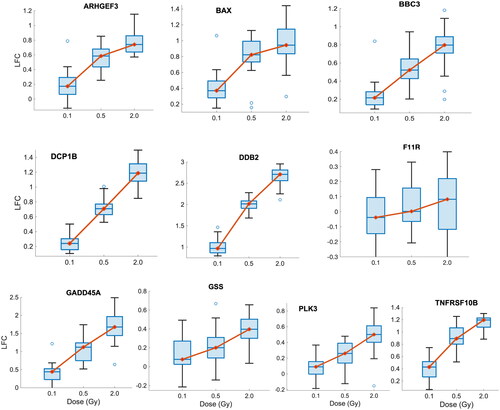
As shown in , average LFCs of all candidate biodosimeters increase with larger doses of IR exposures in the validation dataset. Apart from F11R, these genes have statistically significant monotonic relationships with dose (P < 1e-4, ANOVA with Random Effects) and their average (and median) gene expression increases as the dose becomes larger, indicating that the candidate biodosimeters are reproducible in an independent dataset.
3.6. Advantages of the LME model
Although a considerable number of studies have been conducted on the direct effects of radiation exposure on gene expression in peripheral blood samples (Ostheim et al. Citation2022), most of them are based on fold changes, statistical tests, and supervised classifications within discrete time points, ignoring the time-dose dynamics of the transcriptional response. However, both the dose and time dependences of gene expression can be important for understanding the molecular mechanisms of radiation response and play a major role in accurate dose reconstruction. More importantly, persisitent effects of high- and low-dose irradiation on gene expression are still not fully understood (Jafer et al. Citation2020). Therefore, in this pilot study we proposed a LME model to investigate the joint dose-time dynamics of transcriptional responses and to functionally characterize the time- and dose-dependent changes in gene expression. Coefficients of the proposed model aid understanding of the effects of irradiation on gene expression beyond 24 hours after exposure. One advantage of the proposed approach is that DE genes are identified with a strong linear association between dose and LFC of expression, adjusting for time course and eliminating effects of a specific time.
Transcriptional responses are highly dynamic, particularly within 24 hours of IR exposure. We are more interested in genes with persistent changes in expression profiles because such genes would be more useful for dose reconstruction. Such modifications in expression may also be the result of upstream signaling switches or epigenetic variation after IR exposure. We simply divide the DE genes into 4 clusters with the signs of and
Genes in clusters C1 and C4 with
and
being either both positive or both negative have persistent transcriptional responses. In particular, reduced expressions of genes in C4 over both dose and time course might indicate dying cells and be the result of irreparable DNA damage caused by IR exposure. Previous studies indicate that most DNA double-strand breaks (DSBs) are repairable, many stress-responsive genes may return to normal over 24 hours, and only a small proportion of DE genes associated with unrepaired DSBs remain differentially expressed beyond 24 hours (Noda Citation2018; Noda et al. Citation2012). The present approach helps us to identify genes with transcriptional response persisting beyond one day, which are applicable even if the gene expressions are measured within 24 hours of IR exposure.
3.7. Pathways enriched after low and high dose irradiation
Even though peripheral blood cells are typically considered to be dormant in the body, dysregulations in the cell cycle and checkpoint genes may still have significant implications and can affect cell proliferation, differentiation, immune response, and other processes. In particular, the P53 signalling pathway is activated after both low- and high-dose radiation exposure and plays a key role in cell cycle arrest, DNA damage repair, senescence, and apoptosis. Persistent upregulation of the P53 pathway may indicate unrepaired DNA damage. Interestingly, NK cell-mediated cytotoxicity functions are enriched among the upregulated genes (PPP3CC, ICAM2, TNFRSF10B, FAS, KIR3DL3) after low-dose exposure, but are enriched among downregulated genes (PPP3CC, SH2D1B, GZMB, PIK3R1, CD2) after high-dose exposure, and gene PPPC3CC (Protein Phosphatase 3 Catalytic Subunit Gamma) on this pathway has associations with both time and dose after low-dose irradiations that are in the opposite direction from those after high-dose irradiations (Supplementary Figure 2). NK cells are innate immune lymphocytes that can recognize and destroy abnormal cells, such as tumor or DNA-damaged cells (Paul et al. Citation2013; Chen et al. Citation2020). Therefore, the upregulated NK-mediated cytotoxicity pathway indicates that NK cell functions are activated after low-dose IR exposure. On the other hand, enrichment of downregulated genes in NK cell-mediated cytotoxicity, T-cell receptor signalling, and B-cell receptor signalling pathways might indicate that cells undergo permanent arrest of DNA replication or apoptosis after high-dose irradiation and the immune functions of the cells are partially impaired. Our finding is consistent with the fact that lymphoid cells (T, B, and NK cells) are generally more vulnerable to damage from radiation because they divide and proliferate more frequently than other types of blood cells (Heylmann et al. Citation2021)
3.8. Candidate biomarkers for dosimetry
As mentioned earlier, a good biodosimeter must be IR sensitive, change linearly with dose, have a stable signal without temporal fluctuations (no linear correlation with time), be reliable over a wide dose range, and have no influence of gender, age, or health status. We, therefore, built an LME model and identified 12 genes common to both datasets and having similar correlations with dose and time after high- and low-dose exposures. The 12 genes (ARHGEF3, BAX, BBC3, CCDC109B, DCP1B, DDB2, F11R, GADD45A, GSS, PLK3, TNFRSF10B, and XPC) are mainly involved in cell cycle, DNA repair, and immune functions. Of these, BAX, BBC3, DDB2, GADD45A, TNFRSF10B, and XPC were also reported as candidate biomarkers in previous studies (Lacombe et al. Citation2018). The 12 candidate biomarkers were also reproducible when validated with an independent dataset. Interestingly, PLK3 belongs to the highly conserved polo-like kinase family, is a key regulator of the cell cycle, and has the typical function of chromosome segregation at G2 phase. Genes in C1 and C4, including BAX, GSS, and TNFRSF10B, might be better biodosimeters as they have persistent transcriptional responses. We precluded 13 other genes—ASCC3, FBXO22, FBXW7, FDXR, PCNA, PHPT1, PPM1D, REV3L, SESN1, SRA1, CBX3, PPP3CC, and RNF113A—from consideration as candidate dosimeters, although several of them (ASCC3, FBXO22, FDXR, PCNA, PHPT1, and SESN1) were reported as potential dosimeters in previous studies that did not consider the joint dose and time dynamics (Lacombe et al. Citation2018). For instance, FDXR was eliminated from our biomarker list because it has different correlations with time after low- and high-dose exposures, indicating nonlinear dose-time interactions and temporal fluctuations, although it was the gene with the greatest significance in the statistical test. FDXR has been thoroughly studied over the last several years, but a discrepancy in FDXR expression between mice and human cell lines was found and it failed to predict the dose accurately (Abend et al. Citation2022; Macaeva et al. Citation2019).
3.9. Limitations of the study
It is challenging to mine gene expression datasets in the public domain. First, besides different cell types, microarray data were collected with different platforms. There are 8639 genes measured after high-dose irradiation, but 13,447 genes are available that were measured after low-dose irradiation; this difference might create certain biases in gene identification. Second, measured time points are different. Maximum measured times are 10 and 24 hours over low- and high-dose irradiations, respectively. This time discrepancy might introduce bias and systematic errors in the analysis. Third, observed gene expression can change when blood is put in a culture or if the RNA sources are different (Paul et al. Citation2011; Paul et al. Citation2013). We would also fail to detect marker genes that are associated with both dose and time but not measured in the datasets. Furthermore, other factors such as cell cycle, peri- and post-irradiation conditions, and RNA preparation methods could influence the observed gene expression. Nevertheless, the monotonic association between dose and LFC was confirmed in an independent validation dataset for 9 out of 10 identified candidate biomarkers.
4. Conclusion
We propose an LME model to detect genes that have persistent transcriptional responses or may serve as candidate biological dosimeters with integrated transcriptome analysis. We identified two subsets of genes that are either positively or negatively associated with both dose and time course after exposure and are likely to have persistent expression changes. One especially interesting finding is that the NK cell-mediated cytotoxicity pathway is downregulated after high-dose IR exposure but is upregulated after low-dose IR exposure, and there are more upregulated genes after low-dose irradiation than after high-dose irradiation. Although different types of cells in the low- versus high-dose datasets might impact the finding, we demonstrated that generally cell cycle genes respond to low doses whereas immune suppression mechanisms are induced at high doses. We also identified 12 potential biological dosimeters (ARHGEF3, BAX, BBC3, CCDC109B, DCP1B, DDB2, F11R, GADD45A, GSS, PLK3, TNFRSF10B, and XPC), of which 3 genes—BAX, GSS, and TNFRSF10B—might be the better biomarkers as they have persistent transcriptional responses. We also eliminated 13 other genes that have an opposite association with either time or dose after low- and high-dose irradiations. The findings were validated with an independent dataset. Further validation in a wet lab should be performed to confirm their biological and clinical relevancies.
Supplemental Material
Download Zip (4.6 MB)Disclosure statement
No potential conflict of interest was reported by the author(s).
Additional information
Funding
Notes on contributors
Zhenqiu Liu
Zhenqiu Liu, PhD, is a Senior Scientist at the Department of Statistics, Radiation Effects Research Foundation (RERF), Hiroshima, Japan.
John Cologne
John Cologne, PhD, ELS, is a Senior Scientist at the Department of Statistics, Radiation Effects Research Foundation (RERF), Hiroshima, Japan.
Sally A. Amundson
Sally A. Amundson, PhD, is an Associate Professor of Radiation Oncology at the Center for Radiological Research, Columbia University Irving Medical Center, New York City, NY, USA.
Asao Noda
Asao Noda, PhD, is the Chief of the Department of Molecular Biosciences, Radiation Effects Research Foundation (RERF), Hiroshima, Japan.
References
- Abend M, Blakely WF, Ostheim P, Schuele S, Port M. 2022. Early molecular markers for retrospective biodosimetry and prediction of acute health effects. J Radiol Prot. 42(1):010503. doi:10.1088/1361-6498/ac2434
- Brackmann LK, Poplawski A, Grandt CL, Schwarz H, Hankeln T, Rapp S, Zahnreich S, Galetzka D, Schmitt I, Grad C, et al. 2020. Comparison of time and dose dependent gene expression and affected pathways in primary human fibroblasts after exposure to ionizing radiation. Mol Med. 26(1):85. doi:10.1186/s10020-020-00203-0
- Chen J, Liu X, Zeng Z, Li J, Luo Y, Sun W, Gong Y, Zhang J, Wu Q, Xie C. 2020. Immunomodulation of NK cells by ionizing radiation. Front Oncol. 10:874. doi:10.3389/fonc.2020.00874
- Escalona MB, Ryan TL, Balajee AS. 2022. Current developments in biodosimetry tools for radiological/nuclear mass casualty incidents. Environ Adv. 9:100265. doi:10.1016/j.envadv.2022.100265
- Garikipati VNS, Arakelyan A, Blakely EA, Chang PY, Truongcao MM, Cimini M, Malaredy V, Bajpai A, Addya S, Bisserier M, et al. 2021. Long-term effects of very low dose particle radiation on gene expression in the heart: degenerative disease risks. Cells. 10(2):387. doi:10.3390/cells10020387
- Ghosh S, Ghosh A. 2021. Activation of DNA damage response signaling in mammalian cells by ionizing radiation. Free Radic Res. 55(5):581–594.
- Goeman JJ, Solari A. 2014. Multiple hypothesis testing in genomics. Statist Med. 33(11):1946–1978. doi:10.1002/sim.6082
- Heylmann D, Ponath V, Kindler T, Kaina B. 2021. Comparison of DNA repair and radiosensitivity of different blood cell populations. Sci Rep. 11(1):2478. doi:10.1038/s41598-021-81058-1
- Hill MA. 2020. Radiation track structure: how the spatial distribution of energy deposition drives biological response. Clin Oncol (R Coll Radiol). 32(2):75–83. doi:10.1016/j.clon.2019.08.006
- Hladik D, Bucher M, Endesfelder D, Oestreicher U. 2022. The potential of omics in biological dosimetry. Radiation. 2(1):78–90. doi:10.3390/radiation2010006
- Huang RX, Zhou PK. 2020. DNA damage response signaling pathways and targets for radiotherapy sensitization in cancer. Signal Transduct Target Ther. 5(1):60.
- IAEA. 2010. Radiation biology: a handbook for teachers and students. Vienna: IAEA. (Training Course Series No. 42, 2010). Retrieved from https://www.iaea.org/publications/8219/radiation-biology-a-handbook-for-teachers-and-students
- ICRP. 2007. The Recommendations of the International Commission on Radiological Protection. ICRP publication 103 2007. 0146–6453.
- Jafer A, Sylvius N, Adewoye AB, Dubrova YE. 2020. The long-term effects of exposure to ionising radiation on gene expression in mice. Mutat Res. 821:111723. doi:10.1016/j.mrfmmm.2020.111723
- Kamiya K, Ozasa K, Akiba S, Niwa O, Kodama K, Takamura N, Zaharieva EK, Kimura Y, Wakeford R. 2015. Long-term effects of radiation exposure on health. Lancet. 386(9992):469–478. doi:10.1016/S0140-6736(15)61167-9
- Khan MGM, Wang Y. 2022. Advances in the current understanding of how low-dose radiation affects the cell cycle. Cells. 11(3):356. doi:10.3390/cells11030356
- Lacombe J, Sima C, Amundson SA, Zenhausern F. 2018. Candidate gene biodosimetry markers of exposure to external ionizing radiation in human blood: a systematic review. PLoS ONE. 13(6):e0198851. doi:10.1371/journal.pone.0198851
- Little MP, Azizova TV, Hamada N. 2021. Low- and moderate-dose non-cancer effects of ionizing radiation in directly exposed individuals, especially circulatory and ocular diseases: a review of the epidemiology. Int J Radiat Biol. 97(6):782–803. doi:10.1080/09553002.2021.1876955
- Lonati L, Barbieri S, Guardamagna I, Ottolenghi A, Baiocco G. 2021. Radiation-induced cell cycle perturbations: a computational tool validated with flow-cytometry data. Sci Rep. 11(1):925. doi:10.1038/s41598-020-79934-3
- Lumniczky K, Impens N, Armengol G, Candéias S, Georgakilas AG, Hornhardt S, Martin OA, Rödel F, Schaue D. 2021. Low dose ionizing radiation effects on the immune system. Environ Int. 149:106212. doi:10.1016/j.envint.2020.106212
- Macaeva E, Mysara M, De Vos WH, Baatout S, Quintens R. 2019. Gene expression-based biodosimetry for radiological incidents: assessment of dose and time after radiation exposure. Int J Radiat Biol. 95(1):64–75. doi:10.1080/09553002.2018.1511926
- Manning G, Kabacik S, Finnon P, Bouffler S, Badie C. 2013. High and low dose responses of transcriptional biomarkers in ex vivo X-irradiated human blood. Int J Radiat Biol. 89(7):512–522. [Database] doi:10.3109/09553002.2013.769694
- Milanowska K, Krwawicz J, Papaj G, Kosinski J, Poleszak K, Lesiak J, Osinska E, Rother K, Bujnicki JM. 2011. REPAIRtoire–a database of DNA repair pathways. Nucleic Acids Res. 39(Database issue):D788–92. doi:10.1093/nar/gkq1087
- Nagane M, Yasui H, Kuppusamy P, Yamashita T, Inanami O. 2021. DNA damage response in vascular endothelial senescence: Implication for radiation-induced cardiovascular diseases. J Radiat Res. 62(4):564–573. doi:10.1093/jrr/rrab032
- Noda A. 2018. Radiation-induced unrepairable DSBs: their role in the late effects of radiation and possible applications to biodosimetry. J Radiat Res. 59(suppl_2):ii114–ii120. doi:10.1093/jrr/rrx074
- Noda A, Hirai Y, Hamasaki K, Mitani H, Nakamura N, Kodama Y. 2012. Unrepairable DNA double-strand breaks that are generated by ionising radiation determine the fate of normal human cells. J Cell Sci. 125(Pt 22):5280–5287.
- Nosel I, Vaurijoux A, Barquinero JF, Gruel G. 2013. Characterization of gene expression profiles at low and very low doses of ionizing radiation. DNA Repair. 12(7):508–517. doi:10.1016/j.dnarep.2013.04.021
- Ozasa K, Cullings HM, Ohishi W, Hida A, Grant EJ. 2019. Epidemiological studies of atomic bomb radiation at the radiation effects research foundation. Int J Radiat Biol. 95(7):879–891. doi:10.1080/09553002.2019.1569778
- Ostheim P, Amundson SA, Badie C, Bazyka D, Evans AC, Ghandhi SA, Gomolka M, López Riego M, Rogan PK, Terbrueggen R, et al. 2022. Gene expression for biodosimetry and effect prediction purposes: promises, pitfalls and future directions - key session ConRad 2021. Int J Radiat Biol. 98(5):843–854. doi:10.1080/09553002.2021.1987571
- Paul S, Amundson SA. 2008. Development of gene expression signatures for practical radiation biodosimetry. Int J Radiat Oncol Biol Phys. 71(4):1236–1244. doi:10.1016/j.ijrobp.2008.03.043
- Paul S, Amundson SA. 2011. Gene expression signatures of radiation exposure in peripheral white blood cells of smokers and non-smokers. Int J Radiat Biol. 87(8):791–801. doi:10.3109/09553002.2011.568574
- Paul S, Smilenov LB, Amundson SA. 2013. Widespread decreased expression of immune function genes in human peripheral blood following radiation exposure. Radiat Res. 180(6):575–583. doi:10.1667/RR13343.1
- Paul S, Barker CA, Turner HC, McLane A, Wolden SL, Amundson SA. 2011. Prediction of in vivo radiation dose status in radiotherapy patients using ex vivo and in vivo gene expression signatures. Radiat Res. 175(3):257–265. doi:10.1667/RR2420.1
- Riba A, Oravecz A, Durik M, Jiménez S, Alunni V, Cerciat M, Jung M, Keime C, Keyes WM, Molina N. 2022. Cell cycle gene regulation dynamics revealed by RNA velocity and deep-learning. Nat Commun. 13(1):2865. doi:10.1038/s41467-022-30545-8
- Santos A, Wernersson R, Jensen LJ. 2015. Cyclebase 3.0: a multi-organism database on cell-cycle regulation and phenotypes. Nucleic Acids Res. 43(D1):D1140–D1144. doi:10.1093/nar/gku1092
- Serra A, Fratello M, Del Giudice G, Saarimäki LA, Paci M, Federico A, Greco D. 2020. TinderMIX: Time-dose integrated modelling of toxicogenomics data. Gigascience. 9(5):giaa055. doi:10.1093/gigascience/giaa055
- Sokolov M, Neumann R. 2015. Global gene expression alterations as a crucial. constituent of human cell response to low doses of ionizing radiation exposure. IJMS. 17(1):55. doi:10.3390/ijms17010055
- Sproull MT, Camphausen KA, Koblentz GD. 2017. Biodosimetry: a future tool for medical management of radiological emergencies. Health Secur. 15(6):599–610. doi:10.1089/hs.2017.0050
- Sullivan JM, Prasanna PG, Grace MB, Wathen LK, Wallace RL, Koerner JF, Coleman CN. 2013. Assessment of biodosimetry methods for a mass-casualty radiological incident: medical response and management considerations. Health Phys. 105(6):540–554. [Database] doi:10.1097/HP.0b013e31829cf221
- UNSCEAR. 2008. Sources, and Effects of Ionizing Radiation: United Nations Scientific Committee on the Effects of Atomic Radiation 2008 Report to the General Assembly, with Scientific Annexes, Volume I, Annex B. United NationsNew York