
ABSTRACT
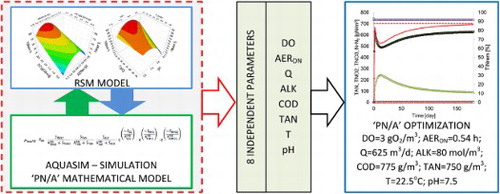
Optimization of a single-stage, partial nitritation/anammox (PN/A) process for a reject water treatment in a continuous-flow, moving bed biofilm reactor (MBBR) was presented. Response surface method (RSM) was combined with simulation experiments conducted with the validated mathematical model of PN/A in MBBR. The total inorganic nitrogen (TIN) removal efficiency was the response parameter. Eight independent variables were taken into consideration: reject water flow rate (Q), inflow concentrations of the total ammonium nitrogen (TAN), chemical oxygen demand (COD), alkalinity (ALK), pH, temperature (T), dissolved oxygen concentration in the bulk liquid (DO) and aeration time within 60 min intermittent aeration cycle (AERON). Eleven interactions between independent variables were found as significant (p < 0.05). The interaction of AERON*DO had the highest impact on the PN/A process. Optimal values of the controlled variables were found for two cases of MBBR operation. Verification of the optimization was done by the simulation and comparison with the data from the empirical experiments. Under the conditions of the fixed hydraulic retention time of about 38 h, volumetric nitrogen loading rate of 0.48 kgN/m3d, T of 22.5°C, TAN of 750 gN/m3 and optimized values of DO = 3.0 gO2/m3, AERON = 0.54 h, pH = 7.5, ALK = 80 molHCO3/m3, COD = 775 gO2/m3, the predicted TINrem was 78% which is consistent with PN/A performance observed in the technical-scale MBBR systems.
GRAPHICAL ABSTRACT
Introduction
Autotrophic deammonification of reject water after dewatering of the digested sludge, based on the partial nitritation (PN) and anammox (A) processes, is a wide-spreading technology at wastewater treatment plants (WWTPs). This is due to more stringent requirements of effluent nutrient limits and the need for efficient and sustainable sewage sludge handling option with proper utilization of by-products [Citation1–3]. Lackner et al. [Citation1] indicated that although more than 100 PN/A systems for reject water treatment are operated in the full technical scale, the process is not fully optimized and under control because its complexity originated from interrelations of variable biochemical processes and physical and chemical environmental factors. Mao et al. [Citation4] emphasize properly that ‘for the strict process control of a one-stage (partial nitritation/anammox) system, operational parameters and operational conditions of a one-stage system will be the key concern in the future’. Janiak et al. [Citation5] pointed to the risk of declining the mainstream effluent quality as the effect of the breakdown of reject water deammonification system. Optimization of the PN/A systems seems to become even more important due to the implementation of the advanced processes of anaerobic digestion (AD) of sewage sludge like, for example, integration of thermal hydrolysis process and AD, which is connected with a major increase in ammonium–nitrogen concentration in the reject water – up to 3000 mgN/l [Citation6].
Simulation of biotechnological systems, based on their mathematical models, is a valuable tool for getting knowledge on the mechanisms involved in the ongoing processes and predicting their outcomes. Although a complex system is described with a mathematical model, determining an optimal and realistic set of the process parameters (especially when their number is high) might cause difficulties. Catching the significant interactions between those parameters can be problematic. Hence the proper design of computational experiments is as much important as in the case of empirical analysis of an engineered biochemical system. The additional multivariate analysis of the results of simulations would be also required to gain more insight into the examined processes. It is proposed hereby to combine the response surface method (RSM) with numerical experiments to avoid the mentioned problems and optimize the PN/A process. As the effect, besides the base PN/A system description with its mathematical model, the higher level ‘pseudo-empirical’ model would be created, which would allow finding the optimal set of the technological parameters, simultaneously taking into account their interactive effects. It would make possible also to investigate more independent variables than it is usually done in the course of empirical studies because of economic reasons and time requirements. Gu et al. [Citation7] presented an analysis of the adsorption process for fluoride removal from water utilizing semi-mechanistic models and the RSM analysis to optimize the values of three process parameters. Integration of the mathematical models of biological wastewater treatment systems with the RSM method is a novel approach (to the best of our knowledge) and has not been applied before. Response surface method includes mathematical methods for experiment designing, building empirical models, assessing the sensitivity of many independent variables and their interrelationship, as well as gaining the optimal values of those parameters without losing their interactive impact on the defined response factor [Citation8]. Because the models developed with the RSM method are empirical, the mechanisms of the interconnected processes cannot be explained. However, linking it with the mechanistic mathematical models of those processes can fill this gap, so the combination of the RSM method and computational experiments based on mathematical models can be interesting, alternative techniques for analysing the complex wastewater treatment systems.
Response surface method has been applied to the optimization of water and wastewater treatment processes [Citation7–10]. RSM method has been also utilized to optimize the selected parameters of partial nitritation and/or anammox processes [Citation11–15]. All of those studies were fully empirical and/or included not more than three independent variables. In the studies described in this paper, eight independent variables of PN/A have been taken into consideration.
The purpose of the presented studies was to find the optimal set of the eight, independent process parameters for reject water PN/A in a single-stage, continuous flow, moving bed biofilm reactor (MBBR). To achieve this goal, numerical simulations were combined with the statistical design of experiments (DoE) and surface response modelling (RSM). Identified optimal values of the PN/A process parameters were verified by simulation with the validated mathematical model and comparison with the literature data.
Materials and methods
Evaluated MBBR-PN/A system
Continuous flow, fully mixed MBBR for reject water PN/A, was dimensioned based on the data regarding reject water quality and daily flow rates from municipal WWTP in Krosno, Poland. It was assumed that the bioreactor will be filled up to 50% of its volume with biofilm carriers with a specific surface area of 500 m2/m3. The main construction and technological parameters of the designed MBBR are presented in .
Table 1. Basic parameters of the MBBR under investigation and reject water quality.
Mathematical model of PN/A in MBBR and simulation software
Numerical studies of PN/A in the MBBR bioreactor were conducted with AQUASIM 2.1f computer program with the application of the Wanner and Reichert [Citation16] biofilm model and the validated, mathematical model of PN/A process in biofilm reactors [Citation17]. Detailed descriptions of the applied model structure with its parameter values and validation results have been presented by Trojanowicz et al. [Citation17].
Statistical DoEs and data analysis
Experiments were designed with the ‘central composite face centered’ method (CCFC, Box and Wilson [Citation18]). The selected method can be used for fitting quadratic models [Citation8, Citation11]. The planning of experiments was conducted with MODDE ver. 7.0.0.1 (software for Design of Experiments and Optimization) developed by UMETRICS. Three levels of each controlled variable were assumed (represented by −1, 0, 1 for low, centre and high level of the examined parameters values, respectively). Because experiments were numerical simulations, they were designed without any replication except three repetitions in the central point (see paragraph ‘Computer data analysis’). In total, 83 simulation-experiments were conducted.
Selection of the process parameters being optimized
Eight controlled parameters of the PN/A process were selected. They were as follows: reject water flow rate (Q), inflow concentrations of total ammonium nitrogen (TAN), chemical oxygen demand (COD), alkalinity (ALK), pH, temperature (T), dissolved oxygen concentration in the bulk liquid (DO) and aeration time within 60 min intermittent aeration cycle (AERON). The response factor was the efficiency of total inorganic nitrogen removal (TINrem). The ranges of the chosen controlled variables are shown in .
Table 2. Values of controlled variables utilized during experiments.
Numerical simulation set-up
The reactor compartment was set as the completely mixed system with a confined volume and biofilm area consistent with the designed MBBR (see ). The biofilm detachment was modelled as being the function of the growth velocity of biofilm (uF) and was calculated by the following formula: ‘if uF > 0 then uF*0.9 else 0 end if’. The input parameter values of the flow rate, inflow concentrations of ammonium nitrogen, chemical oxygen demand, alkalinity, pH and temperature were set in every conducted simulation in accordance with the values of controlled variables determined in the course of experiment planning (see paragraph ‘Statistical DoEs and data analysis’). Dissolved oxygen concentration values within the assumed aeration time intervals were prepared as the text file and imported to the AQUASIM in the form of ‘real-list variables’. Nitrite- and nitrate–nitrogen influent concentrations were assumed to be zero. Initial biomass concentrations and biofilm thickness were consistent with the settings for the reject water MBBR made by Trojanowicz et al. [Citation17].
The simulated time of the bioreactor operation for every numerical experiment was 93 days. The simulation's step size was one minute (134,006 steps of 0.000694 day for each simulation).
Computer data analysis
Values of the response parameters (TINrem) derived from the numerical simulations (corresponding to the given set of input values of the controlled variables for each simulation) were entered into MODDE computer program. Then multiple linear regression (MLR) model was utilized to fit the model. The next step was identification and elimination of the ‘outliers’ (data points with the difference between measured and predicted values of response parameters more than four times of standard deviation). Upon eliminating outliers, the model was fitted to the data derived from numerical experiments. To improve model validity, coefficient values were interpreted and some insignificant terms in the model were removed.
Because perfect simulation reproducibility (‘pure model error’ of zero) causes ‘artificial lack’ of the RSM model validity (‘estimated model error’ is higher than ‘pure model error’), root mean squared error (RMSE) of the PN/A mathematical model was used for estimating the values of the response factor (TINrem) from three repetitions of simulations in the central point. The values were as follows: simulated value of TINrem and TINrem ± RMSE. The RMSE value was calculated by Trojanowicz et al. [Citation17] in the course of validation of the PN/A model for reject water treatment and its mean value was used.
The goal of the last part of the analysis was to find the set of PN/A process parameters with optimal values. It was done with ‘optimizer’ tool in the MODDE program with the developed quadratic ‘RSM model’. The optimization target was maximizing the value of inorganic nitrogen removal efficiency (TINrem) in the designed MBBR reactor for autotrophic deammonification of reject water (see chapter ‘Evaluated MBBR-PN/A system’).
Verification of the PN/A process optimization
To verify the values of determined optimal parameters, the additional numerical experiment was conducted. The optimal parameters were entered as the input data to AQUASIM and the simulation was run, as it was described in Section ‘Statistical DoEs and data analysis’. The obtained result of the total inorganic nitrogen removal efficiency was compared with the predicted value of TINrem during process optimization.
Results
Experiments planning and simulation results
In Table A.1 the list of experiments planned with the CCFC method, together with values of the controlled variables and the response factor, is presented.
Model development with MLR
The values of the simulated TINrem were entered in the MODDE. Although no outliers were found by the program, to achieve higher model predictability, nine selected experiments (represented by data points which lay out of the straight line of the normal probability plot of the residuals) were excluded. Then the MLR analysis was used to fit the model. The model quality was good, what was represented by 97% of the model response variability explained and 79% of the variations predicted. After analysing the coefficient plot, the model was refined by eliminating the selected insignificant terms. As a result, the accuracy of the model predictions increased to 87%, while keeping the ability for explaining variations to 95%. The overall model validity value was (about 0.96) higher than the lowest acceptable value (0.25) (validity factor of 1.0 represents a perfect model). The validity of the developed model was confirmed by the high values of both ‘coefficient of determination (R2)’ and ‘adjusted R2’, whose values were 0.95 and 0.92, respectively. The ‘prediction of the model (Q2)’ of 0.87 was in close agreement with that of R2. The difference between Q2 and ‘adjusted R2’ of 0.05 was less than 0.20, which the value is recognized as the upper limit for the valid RSM model [Citation8]. ANOVA analysis proved that the model is significant (p < 0.0001) with an F-value of 33.98. The model validity was also demonstrated by insignificant ‘lack of fit test’ (p = 0.687) with an F-value of 0.84. Plot of the observed versus predicted response values is depicted in Figure C.1. High correlation factor (R = 0.97) and slope of the curve equal to 1 confirm the validity of the developed model, as well. The results of the ANOVA analysis are shown in Table B.2.
Impact of eight independent parameters on PN/A process performance
The significant (p < 0.05) first-order variables were AERON, DO, TAN, ALK, pH, Q, whereas the impact of temperature and influent COD was not identified as significant. Additionally, the following significant interactions between independent variables were found: AERON and DO; AERON and T; AERON and COD; AERON and Q; DO and ALK; DO and T; DO and Q; TAN and COD; ALK and Q; pH and T; T and Q. According to the model () the highest impact on PN/A efficiency has wastewater flow rate (Q), quadratic terms of AERON and Q, as well as the interaction between aerated period time (AERON) and dissolved oxygen concentration (DO). Interestingly, although temperature and COD are insignificant parameters in the examined range of values, significant interactions of T and DO, AERON, pH and Q were predicted. Similarly the interaction between COD and TAN was found as significant.
Figure 1. Scaled and centred model coefficients with 95% confidence interval.
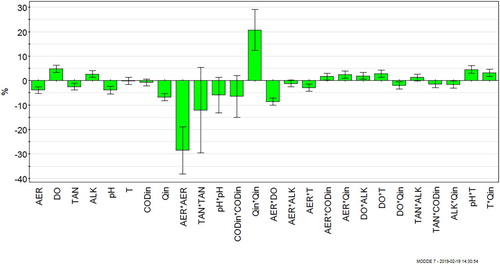
The model coefficients, estimated with MLR, together with their corresponding significance are presented in Table B.1.
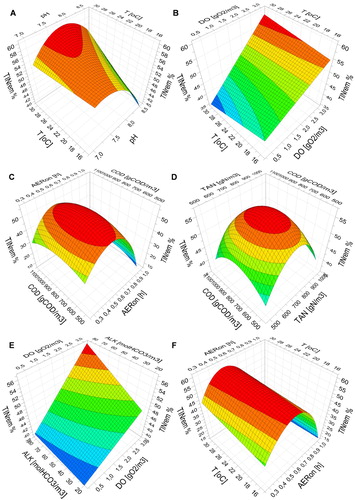
Analysing the sole impact of the selected process parameters (Figure D.1) we can see that maximum TINrem efficiency is predicted by the nearby centre-level values of AERON (0.5 h), TAN (750 gN/m3), pH (7.6) and COD (800 gO2/m3). Expected nitrogen removal efficiency increases linearly along with alkalinity (ALK) and dissolved oxygen (DO) concentrations. The maximum TINrem of about 73% is expected for the lowest considered value of influent flow rate (Q = 250 m3/d), while the minimum TINrem is predicted for the centre flow rate value of 750 m3/d (45%) and TINrem increases to 60% at a flow rate of 1000 m3/d. The latter result could be recognized as unexpected and it is hard to explain. At the centre-level values of all independent parameters TINrem efficiency is placed between 40% and 50%.
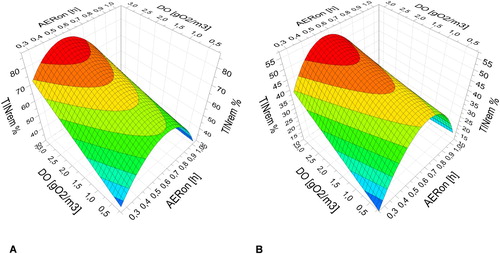
Considering the most significant interaction between process parameters, maximum nitrogen removal efficiency was predicted for the aerated phase duration (AERON) of about 30 min in one-hour intermittent aeration cycle and at the highest DO concentration (3 gO2/m3) at every, considered level of influent flow rate (Q) and temperature (T) (Figure E.1). Nitrogen removal efficiency increased along with temperature and dropped with the influent flow rate. The highest value was predicted for the Q = 250 m3/d and T = 30°C. However, for the parameter values assumed for the designed MBBR (), the predicted TINrem was below 50% (Figure D.1: T = 22.5°C, Q = 625 m3/d). It was much lower than the stoichiometric value of about 89%. Because of that in the next step of the studies, optimal values of the process parameters were found with the developed RSM model.
Determination of the optimal values of the selected process parameters for maximizing inorganic nitrogen removal efficiency
Optimal values of the controlled variables were found utilizing the MODDE program. Two cases were taken into account: (A) optimization of values of the complete set of the controlled variables; (B) optimization of values of those process parameters which could be adjusted in real MBBR system for reject water PN/A (pH, DO, AERON, ALK, COD) and with fixed values of other variables (Q, T, TAN). The fixed values of Q, T, TAN were consistent with the average values determined for a reject water in the WWTP Krosno, Poland (). The targeted TINrem value in the course of the optimization was 89% (stoichiometric level of PN/A process). The two sets of the optimal process parameters and the corresponding expected efficiency of nitrogen removal are shown in .
Table 3. Optimal values of the controlled variables calculated with the RSM model in MODDE.
The impact of DO concentration and the length of aerated phase (AERON) on nitrogen removal efficiency with optimized values of other parameters are presented in . Similarly as in the initial analyses (Figure E.1) the best process performance was expected when intermittent aeration is applied with approximately 30 min aeration combined with 30 min anoxic phase. The predicted efficiency of the optimized PN/A in the case B ((B)) increased to 57% and was close to the target value of 89% in the case A ((A)). In the latter case, it was a result of the determined, optimal flow rate value (Q) of 250 m3/d, substantially lower than that considered in the case B (750 m3/d). This generated differences between hydraulic retention times (HRT) and surface nitrogen loading rates (SNLR), which were 3.9 d and 0.75 gN/m2d in the case A and 1.3 d and 1.9 gN/m2d in the case B.
Figure 2. Impact of dissolved oxygen (DO) concentration and the length of aerated phase (AERON) on nitrogen removal efficiency: (A) optimized values of Q, pH, T, TAN, COD, ALK; (B) optimized values of pH, COD, ALK.
In the significant interactions between temperature (T) and DO, pH and Q are shown for a realistic case of MBBR operation ( – case B). Although T was not identified as a significant term in the RSM model (within the assumed value range) in combination with other parameters it substantially influences the PN/A process. In every instance, TINrem increases with T (). As it was previously shown (Figure D.1), an increase in DO concentration is related to the higher expected TINrem ((A) and 4(B)). The optimal values of pH were found between 7.2 and 7.8 and this range makes the TINrem increase along with temperature ((B) and 4(A)). The TINrem was lowered by the increased influent flow rate ((A,B)). It could be the effect of lowering HRT or growing SNLR. To find the answer of whether shortening of HRT or rising SNLR has more negative impact on PN/A process performance, the interrelationship between T and Q at three levels of influent TAN was calculated and traced ((C)). As it can be seen, at every of TAN concentration's level, the major drop of TIN removal efficiency (from above 70% to about 50–60%) along with an increase of Q occurs. It implies that HRT is probably a more important parameter than SNLR for the examined TAN range.
Figure 3. Interactions between temperature (T) and pH, DO and Q and their influence on nitrogen removal efficiency. All other parameters values are consistent with those presented in – case B.
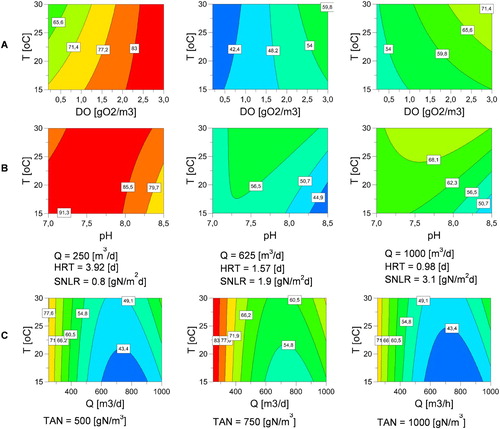
(C) shows the higher impact of aeration time than COD on PN/A process performance; however, the interactions between those two parameters are also important. A higher range of the optimal AERON values is placed in the COD section between 750 and 850 gO2/m3. There is also an optimal area of nitrogen removal efficiency for COD and influent ammonium nitrogen concentrations ((D)). Values of TAN between 700 and 800 gN/m3 interconnected with COD of about 700 and 900 gO2/m3 are characterized by the highest TINrem, whereas MBBR system response to the lower and upper extremes of both COD and TAN is a drop in nitrogen removal. The predicted nitrogen removal efficiency increases along with rising of the wastewater alkalinity (ALK) and DO in the bioreactor ((E)). There is also significant interaction between T and aeration time ((F)). The range of the optimal aeration time intervals broadens with the increase of temperature.
Figure 4. Interactions of: (A) T*pH; (B) T*DO; (C) COD*AERON; (D) COD*TAN; (E) ALK*DO; (F) T*AERON and their impact on nitrogen removal efficiency. All other parameter values are consistent with those presented in – case B.
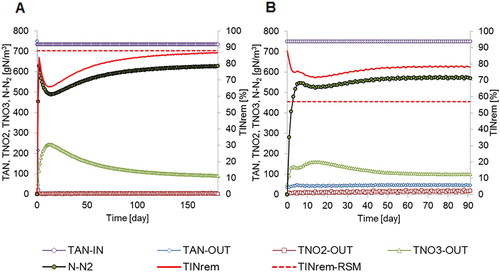
Verification of the optimization results
To verify the determined, optimal values of the process parameters for cases A and B, additional simulations were conducted. The parameters values consistent with those displayed in were entered and numerical experiments were conducted in the AQUASIM program. The predicted outflow concentrations of inorganic nitrogen species and total inorganic nitrogen removal efficiency are presented in . In the ‘case B’ the process stabilized after about 60 days and its calculated efficiency was about 78%. This value was even higher than that predicted with the RSM model (57%). Because steady state was not reached within 90 simulation days in the ‘case A’, the simulation was extended to 180 days ((A)). At the end of this period, TINrem stabilized at about 87% what was consistent with the value of 88%, predicted by the RSM model. The verified TINrem for the optimized PN/A process was higher than that calculated in the course of running the planned set of numerical simulations at the same HRT and SNLR (Table A.1). The process optimization with the use of the RSM model can be recognized as successful.
Figure 5. Verification of the ‘RSM model’ by numerical simulation of the optimized PN/A process in MBBR: (A) ‘case A’; (B) ‘case B’ of process optimization.
Discussion
Integrated mechanistic/RSM model of PN/A
The application of the ‘integrated mechanistic/RSM model of PN/A’ to analyse wastewater treatment process has been shown in the current studies. Thanks to this approach, a better understanding of the effect of interactions between independent variables on process performance and their significance was gained. At the same time mechanisms of the examined processes were not a ‘black-box’ as in the case of the sole RSM application or other techniques like an artificial neuronal network.
The economic reasons and time requirements, related to more experiments designed with RSM, were not limiting in the presented studies because numerical simulations in place of empirical experiments were utilized. Therefore, the first stage of the RSM procedure – factors screening was omitted in the current analysis. Factors selection was based on authors’ experience from long-term, laboratory and pilot-scale studies regarding one-stage PN/A process in MBBR reactors, earlier modelling studies and literature data [Citation11, Citation15, Citation17, Citation19]. The proper selection of the value range of the chosen factors was based on the data regarding reject water quality, quantity and the variability of those values (). Centre-point values of each selected variable were close to the determined average values of the parameters (within the standard deviation range).
Optimal values of the PN/A parameters
It was confirmed that the predictions made by numerical simulations and the set of the process parameter values, optimized with the ‘higher-level’ RSM model, could explain the performance of a single-stage MBBR system for a reject water deammonification. A comparison of the optimal values of PN/A process parameters for the MBBR system being analysed with the data from experimental studies on reject water deammonification is presented in . As it was shown the predicted nitrogen removal efficiency of 78% is consistent with the values from empirical studies, ranging from 64% to 88%. Szatkowska et al. [Citation19] and Yang et al. [Citation20] achieved the average TINrem of 70 ± 9.2 and 76.3 ± 3.1%, respectively in the MBBRs operated under pH, T, DO, HRT and VNLR values which were very close to those found as the optimal in the current studies. The volumetric nitrogen removal rate (VNRR) of 0.583 kgN/m3d, observed in the reject water deammonification – FFBR system, operated at temperature of about 22°C by Pyanert et al. [Citation21] was also comparable with the achieved results. Higher values of VNRR recorded by other authors () were usually connected with PN/A process operation at a temperature higher than 22.5°C.
Table 4. Comparison of the predicted performance of the optimized, single-stage PN/A process in a MBBR for reject water deammonification with data from experimental studies.
Aeration interval (AERON) and dissolved oxygen concentration (DO)
The most significant and dominant process parameter and interaction found in the course of the current modelling studies were an interval of aeration time within hourly intermittent aeration cycle and the interaction between AERON and DO, respectively. Those parameters are repeatedly reported by many researchers as having a major impact on reject water PN/A. The highest TINrem of 91.3% was achieved at DO of 3.0 gO2/m3 and T of 35°C by Zhou et al. [Citation13] and was kept at 88.7% at 19.2°C by lowering DO to 2.6 gO2/m3 and VNLR from 0.6 to 0.35 gN/m3d. Cema et al. [Citation27] showed the highest VNRR in a MBRR system operated at DO of 3.0 gO2/m3 during batch tests and at about 2.5 gO2/m3 under VNLR of 1.9 gN/m2d in a pilot-scale system. In the temperature range from 16°C to 19°C the best PN/A process performance was achieved by Sultana et al. [Citation28] under conditions of DO from 1.2 to 1.5 gO2/m3. Application of an intermittent aeration with an aerated phase of about 20 min in an hourly cycle and with DO of 4 gO2/m3 led to the high VNRR of 3.4 gN/m2d and TINrem of 69.5% in the lab-scale MBBR for reject water deammonification by Zubrowska-Sudoł et al. [Citation29]. The same authors observed the nitrogen removal rate of 1.5 gN/m2d when the aeration interval of 30 min was applied. High DO concentrations of about 3–4 gO2/m3 were applied in the full-scale MBBR system [Citation30]. Similarly, Rosenvinkel and Cornelius [Citation31] reported 80% removal efficiency gained in the full-scale MBBR system under DO up to 4 gO2/m3. Keeping DO between 0.9 and 1.2 gO2/m3 allowed achieve high ammonium removal efficiency in a ‘hybrid air-lift shaft reactor’ with aerobic and anoxic zones [Citation32]. In a completely mixed ‘activated sludge/immobilized activated sludge’ bioreactor with an additional treatment of recirculated activated sludge, optimal DO was determined at the lower level of 0.6 ± 0.2 gO2/m3 [Citation33]. The lower optimal values of DO might have been related to lower diffusional limitations of oxygen into activated sludge than those of biofilm. Lackner et al. [Citation1] described the failures of aeration systems and their control units as the frequent causes of PN/A process perturbations. Aeration strategy was indicated by Lackner et al. [Citation34] as the major factor for stable PN/A process in the full-scale SBR for reject water treatment.
Reaction-pH
The value of pH in the bulk liquid of the MBBR system was found as another process parameter with the high significance (p = 6.1 × 10⁻⁶). Optimal pH values found in the course of the process optimization were 7.8 and 7.5 for case A and B, respectively (). The predicted values were consistent with those recorded in the efficient biofilm systems for reject water PN/A () ranging from 7.2 to 7.8. It should be emphasized that the mathematical model of PN/A in MBBR [Citation17] applied in the course of the presented studies considers only the indirect impact of pH on deammonification process performance. It is related to the changes in free ammonia (FA) and free nitrous acid (FNA) concentrations, which are in the model the real substrates for autothrophic growth and main process inhibitors (depending on their concentrations in the system). The results of these studies proved that such a description of pH influence on PN/A was sufficient for finding the optimal pH ranges, which were fully consistent with those found in the course of empirical studies by other authors (). This implies that the major role of pH in deammonification systems is derived from controlling FA and FNA concentration in the bioreactors. A similar range of the optimal pH values (7–8) was presented by Van Hulle et al. [Citation35], who also explained its impact as an influence on the equilibria between free and ionized form of ammonium- and nitrite–nitrogen. Physiological pH range for anammox and ammonium oxidizing bacteria of 6.7–8.3 and 6.5–8.0, respectively, was presented by Strous et al. [Citation36] and Van Hulle et al. [Citation37] as optimal. Lackner et al. [Citation1] presented the pH adjustment to 7.0–7.5 (with NaOH) as the measure for controlling deammonification in the rotating biological contactor (OLAND-RBC). From the other side, the values of pH lower than 6.8 and higher than 8.0 were shown as the causes of PN/A process disturbances [Citation1]. The operation of the PN/A process under pH of 7.47 and 7.8 was presented by Leix et al. [Citation14] as the maximizing nitrogen removal and decreasing N2O emissions, respectively. It was also advised that the pH set-point value in the bioreactor of 7.5 should be applied, which promotes high efficiency of both partial nitritation and anammox process.
Alkalinity (ALK)
The determined optimal value of alkalinity (ALK) was 74 molHCO3/m3 at influent total ammonium nitrogen (TAN) concentration of 734 gN/m3 (, case A) and 80 molHCO3/m3 at TAN concentration of 750 gN/m3 (, case B). It means that the predicted, optimal molar ratio between ALK and TAN in the influent (ALK/TAN ratio) was 1.4 and 1.5 for case A and B, respectively. Van Hulle et al. [Citation35] explained that to neutralize the acidifying partial nitritation process about 1 mol of bicarbonate is necessary per mol of ammonium. The calculated values with the RSM model, optimal values of ALK/TAN ratio for both cases of process optimization are fully consistent with the considerations presented above. It is another evidence of correctness of both the applied mathematical model structure of PN/A [Citation17] and the predictions of the developed RSM model in this study. Lackner et al. [Citation1] gave the example of disturbances of deammonification in SBR as the effect of insufficient alkalinity in the treated reject water. Another aspect regarding alkalinity is the proper concentration of inorganic carbon – one of the main substrates for autotrophs. It was emphasized by Wett and Rauch [Citation38] with regard to CO2 stripping as the effect of a low pH. It must be explained that the applied PN/A model does not take into account equilibria between ionized and free form of inorganic carbon in the bulk liquid: however, inorganic carbon (stated as ALK) is in the model expressed as one of the process substrates, which is utilized by AOB and AnAOB bacteria.
Influent flow rate (Q)
As it was earlier explained, an influent flow rate (Q) affects mainly PN/A by changing HRT rather by increasing VNLR (see paragraph ‘Determination of the optimal values of the selected process parameters for maximizing inorganic nitrogen removal efficiency’). A decrease in the efficiency of nitrogen removal was anticipated along with a decrease of HRT from about 94 h to 23.5 h. Values of applied HRT during empirical studies in the range from 24 to 58.8 h were connected with the high nitrogen removal rates and process efficiency (). In this study, the predicted efficiency of TINrem in the course of the process optimization with RSM and its verification by simulation was about 78% for the assumed HRT of 37.6 h. In the full-scale PN/A systems for reject water treatment HRT is from 1 to 5 days [Citation1]. Values of HRT higher than 12 h were shown by Veys et al. [Citation39] as the factor for assurance for high nitrogen removal efficiency. It was also confirmed that high VNLR (at TAN concentration up to 1000 gN/m3) was reflected by the good performance of the system. High VNRR rate of 1.5 kgN/m3d was also reached by Slieckers et al. [Citation40] at high HRT of 10 days (under high TAN of 1550 gN/m3). Tsushima et al. [Citation41] have shown the nitrogen removal efficiency declines along with HRT shortening; however, at the same time an increase of VNRR was recorded.
Mutual interactions of the PN/A process parameters
The most important feature of the determined optimal values of the eight independent process parameters, presented in , is their interconnection. Those interrelationships were taken into account, while the optimized values were calculated. In the available literature, some empirical studies regarding PN/A process optimization for reject water treatment can be found. However, none of them considered such an extended set of the independent variables as was taken into examination in this study. Optimum values of the temperature and pH of 30°C and 7.0, respectively, were found earlier by Fernández et al. [Citation11] with the use of the RSM method and DoE for the anammox process. Interactions between DO, T and VNLR were identified as significant by Zhou et al. [Citation13]. The best efficiency of TIN removal was gained at 35°C, DO of 3.0 gO2/m3 at VNLR of 0.7 kgN/m3d. DoE method linked with empirical, laboratory scale studies and response surface method (RSM) were applied by Leix et al. [Citation14] to examine the combined effect of pH, feeding and aeration strategy on the deammonification process in bioreactors with suspended biomass. The highest effect on VNRR had aeration and pH. Interaction of pH and aeration was also found as significant. Applications of intermittent aeration with aerated and non-aerated phases of 5.5 and 6.5 min, respectively, and pH of about 7.5 were found as optimal. Under such conditions, VNRR of about 0.49 kgN/m3d was recorded, which is similar to the currently obtained results. The RSM method was utilized by Zhou et al. [Citation13] to find the interactions between T, DO and VNLR for the PN/A process in laboratory-scale sequencing batch biofilm reactor (SBBR). Significant interactions between DO and T; NLR and T were shown. Optimal DO was 2.7 gO2/m3 at T = 22°C when VNLR was 0.7 kgN/m3d with the corresponding TINrem of 80% and the predicted TINrem decreased to 50% at DO = 1.0 gO2/m3. Those values are again comparable and close to those presented in this study. It was shown that the effect of increased ratio between COD and TAN in the influent (COD/TAN) was the higher TIN removal efficiency by amplifying heterotrophic denitrification [Citation39]. Predicted nitrogen removal efficiency in the range of COD/TAN from 0.25 to 2.0 was about 80%. In the studies presented in this paper, the optimal ratio between COD/TAN was about 1.0 for both cases A and B and the corresponding TIN removal efficiency of 87% and 78%, respectively ().
Conclusions
The response surface methodology (RSM), combined with simulation experiments, was applied for optimization of the single-stage PN/A process for the reject water treatment in MBBR.
The presented method allowed taking into consideration the impact of the eight independent variables on PN/A process performance. Eleven interactions between process parameters were identified.
Development of the higher level, ‘pseudo-empirical’ surface response model of the PN/A was possible with the described procedure. It makes mathematical modelling of the PN/A in MBBR more feasible for practical and scientific application.
Implementing the presented methodology, a new level of information is gained what would not be possible with separate use of simulation experiments or RSM.
20191126_Trojanowicz_Plaza_Supplement_Combining....docx
Download MS Word (849.6 KB)Disclosure statement
No potential conflict of interest was reported by the authors.
ORCID
Karol Trojanowicz http://orcid.org/0000-0003-4234-391X
References
- Lackner S, Gilbert EM, Vlaeminck SE, et al. Full-scale partial nitritation/anammox experiences – an application survey. Water Res. 2014;55:292–303. doi: 10.1016/j.watres.2014.02.032
- UE Urban Waste Water Directive. Council Directive of 21 May 1991 concerning urban waste water treatment (91/271/EEC). J Eur Commun; 34:40.
- Bugajski P, Chmielowski K, Kaczor G. Reliability of a collective wastewater treatment plant. J Ecol Eng. 2016;17(4):143–147. doi: 10.12911/22998993/64505
- Mao N, Ren H, Geng J, et al. Engineering application of anaerobic ammonium oxidation process in wastewater treatment. World J Microbiol Biotechnol. 2017;33(8):153. doi: 10.1007/s11274-017-2313-7
- Janiak K, Miodoński S, Muszyński-Huhajło M. Failure of the side-stream deammonification process. risk of violation of the WWTP effluent quality. Environ Prot Eng. 2018;44(2).
- Zhang Q, Vlaeminck SE, DeBarbadillo C, et al. Reject water organics from anaerobic digestion after thermal hydrolysis cause direct and/or diffusional activity loss for nitritation and anammox. Water Res. 2018;143:270–281. doi: 10.1016/j.watres.2018.06.037
- Gu BW, Lee CG, Park S. Application of response surface methodology and semi-mechanistic model to optimize fluoride removal using crushed concrete in a fixed-bed column. Environ Technol. 2018;39(5):616–627. doi: 10.1080/09593330.2017.1309074
- Nair A, Makwana AR, Ahammed MM. The use of response surface methodology for modelling and analysis of water and wastewater treatment processes: a review. Water Sci Technol. 2014;69(3):464–478. doi: 10.2166/wst.2013.733
- Mosaddeghi MR, Pajoum Shariati F, Vaziri Yazdi SA, et al. Application of response surface methodology (RSM) for optimizing coagulation process of paper recycling wastewater using Ocimum basilicum. Environ Technol. 2018: 1–9. DOI:10.1080/09593330.2018.1491637.
- Marzouk Trifi I, Trifi B, Ben Souissi E, et al. Response surface methodology for dyes removal by adsorption onto alginate calcium. Environ Technol. 2019;2019:1–10. DOI:10.1080/09593330.2019.1612470.
- Fernández I, Plaza E, Trela J, et al. Evaluation of deammonification process by response surface models. Water Air Soil Pollut. 2011;215(1-4):299–309. doi: 10.1007/s11270-010-0479-9
- Xing BS, Guo Q, Zhang ZZ, et al. Optimization of process performance in a granule-based anaerobic ammonium oxidation (anammox) upflow anaerobic sludge blanket (UASB) reactor. Bioresour Technol. 2014;170:404–412. doi: 10.1016/j.biortech.2014.08.026
- Zhou J, Qin G, Zhang J, et al. Study on the mutual interactions between the parameters of a CANON system and its coping strategy when operating at room temperature (15 to 25° C) using response surface methodology. Water Sci Technol. 2014;69(9):1805–1812. doi: 10.2166/wst.2014.062
- Leix C, Drewes JE, Ye L, et al. Strategies for enhanced deammonification performance and reduced nitrous oxide emissions. Bioresour Technol. 2017;236:174–185. doi: 10.1016/j.biortech.2017.03.182
- Gut L, Plaza E, Hultman B. Assessment of a two-step partial nitritation/anammox system with implementation of multivariate data analysis. Chemom Intell Lab Syst. 2007;86(1):26–34. doi: 10.1016/j.chemolab.2006.08.004
- Wanner O, Reichert P. Mathematical modeling of mixed-culture biofilms. Biotechnol Bioeng. 1996;49(2):172–184. doi: 10.1002/(SICI)1097-0290(19960120)49:2<172::AID-BIT6>3.0.CO;2-N
- Trojanowicz K, Plaza E, Trela J. Model extension, calibration and validation of partial nitritation–anammox process in moving bed biofilm reactor (MBBR) for reject and mainstream wastewater. Environ Technol. 2019;40(9):1079–1100. doi: 10.1080/09593330.2017.1397765
- Box GE. The exploration and exploitation of response surfaces: some general considerations and examples. Biometrics. 1954;10(1):16–60. doi: 10.2307/3001663
- Szatkowska B, Cema G, Plaza E, et al. A one-stage system with partial nitritation and anammox processes in the moving-bed biofilm reactor. Water Sci Technol. 2007;55(8-9):19–26. doi: 10.2166/wst.2007.237
- Yang J. The deammonification process in moving bed biofilm reactors [PhD thesis]. TRITA LWR PHD-2016:05; 2016.
- Pynaert K, Smets BF, Beheydt D, et al. Start-up of autotrophic nitrogen removal reactors via sequential biocatalyst addition. Environ Sci Technol. 2014;38(4):1228–1235. doi: 10.1021/es030081+
- Vlaeminck SE, Terada A, Smets BF, et al. Nitrogen removal from digested black water by one-stage partial nitritation and anammox. Environ Sci Technol. 2009;43(13):5035–5041. doi: 10.1021/es803284y
- Christensson M, Ekström S, Chan AA, et al. Experience from start-ups of the first ANITA Mox plants. Water Sci Technol. 2013;67(12):2677–2684. doi: 10.2166/wst.2013.156
- Beier M, Schneider Y. Abschlussbericht Entwickelung von Bilanzmodellen für die Prozesse Deammonifikation und Nitritation zur Abbildung gross-and halb-technischer Anlagen (Final report development of balance models for deammonification and nitritation processes to illustrate full and half technical scale installations). Hannover: Leibniz University Hannover; 2008; 39.
- Malovanyy A, Yang J, Trela J, et al. Combination of upflow anaerobic sludge blanket (UASB) reactor and partial nitritation/anammox moving bed biofilm reactor (MBBR) for municipal wastewater treatment. Bioresour Technol. 2015;180:144–153. doi: 10.1016/j.biortech.2014.12.101
- Yang J, Trela J, Zubrowska-Sudol M, et al. Intermittent aeration in one-stage partial nitritation/anammox process. Ecol Eng. 2015;75:413–420. doi: 10.1016/j.ecoleng.2014.11.016
- Cema G, Płaza E, Trela J, et al. Dissolved oxygen as a factor influencing nitrogen removal rates in a one-stage system with partial nitritation and anammox process. Water Sci Technol. 2011;64(5):1009–1015. doi: 10.2166/wst.2011.449
- Sultana R, Plaza E, Wilén BM. Influence of dissolved oxygen concentration on one stage deammonification operated at different temperatures. Proceedings from IWA Specialist Conference - Global Challenges: sustainable wastewater treatment and Resource Recovery; 26–30 October 2014, Kathmandu, Nepal.
- Zubrowska-Sudol M, Yang J, Trela J, et al. Evaluation of deammonification process performance at different aeration strategies. Water Sci Technol. 2011;63(6):1168–1176. doi: 10.2166/wst.2011.356
- Gustavsson DJI. Biological sludge liquor treatment at municipal wastewater treatment plants – a review. Vatten. 2010;66(3):179–192.
- Rosenwinkel KH, Cornelius A. Deammonification in the moving-bed process for the treatment of wastewater with high ammonia content. Chem Eng Technol. 2005;28(1):49–52. doi: 10.1002/ceat.200407070
- Hosseinpour B, Saborimanesh N, Yerushalmi L, et al. Start-up of oxygen-limited autotrophic partial nitrification-anammox process for treatment of nitrite-free wastewater in a single-stage hybrid bioreactor. Environ Technol. 2019: 1–9. DOI:10.1080/09593330.2019.1649467.
- Nikolaev Y, Kallistova A, Kevbrina M, et al. Novel design and optimisation of a nitritation/anammox set-up for ammonium removal from filtrate of digested sludge. Environ Technol. 2018;39(5):593–606. doi: 10.1080/09593330.2017.1308442
- Lackner S, Thoma K, Gilbert EM, et al. Start-up of a full-scale deammonification SBR-treating effluent from digested sludge dewatering. Water Sci Technol. 2015;71(4):553–559. doi: 10.2166/wst.2014.421
- Van Hulle SW, Vandeweyer HJ, Meesschaert BD, et al. Engineering aspects and practical application of autotrophic nitrogen removal from nitrogen rich streams. Chem Eng J. 2010;162(1):1–20. doi: 10.1016/j.cej.2010.05.037
- Strous M, Kuenen JG, Jetten MS. Key physiology of anaerobic ammonium oxidation. Appl Environ Microbiol. 1999;65(7):3248–3250. doi: 10.1128/AEM.65.7.3248-3250.1999
- Van Hulle SW, Volcke EI, Teruel JL, et al. Influence of temperature and pH on the kinetics of the Sharon nitritation process. J Chem Technol Biotechnol. 2007;82(5):471–480. doi: 10.1002/jctb.1692
- Wett B, Rauch W. The role of inorganic carbon limitation in biological nitrogen removal of extremely ammonia concentrated wastewater. Water Res. 2003;37(5):1100–1110. doi: 10.1016/S0043-1354(02)00440-2
- Veys P, Vandeweyer H, Audenaert W, et al. Performance analysis and optimization of autotrophic nitrogen removal in different reactor configurations: a modelling study. Environ Technol. 2010;31(12):1311–1324. doi: 10.1080/09593331003713685
- Sliekers AO, Third KA, Abma W, et al. CANON and anammox in a gas-lift reactor. FEMS Microbiol Lett. 2003;218(2):339–344. doi: 10.1016/S0378-1097(02)01177-1
- Tsushima I, Ogasawara Y, Kindaichi T, et al. Development of high-rate anaerobic ammonium-oxidizing (anammox) biofilm reactors. Water Res. 2007;41(8):1623–1634. doi: 10.1016/j.watres.2007.01.050