
 ?Mathematical formulae have been encoded as MathML and are displayed in this HTML version using MathJax in order to improve their display. Uncheck the box to turn MathJax off. This feature requires Javascript. Click on a formula to zoom.
ABSTRACT
Granular sludge processes are frequently used in domestic and industrial wastewater treatment. The granule buoyant density and biomass density are important parameters for the design and operation of granular sludge reactors. Different methods to measure the granule density include the pycnometer method, the Percoll density gradient method, the dextran blue method, and the settling velocity method. In this study, a comparison was made between these four methods to measure granule density for granules from a full-scale granular sludge plant treating domestic sewage. The effect of salinity on granule density was assessed as well. Three out of the four evaluated methods yielded comparable results, with granule buoyant densities between 1025.7 and 1028.1 kg/m3 and granule biomass densities between 71.1 and 71.5 g/L (based on volatile suspended solids (VSS)). The settling velocity method clearly underestimated the granule density, due to the complex relation between granule properties and settling velocity. The pycnometer method was the most precise method, but it was also quite susceptible to bias. The granule buoyant density increased proportionally with salinity, to 1049.2 kg/m3 at 36 g/L salinity. However, the granule biomass density, based on VSS, remained constant. This showed that the granule volume was not affected by salinity and that the buoyant density increase was the result of diffusion of salts into the granule pores. Overall, the granule density can be measured reliably with most methods, as long as the effect of salinity is considered. The results are discussed in light of operational aspects for full-scale granular sludge plants.
GRAPHICAL ABSTRACT
1. Introduction
Granular sludge processes are popular technologies for domestic and industrial wastewater treatment. The granules that are used in these technologies are compact microbial aggregates with excellent settling properties [Citation1,Citation2]. Aerobic granular sludge (AGS) is a recently introduced technology for the removal of organic carbon and nutrients from domestic and industrial wastewaters [Citation3]. The biomass concentration in granular sludge reactors is very high (8–15 g/L), made possible by the high biomass density and excellent settling properties of the granules [Citation4]. As a result, AGS has a small footprint and a low energy demand compared to conventional municipal wastewater treatment technologies [Citation5].
An important parameter for the AGS process is the density of the granules. In fact, there are two related parameters which are both referred to as granule density. The first parameter is the buoyant granule density, also called the wet granule density. It is defined as the granule mass per unit volume, where the mass includes all components that make up the granule (microbial cells, extracellular polymeric substances (EPS), water, precipitates, etc.). The buoyant density of granules is reported in the range of 1005–1070 kg/m3 [Citation6–Citation8]. The buoyant density of a granule relates to the hydrodynamics in the granular sludge reactor. The settling velocity of a granule can be estimated from its size and density through a force balance [Citation9]. Thus, the buoyant density is an important parameter for the design of reactor hydrodynamics, for the granule bed settling and stratification, and for the selection of granular biomass over flocculent biomass.
The second parameter which is referred to as granule density is the granule biomass density, also referred to as dry granule density. This parameter is defined as the mass of dry solids (total or volatile) per granule volume. The biomass density is reported in the range of 50–100 gVSS/L [Citation10,Citation4,Citation11]. The biomass density influences the diffusion of substrates into the granules, as a higher fraction of cells and EPS limits the diffusing molecules more [Citation12–Citation14]. Furthermore, models of the granular sludge process generally require the maximum biomass density as an input [Citation15–Citation17]. This maximum density leads to competition for space between different organisms and it determines the maximum conversion rates per granule volume. Thus, an accurate determination of the biomass density is an important step in the study of conversions in AGS.
The granule density can be measured with several methods: the pycnometer method [Citation18], the Percoll density gradient method [Citation6,Citation19], the dextran blue method [Citation20], and a method based on settling velocity measurements [Citation21]. All four methods yield the buoyant density, but only the pycnometer method and the dextran blue method determine the biomass density. It is not clear to what extent these methods are comparable and there is no standard method available for the measurement of granular sludge density. This makes it difficult to compare the outcomes of studies that used different methods. Furthermore, the granule density is commonly measured in a physiological saline solution with the Percoll density gradient method, but in freshwater with the other methods. The effect of salinity on the granule density is not reported or discussed. In practice salinity can vary over time, for example, due to seawater intrusion in coastal wastewater treatment plants. This could play a role in the settling properties of granules and the design of these installations. Therefore, the goal of this study was to compare the granule density methods and to quantify the effect of salinity on the granule density.
2. Methodology
2.1. Source of granules
Aerobic granules were harvested from the municipal wastewater treatment plant in Utrecht, The Netherlands. The treatment plant was designed by Royal HaskoningDHV under the trade name Nereda®. The granules were sieved with tap water to retain granules with a diameter between 1600 and 2500 µm. This fraction was used due to its abundance in the reactor. The granules were stored in tap water at 4°C for up to two weeks. No changes in granule density were observed during this period.
2.2. Comparison of methods
All density measurements were carried out at room temperature (20.0 ± 0.5°C).
2.2.1. Pycnometer method
The pycnometer method was carried out as described by Torfs et al. [Citation18]. Briefly, excess water was removed from a granule sample by spreading out the granules over a sieve with 200 µm mesh and briefly dabbing from underneath the sieve with a paper towel. Next, the granules were transferred into a calibrated pycnometer with a volume of 100 mL (Vpycnometer) and certain empty weight (Wpycnometer,empty). The weight of the pycnometer with added granules was recorded (Wpycnometer,withgranules). Typically, 20–25 g of granules (wet weight) was used in each pycnometer experiment. The pycnometer was filled with tap water and the weight of the full pycnometer was determined (Wpycnometer,full). The buoyant density was calculated based on the density of tap water (ρH2O):
(1)
(1) Subsequently, the entire granule sample was subjected to total suspended solids (WTSS) and volatile suspended solids (WVSS) determination according to Standard Methods [Citation22]. The biomass densities were calculated as follows:
(2)
(2)
(3)
(3) The pycnometer method was carried out in triplicate. An additional experiment was performed, in which the step to remove excess water from the granules was changed. Instead of spreading granules on a sieve and dabbing them from underneath, excess water was removed by (1) placing the granules directly on a paper towel or (2) placing the granule sample in a beaker and pouring off excess water. The remaining procedure was unaltered.
2.2.2. Percoll density gradient method
The Percoll density gradient method was carried out as described in Etterer and Wilderer [Citation6]. Briefly, a number of granules (15–25) were placed in a 10 mL plastic tube containing 3 mL Percoll solution (GE Healthcare) and 7 mL tapwater. Marker beads (Cospheric LLC) were added with densities of 1020 and 1040 kg/m3. The plastic tubes were subjected to centrifugation at 15,000 x g in a Sorvall ST 16R centrifuge (Thermo Fisher Scientific) for 120 min in a non-swing out rotor (25° pitch angle). A slow deceleration (requiring approximately 20 min) was applied to preserve the density gradient and the position of the granules. The density gradient was photographed together with a ruler to determine the position of the density markers beads and the granules with ImageJ software [Citation23]. The measurement was repeated 6 times to determine two descriptors of the precision of this method: the standard deviation of the density of all granules individually (n ≈ 120) and the standard deviation of the average density in each tube (n ≈ 6).
2.2.3. Modified dextran blue method
The modified dextran blue method is based on Beun et al. [Citation20]. The method uses a molecule that is called ‘blue dextran 2000’, which has a molecular weight of 2 MDa. It is excluded from the granules due to its large size [Citation24,Citation25]. If a solution of dextran blue with known volume and known concentration is added to a granule sample, the dextran blue will be diluted by the liquid between the granules. The liquid volume in the granule sample can thus be estimated by measuring the dextran blue concentration after dilution. The granule volume follows if the total volume is known as well. The procedure, with modifications, consisted of the following steps:
A granule sample was poured with water into a 200 mL beaker to obtain a settled bed volume of roughly 125 mL. Next, the granule sample was transferred to a pre-weighted 200 mL volumetric flask (Wflask,empty). Hereafter, the flask was filled completely with tap water and the full weight was recorded (Wflask,full). Subsequently, the granules were transferred to a 500 mL beaker for the dextran blue volume measurement. The weight of the emptied volumetric flask (Wflask,emptied) was used to correct for the small volume of liquid remaining in the volumetric flask after transferring the granules.
The 500 mL beaker with granule sample was placed on a scale and its weight was recorded at each of the following steps. First, the initial weight was recorded. Next, approximately 50 mL of water was removed from the beaker. Then, approximately 150 mL of a dextran blue solution (2 g/L) was added to the beaker. The beaker contents were mixed gently with a stir rod, left for 10 min, and mixed again. After the granules had settled, approximately 100 mL of liquid was removed, from which a fraction was stored for analysis (sample 1). The volume removed was replaced by tap water. After mixing, waiting 10 min, mixing, and settling, again approximately 100 mL of liquid were removed (sample 2) and replaced by tap water. This step was repeated once more to obtain a total of three samples, each at a different dilution. The dextran blue stock solution and the samples were filtered with 0.45 µm PVDF filters and their absorbance was determined with a spectrophotometer (Genesys 6, Thermo Fisher Scientific) at 620 nm, in triplicate.
The granules were washed with tap water to remove the dextran blue. The entire granule sample was subject to determination of total suspended solids (WTSS) and volatile suspended solids (WVSS) according to Standard Methods [Citation22].
The first step was added to the original method to allow the determination of the buoyant granule density. Furthermore, four main modifications were made to improve the precision. First, the concentration of the stock dextran blue solution was increased from 1 to 2 g/L. This avoids measurements in the lower detection range of the spectrophotometer (<0.2 absorbance). Second, the volumes of dextran blue stock, sample, etc. were determined precisely by recording the weight of the beaker at each step. Third, a 10 min waiting period was introduced to allow dextran blue to diffuse into any boundary layers or granule macropores. Lastly, the samples were all filtered prior to the absorbance measurement to remove any particulates that might interfere with the measurement.
The dextran blue was diluted in three steps. Therefore, three mass balances could be made, based on the concentrations of dextran blue and the total volume (liquid and granules) for each dilution step:
(4)
(4)
(5)
(5)
(6)
(6) Here, VDextranBlue = volume of dextran blue stock added, CDextranBlue = concentration of dextran blue in the stock solution VTotal,i = total volume (liquid and granules) at step i (i = 1, 2, 3), and Ci = concentration of dextran blue in sample i (i = 1, 2, 3).
The total volume at each step was deduced from the initial volume (200 mL in a volumetric flask) and the volumes of liquid added and removed (measured by weight and converted to volume with the liquid density). The only unknown in each mass balance was the granule volume and thus, three estimates of the granule volume were obtained.
The final granule volume was taken as the average of the three measurements. The wet weight of the granules was determined based on the weight of the granules and water inside the 200 mL volumetric flask (step 1 of the protocol) and the weight of the water inside the flask:
(7)
(7) The weight of the water was not measured directly, but it can be deduced from the total volume of the volumetric flask (200 mL), the volume of the granules in the flask (Vgranules, determined from the dextran blue dilution), and the density of tap water (ρH2O):
(8)
(8) The weight of the granules and the volume of the granules can subsequently be combined to yield the buoyant density:
(9)
(9) The biomass densities can be determined straight-forward from the total or volatile suspended solids and the granule volume:
(10)
(10)
(11)
(11) The modified dextran blue method was carried out in triplicate.
2.2.4. Settling velocity method
The terminal settling velocity of individual granules was measured by placing a single granule in the middle of a measuring cylinder with an internal diameter of 7.94 cm and a height of 42.1 cm. A camera (GoPro Hero Session 4) was used to record the settling and extract settling velocities. The settling on the boundaries of the camera image was ignored to reduce distortion effects and to ensure the granule had reached its terminal settling velocity. The experiment was carried out at room temperature with 150 granules from the 1600–2500 µm fraction. Approximately 500 granules from this size fraction were also analysed with a digital microscope (Keyence VHX-700F) and ImageJ software [Citation23]. The circular equivalent diameter derived from the microscope images was used to obtain a granule size distribution and an average granule diameter. From the measurement of terminal settling velocity and diameter of the granules, the particle Reynolds number (Re) can be calculated:
(12)
(12) Here, µ = dynamic viscosity of the fluid (1.002 10−3 kg m−1 s−1), vt = terminal settling velocity of the granule (m s−1), ρl = density of the liquid (998.23 kg m−3), and davg = average granule diameter (m).
Since the particle Reynolds numbers were in the transitional regime (Reynolds numbers of 0.01–1000), the correlation of Khan and Richardson [Citation26]) was used to calculate the drag coefficient (Cd):
(13)
(13) A force balance on a settling granule leads to the following expression of the terminal settling velocity:
(14)
(14) Here g = gravitational acceleration (m s−2) and ρg = granule density (kg m−3).
Since the granule density is the only remaining unknown, this parameter can be estimated directly. The standard deviation of the granule density was estimated through a Monte Carlo simulation. A random settling velocity and a random granule diameter were taken from the measured values and the granule density was estimated as described above. This was repeated 100,000 times to obtain a distribution of the granule density. The standard deviation was calculated from this distribution.
2.3. Effect of salinity
Granule samples were acclimatized for 24 h in NaCl solutions and Instant Ocean® artificial seawater [Citation27] with concentrations of 9, 18, and 36 g/L. For each experiment, approximately 22 g of granules were placed in 500 mL of saline solutions. The liquid was refreshed three times during acclimatization, to account for the drop in salinity through diffusion of the salt ions into the granules. After acclimatization, the granule density was measured with the pycnometer method. All liquid volumes used in the density measurement were of the same composition as the liquid used for acclimatization. The liquid density of the saline solutions was measured with the pycnometer as well.
3. Results
3.1. Comparison of methods
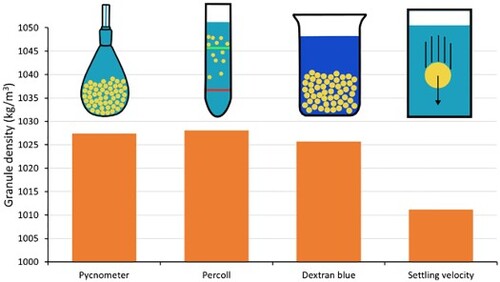
The granule buoyant density was measured with four different methods: the pycnometer method, the Percoll density gradient method, the modified dextran blue method, and the settling velocity method. The measured granule densities are shown in . The buoyant granule density values obtained with three out of the four methods were quite comparable, with minimum and maximum values of 1025.7 and 1028.1 kg/m3. This density difference translates to a settling velocity relative difference of 3.7%, according to Equation (14) and assuming a fixed drag coefficient. The buoyant granule density obtained with the settling velocity method (1012.4 kg/m3) deviated clearly from the densities found with the three other methods. The good congruence of the other methods suggests that it is the settling velocity method that is inaccurate. However, since there is no standard method, it cannot be excluded that actually the other three methods are the ones that have to be considered inaccurate. Furthermore, it should be noted that the Percoll density gradient method was carried out with tap water, while 0.15 M NaCl is commonly used for density gradients [Citation6]. When the method was carried out with 0.15 M NaCl, the measured buoyant density (1034.9 kg/m3) deviated clearly compared to the other methods. The higher salinity in the Percoll density gradient method leads to an overestimation of the buoyant density in freshwater (see also ). The Percoll method will thus overestimate the settling velocities of granules in a wastewater treatment plant.
Table 1. Buoyant and biomass granule density as measured by the different methods.
The obtained standard deviation of the methods was relatively small for the pycnometer method (0.7 kg/m3) and the modified dextran blue method (1.3 kg/m3). The standard deviation between all individual granules for the Percoll density gradient method was much larger (9.5 kg/m3), which was expected. This higher standard deviation does not only reflect the precision of the method, but also the degree of heterogeneity within the granule sample. The standard deviation of the Percoll density gradient method between the six tubes was markedly lower (0.9 kg/m3). The standard deviation of the settling velocity method reflects the heterogeneity within the sample as well, and was therefore relatively high (7.2 kg/m3).
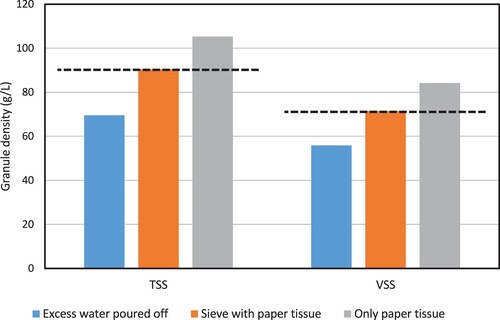
The granule biomass density was only quantified by two methods: the pycnometer method and the modified dextran blue method. The difference between both methods was only minor, both for TSS-density and VSS-density (). However, the pycnometer method was influenced by the way the granules were dried. The measured biomass density was 55.8 g VSS/L when the granules were dried by pouring off excess water, 71.5 g VSS/L when the granules were dried from underneath a sieve, and 84.2 g VSS/L when the granules were dried directly on a paper towel (see ). The relative difference between the lowest and the highest value is 40.5%, indicating that the granule drying step has a major impact on the pycnometer method. Most likely, excess water remained between the granules when water was only poured off, leading to an overestimation of the granule volume and an underestimation of the biomass density. For the granule dried directly on a paper towel, the opposite is most likely true. Drying the granules with a paper towel from underneath a sieve resulted in similar values as the modified dextran blue method, suggesting it adequately removed excess water.
Figure 1. Granule biomass density determined with the pycnometer method with different drying approaches. The dashed lines are added as reference, and represent the granule biomass density determined with the modified dextran blue method.
3.2. Effect of salinity
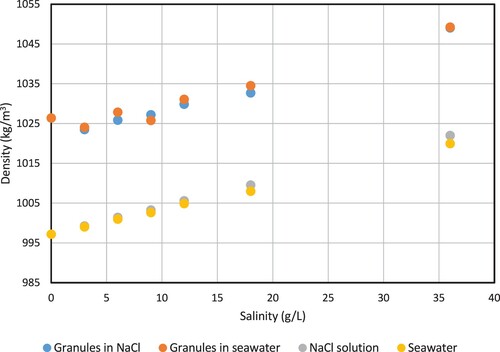
The effect of salinity on the granule density was evaluated with the pycnometer method. The liquid density of NaCl and artificial seawater solutions was measured with the pycnometer as well. The liquid density increased linearly with increasing salinity, as is expected (see ). The artificial seawater had a slightly lower density than the NaCl solutions at the same salt content, but the trend was similar. The granule buoyant density increased with increasing salinity as well. The granule buoyant density followed a slope that was comparable to that of the liquid density, at least over the range of 3–36 g/L. For NaCl, the slopes were 0.77 and 0.69 (kg/m3)/(g/L) for granule buoyant density and liquid density, respectively. For the artificial seawater, the slopes were 0.76 and 0.63 (kg/m3)/(g/L) for granule buoyant density and liquid density, respectively. The density difference between granules and liquid is therefore relatively independent of salinity. This could indicate that the settling behaviour of the granules will not be affected by salinity. Based on the relative density difference, the settling velocity at higher salinity is expected to be 10–20% lower than in freshwater (see Equation (12)).
Figure 2. Granule buoyant density as function of NaCl concentration. The buoyant density increases with salinity with a similar slope as the liquid density.
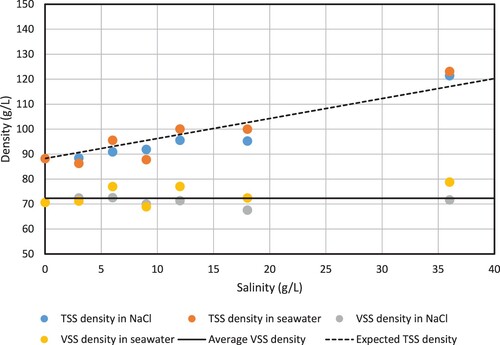
The biomass density was only partly affected by the increase in salinity (). The TSS-density showed a clear linear increase with salinity, but the VSS-density remained constant. The dashed line in indicates the TSS-density if 80% of the granule volume would contain liquid with the same salinity as outside the granules. The experimental results fall along this dashed line, suggesting that the salts have diffused in the granule pore volume until equilibrium. The remaining 20% of the granule volume is most likely occupied by bacterial cells, EPS, and inorganic material. The constant VSS-density and the proportional increase of the TSS-density suggest that the granule volume does not change during short-term (24 h) saline exposure. There was no clear difference between the effect of sodium chloride salt and artificial seawater. Since sodium chloride is the major constituent of the artificial seawater [Citation27], this result is not entirely surprising.
Figure 3. Granule biomass density as gTSS/L and gVSS/L as function of the NaCl concentration. The TSS-density increases with salinity, while the VSS-density stays in the same range, indicating that the granule volume is not affected by the salinity. The solid line indicates the average VSS-density of all measurements shown in this graph. The dashed line indicates the expected TSS-density if 80% of the granule volume is occupied by saline liquid.
4. Discussion
4.1. Comparison of methods
A comparison was made between four different methods that were previously used in literature to measure granule buoyant density and granule biomass density: the pycnometer method, the Percoll density gradient method, the modified dextran blue method, and the settling velocity method. Three out of the four methods yielded comparable granule densities. It is not completely surprising that the settling velocity method deviated from the other methods, as it is the most indirect approach to measure granule density. The settling velocity of a granule is not only determined by its density, but also by its drag coefficient (see Equation (14)). In this study, we used a general correlation between Reynolds number and drag coefficient (see Equation (13)). This correlation was developed for smooth, solid spheres, not for spheroidal granules with a rough surface. The lower density found with the settling velocity method suggests that the drag coefficient of the granules was higher than that of spheres of equivalent size. Typically, a unique correlation between the Reynolds number and drag coefficient is determined for different granule samples [Citation9,Citation28]. This highlights that the granule density cannot be determined accurately with simple approaches, such as Stokes’ law [Citation21] or the Khan & Richardson equation [Citation26].
Even though the three other methods were comparable in terms of results, there are still advantages and drawbacks of each method. For example, the Percoll density gradient method provides the granule density of the individual granules, while the pycnometer and extended dextran blue method only yield an average density. The Percoll method is therefore especially useful for determining the density distribution within a granular sludge sample. However, it is important to consider the salinity in the Percoll method. The method is normally carried out with a NaCl concentration of 0.15 M [Citation19]. The granule density found at this salinity is not representative of the density in freshwater. However, our results show that the Percoll method can provide reliable results in freshwater as well.
The pycnometer method is generally used to determine the granule buoyant density [Citation29–Citation32,Citation7,Citation33–Citation36] and the dextran blue method is generally used to measure the granule biomass density [Citation37,Citation20,Citation10,Citation38,Citation39.Citation11.Citation40–Citation46]. However, as shown here, both methods can determine the buoyant density as well as the biomass density. The two methods were mostly comparable in terms of accuracy and bias (see ). Still, the pycnometer method is more precise regarding the buoyant density. The standard deviation of the pycnometer method was 0.7 kg/m3, while that of the modified dextran blue method was 1.3 kg/m3 (see ). This precision is a small advantage of the pycnometer method for the granule buoyant density measurement. A disadvantage of the pycnometer method is the potential bias from the removal of excess water. If the granule is not dried properly and too much or too little water is removed, a substantial bias is introduced (see ). Our results show that good results are possible with the right drying procedure, as long as the biomass is not flocculent. However, our results are only valid for one granule type. We did not consider the impact of granule properties (e.g. presence of filamentous outgrowth, hydrophobicity) on the drying step of the pycnometer method. Operator error could play a significant role as well. Therefore, we recommend comparing the pycnometer method and the modified dextran blue method in future studies, to further clarify the effect of the drying step. The Percoll density gradient method can be used to study the variation of granule density within a granule sample.
There are many literature reports of density measurements of granules grown at lab-scale and full-scale conditions. However, most studies focused on specific substrates or operating conditions and the resulting densities are not directly comparable [Citation30,Citation10,Citation41,Citation32,Citation42]. An extensive review of the impact of these conditions on the granule density is beyond the scope of this study. Still, the densities for granules from a full-scale Nereda plant found in this study (1020–1030 kg/m3 and 50–70 gVSS/L) are comparable to the densities reported for granules grown on acetate as sole carbon source [Citation39,Citation2]. The buoyant granule densities reported by Etterer and Wilderer [Citation6] are higher (1037–1052 kg/m3), but they measured the density with the Percoll density gradient method in 0.15 M NaCl. The higher salinity in these experiment could explain the higher reported granule densities (see also Section 4.2).
4.2. Effect of salinity
Municipal wastewater treatment plants in coastal areas and industrial wastewater treatment plants often have to deal with fluctuating salinity of the influent [Citation47]. As the salinity influences the liquid density, the fluctuating salinity could have an effect on settling of the granular sludge. Our results show that the granule density increases with salinity as well. Both the absolute and relative density difference between the granule density and the liquid density change only marginally with increasing salt concentration. Winkler et al. [Citation2] reported that the settling velocity of lab-grown fresh water granules decreased by only 10% after exposure to 40 g/L NaCl for 24 h. This minor difference in settling velocity matches with the change in relative density difference that we observed.
As a result, seawater only has a minor effect on granule settling and fluidization. This aspect simplifies the design of WWTPs that receive wastewater with high or fluctuating salinity. It should be noted that we did not consider the short-term response of granules to a saline shock in this study. Diffusion of salts into the granule requires time, around 15–20 min [Citation2]. At the start of a saline shock, the granule density is still around 1026 kg/m3, while the liquid density is already that of the saline liquid (1020 kg/m3 for 36 g/L seawater). The granules will still settle, but with a much lower velocity. The influent salinity will most likely not fluctuate from 0 to 36 g/L in 15–20 min, but the batch-wise operation of AGS could mean that the influent of one batch contains 36 g/L salt while the effluent of the previous cycle contains almost no salt. In the worst-case, this could lead to fluidization of the granules during feeding and effluent withdrawal. Therefore, the short-term effects of fluctuating salinity require further study.
Saline exposure also has the potential to change the granule volume. Several authors have observed a volume decrease after saline exposure, for hydrogels [Citation48,Citation49], biofilms N. [Citation50,Citation51], and aerobic granules [Citation52]. A decrease of granule volume was suggested as explanation for a decrease in settling velocity at higher salinity ([Citation2]) and for an increase in granule strength at higher salinity [Citation53]. However, clear evidence of granule shrinking at higher salinities is lacking. Seviour et al. [Citation52] studied granule swelling and deswelling based on the equilibrium water content (EWC). The EWC is based on the dry weight (WTSS) and wet weight (Wgranules) of the granules:
(15)
(15) Seviour et al. [Citation52] reported a decrease in EWC with increasing salinity. This decrease can be caused by a decrease in wet weight, which would indeed indicate shrinking of the granules. However, the decrease can also be caused by an increase in the dry weight (measured as TSS), which would indicate diffusion of salt into the granules. Our findings regarding the granule biomass density show that the latter explanation is correct. A change in granule volume would have affected both the TSS-density and the VSS-density, which is clearly not the case (see ). Diffusion of salts into the granule will not affect the VSS-density, but only the TSS-density and the granule buoyant density. This is exactly what we observed, showing that the granule volume is unaffected by the salinity. It is therefore likely that the granule volume was also unaffected by salinity in the study of Seviour et al. [Citation52].
The question remains why the granules did not shrink at higher salinities. One possible explanation relates to the EPS composition of the granules. It is well known that ionic hydrogels (e.g. alginate gels) swell or shrink as a result of difference in mobile ion concentration within the gel and outside the gel [Citation54,Citation49]. The difference in concentration of mobile ions arises from the Donnan equilibrium and depends on the density of negatively-charged functional groups in the gel [Citation48,Citation55]. However, non-ionic hydrogels (e.g., collagen gels) do not swell or shrink as a function of salinity [Citation56,Citation57]. It is likely that the aerobic granules contain such non-ionic structural components [Citation58], besides the more widely reported ionic components [Citation59,Citation60]. For example, amyloid proteins have been found in AGS [Citation61] and are known to form a fibrilar network [Citation62,Citation63]. The fibrilar network can be strong enough to limit or prevent shrinking of the granules [Citation56,Citation57]. This explanation is speculative and needs further investigation. An in-depth analysis of the Donnan equilibrium, EPS composition, and granule rheology can reveal how the granule structure is affected by environmental conditions like salinity (see also Pfaff et al. [Citation55]).
5. Conclusion
In this study, a comparison was made between four methods to measure granule density. Three out of the four methods yielded comparable results, both for the buoyant and biomass granule density. The settling velocity method clearly underestimated the granule density, due to the complex relation between granule properties and settling velocity. The pycnometer was the most precise method, but it was also susceptible to bias; removal of excess water from a granule sample was a critical step in the pycnometer method. Higher salinities led to increased granule densities, but the granule volume did not change. The increased granule densities were mainly caused by the diffusion of salt ions into the granules and the granule volume was not affected by salinity.
Acknowledgements
This work is part of a VIDI grant with project number 016.168.320, which is financed by the Netherlands Organisation for Scientific Research (NWO).
Disclosure statement
No potential conflict of interest was reported by the author(s).
Data availability statement
All data are available within this article.
Additional information
Funding
References
- Liu Y, Wang ZW, Liu YQ, et al. A generalized model for settling velocity of aerobic granular sludge. Biotechnol Prog. 2005;21(2):621–626. DOI:10.1021/bp049674u.
- Winkler MKH, Bassin J, Kleerebezem R, et al. Temperature and salt effects on settling velocity in granular sludge technology. Water Res. 2012;46(16):5445–5451. DOI:10.1016/j.watres.2012.07.022.
- Pronk M, de Kreuk MK, de Bruin B, et al. Full scale performance of the aerobic granular sludge process for sewage treatment. Water Res. 2015;84:207–2170. DOI:10.1016/j.watres.2015.07.011.
- de Kreuk MK, Van Loosdrecht MCM. Selection of slow growing organisms as a means for improving aerobic granular sludge stability. Water Sci Technol. 2004;49(11–12):9–17. DOI:10.2166/wst.2004.0792.
- Bengtsson S, de Blois M, Wilén B-M, et al. A comparison of aerobic granular sludge with conventional and compact biological treatment technologies. Environ Technol. 2019;40(21):2769–2778. DOI:10.1080/09593330.2018.1452985.
- Etterer T, Wilderer PA. Generation and properties of aerobic granular sludge. Water Sci Technol. 2001;43:19–26. DOI:10.2166/wst.2001.0114.
- Quoc BN, Wei S, Armenta M, et al. Aerobic granular sludge: impact of size distribution on nitrification capacity. Water Res. 2021;188:116445. DOI:10.1016/j.watres.2020.116445.
- Winkler MKH, Kleerebezem R, Strous M, et al. Factors influencing the density of aerobic granular sludge. Appl Microbiol Biotechnol. 2013;97(16):7459–7468. DOI:10.1007/s00253-012-4459-4.
- Nicolella C, van Loosdrecht MC, Di Felice R, et al. Terminal settling velocity and bed-expansion characteristics of biofilm-coated particles. Biotechnol Bioeng. 1999;62(1):62–70.DOI:10.1002/(SICI)1097-0290(19990105)62:1<62::AID-BIT8>3.0.CO;2-U.
- Cassidy D, Belia E. Nitrogen and phosphorus removal from an abattoir wastewater in a SBR with aerobic granular sludge. Water Res. 2005;39(19):4817–4823. DOI:10.1016/j.watres.2005.09.025.
- Di Iaconi C, Ramadori R, Lopez A, et al. Preliminary biomass characterization in a sequencing batch biofilm reactor. Annali di Chimica: J Anal, Environ Cult Herit Chem. 2004;94(12):889–898. DOI:10.1002/adic.200490111.
- Beuling EE, van Dusschoten D, Lens D, et al. Characterization of the diffusive properties of biofilms using pulsed field gradient-nuclear magnetic resonance. Biotechnol Bioeng. 1998;60:283–291. DOI:10.1002/(SICI)1097-0290(19981105)60:3<283::AID-BIT3>3.0.CO;2-D.
- Horn H, Morgenroth E. Transport of oxygen, sodium chloride, and sodium nitrate in biofilms. Chem Eng Sci. 2006;61:1347–1356. DOI:10.1016/j.ces.2005.08.027.
- Stewart PS. A review of experimental measurements of effective diffusive permeabilities and effective diffusion coefficients in biofilms. Biotechnol Bioeng. 1998;59:261–272.DOI:10.1002/(SICI)1097-0290(19980805)59:3<261::AID-BIT1>3.0.CO;2-9.
- de Kreuk MK, Picioreanu C, Hosseini M, et al. Kinetic model of a granular sludge SBR: influences on nutrient removal. Biotechnol Bioeng. 2007;97:801–815. DOI:10.1002/bit.21196.
- Hao X, Heijnen JJ, van Loosdrecht MC. Sensitivity analysis of a biofilm model describing a one-stage completely autotrophic nitrogen removal (CANON) process. Biotechnol Bioeng. 2002;77(3):266–277. DOI:10.1002/bit.10105.
- Takács I, Bye C, Chapman K, et al. A biofilm model for engineering design. Water Sci Technol. 2007;55(8–9):329–336. DOI:10.2166/wst.2007.274.
- Torfs E, Nopens I, Winkler M, et al. Settling tests. In: MCM van Loosdrecht, P Nielsen, CM Lopez-Vazquez, D Brdjanovic, editors. Experimental methods in wastewater treatment. London: IWA; 2016. p. 235–262.
- Pertoft H, Laurent TC, Låås T, et al. Density gradients prepared from colloidal silica particles coated by polyvinylpyrrolidone (Percoll). Anal Biochem. 1978;88(1):271–282. DOI:10.1016/0003-2697(78)90419-0.
- Beun J, van Loosdrecht M, Heijnen J. Aerobic granulation in a sequencing batch airlift reactor. Water Res. 2002;36(3):702–712. DOI:10.1016/S0043-1354(01)00250-0.
- Trego AC, Morabito C, Mills S, et al. Diversity converges during community assembly in methanogenic granules, suggesting a biofilm life-cycle. BioRxiv. 2018;484642. DOI:10.1101/484642.
- APHA. Standard methods for the examination of water and wastewater. Washington (DC): American Public Health Association (APHA); 2005.
- Schneider CA, Rasband WS, Eliceiri KW. NIH image to ImageJ: 25 years of image analysis. Nat Methods. 2012;9(7):671–675. DOI:10.1038/nmeth.2089.
- Jimenez B, Noyola A, Capdeville B. Selected dyes for residence time distribution evaluation in bioreactors. Biotechnol Tech. 1988;2(2):77–82. DOI:10.1007/BF01876154
- Jimenez B, Noyola A, Capdeville B, et al. Dextran blue colorant as a reliable tracer in submerged filters. Water Res. 1988;22(10):1253–1257. DOI:10.1016/0043-1354(88)90112-1.
- Khan A, Richardson J. The resistance to motion of a solid sphere in a fluid. Chem Eng Commun. 1987;62(1-6):135–150. DOI:10.1080/00986448708912056.
- Atkinson M, Bingman C. Elemental composition of commercial seasalts. J Aquaric Aquat Sci. 1997;8(2):39–43.
- van Dijk EJ, Pronk M, van Loosdrecht MC. A settling model for full-scale aerobic granular sludge. Water Res. 2020;186:116135. DOI:10.1016/j.watres.2020.116135.
- Alphenaar PA, Pérez MC, Lettinga G. The influence of substrate transport limitation on porosity and methanogenic activity of anaerobic sludge granules. Appl Microbiol Biotechnol. 1993;39(2):276–280. DOI:10.1007/BF00228619.
- Bueno, R. d. F., Faria, J. K., Uliana, D. P., Liduino, V. S. Simultaneous removal of organic matter and nitrogen compounds from landfill leachate by aerobic granular sludge. Environ Technol. 2020: 1–15. DOI:10.1080/09593330.2020.1740798.
- Herrling MP, Weisbrodt J, Kirkland CM, et al. NMR investigation of water diffusion in different biofilm structures. Biotechnol Bioeng. 2017. DOI:10.1002/bit.26392.
- Li X, Luo J, Guo G, et al. Seawater-based wastewater accelerates development of aerobic granular sludge: a laboratory proof-of-concept. Water Res. 2017;115:210–219. DOI:10.1016/j.watres.2017.03.002.
- Tassew FA, Bergland WH, Dinamarca C, et al. Settling velocity and size distribution measurement of anaerobic granular sludge using microscopic image analysis. J Microbiol Methods. 2019;159:81–90. DOI:10.1016/j.mimet.2019.02.013.
- Wei SP, Quoc BN, Shapiro M, et al. Application of aerobic kenaf granules for biological nutrient removal in a full-scale continuous flow activated sludge system. Chemosphere. 2021;271:129522. DOI:10.1016/j.chemosphere.2020.129522.
- Xu D, Fan J, Li W, et al. Deciphering correlation between permeability and size of anammox granule: ‘pores as medium’. Water Res. 2021;191:116832. DOI:10.1016/j.watres.2021.116832.
- Xu D, Kang D, Yu T, et al. A secret of high-rate mass transfer in anammox granular sludge: ‘Lung-like breathing’. Water Res. 2019;154:189–198. DOI:10.1016/j.watres.2019.01.039.
- Arrojo B, Mosquera-Corral A, Campos J, et al. Effects of mechanical stress on Anammox granules in a sequencing batch reactor (SBR). J Biotechnol. 2006;123(4):453–463. DOI:10.1016/j.jbiotec.2005.12.023.
- Corsino S, Campo R, Di Bella G, et al. Study of aerobic granular sludge stability in a continuous-flow membrane bioreactor. Bioresour Technol. 2016;200:1055–1059. DOI:10.1016/j.biortech.2015.10.065.
- de Kreuk MK, Heijnen JJ, van Loosdrecht MCM. Simultaneous COD, nitrogen, and phosphate removal by aerobic granular sludge. Biotechnol Bioeng. 2005;90:761–769. DOI:10.1002/bit.20470.
- Isanta E, Suárez-Ojeda ME, del Río ÁV, et al. Long term operation of a granular sequencing batch reactor at pilot scale treating a low-strength wastewater. Chem Eng J. 2012;198:163–170. DOI:10.1016/j.cej.2012.05.066.
- Lemaire R, Webb RI, Yuan Z. Micro-scale observations of the structure of aerobic microbial granules used for the treatment of nutrient-rich industrial wastewater. ISME J. 2008;212:528–541. DOI:10.1038/ismej.2008.12.
- López-Palau S, Dosta J, Pericas A, et al. Partial nitrification of sludge reject water using suspended and granular biomass. J Chem Technol Biotechnol. 2011;86(12):1480–1487. DOI:10.1002/jctb.2643.
- Mu Y, Yu H-Q, Wang G. Permeabilities of anaerobic CH4-producing granules. Water Res. 2006;40(9):1811–1815. DOI:10.1016/j.watres.2006.03.006.
- Nor-Anuar A, Ujang Z, Van Loosdrecht M, et al. Strength characteristics of aerobic granular sludge. Water Sci Technol. 2012;65(2):309–316. DOI:10.2166/wst.2012.837.
- Tijhuis L, Van Loosdrecht M, Heijnen J. Formation and growth of heterotrophic aerobic biofilms on small suspended particles in airlift reactors. Biotechnol Bioeng. 1994;44(5):595–608. DOI:10.1002/bit.260440506.
- Yuan S, Gao M, Zhu F, et al. Disintegration of aerobic granules during prolonged operation. Environ Sci: Water Res Technol. 2017;3(4):757–766. DOI:10.1039/C7EW00072C.
- Lefebvre O, Moletta R. Treatment of organic pollution in industrial saline wastewater: a literature review. Water Res. 2006;40(20):3671–3682. DOI:10.1016/j.watres.2006.08.027.
- Golmohamadi M, Wilkinson KJ. Diffusion of ions in a calcium alginate hydrogel-structure is the primary factor controlling diffusion. Carbohydr Polym. 2013;94:82–87. DOI:10.1016/J.CARBPOL.2013.01.046.
- Saitoh S, Araki Y, Kon R, et al. Swelling/deswelling mechanism of calcium alginate gel in aqueous solutions. Dent Mater J. 2000;19(4):396–404. DOI:10.4012/dmj.19.396.
- Liu N, Dopffel N, Hovland B, et al. High osmotic stress initiates expansion and detachment of Thalassospira sp. biofilms in glass microchannels. J Environ Chem Eng. 2020;8(6):104525. DOI:10.1016/j.jece.2020.104525.
- Yan J, Nadell CD, Stone HA, et al. Extracellular-matrix-mediated osmotic pressure drives Vibrio cholerae biofilm expansion and cheater exclusion. Nat Commun. 2017;8(1):1–11. DOI:10.1038/s41467-017-00401-1.
- Seviour T, Pijuan M, Nicholson T, et al. Understanding the properties of aerobic sludge granules as hydrogels. Biotechnol Bioeng. 2009;102:1483–1493. DOI:10.1002/bit.22164.
- de Graaff DR, van Dijk EJH, van Loosdrecht MCM, et al. Strength characterization of full-scale aerobic granular sludge. Environ Technol. 2018: 1–11. DOI:10.1080/09593330.2018.1543357.
- Flory PJ. Principles of polymer chemistry. Ithaca, New York: Cornell University Press; 1953.
- Pfaff N-M, Kleijn JM, van Loosdrecht MC, et al. Formation and ripening of alginate-like exopolymer gel layers during and after membrane filtration. Water Res. 2021;195:116959. DOI:10.1016/j.watres.2021.116959.
- Lai VK, Nedrelow DS, Lake SP, et al. Swelling of collagen-hyaluronic acid co-gels: an in vitro residual stress model. Ann Biomed Eng. 2016;44(10):2984–2993. DOI:10.1007/s10439-016-1636-0.
- Voutouri C, Polydorou C, Papageorgis P, et al. Hyaluronan-derived swelling of solid tumors, the contribution of collagen and cancer cells, and implications for cancer therapy. Neoplasia. 2016;18(12):732–741. DOI:10.1016/j.neo.2016.10.001.
- Felz S, Kleikamp H, Zlopasa J, et al. Impact of metal ions on structural EPS hydrogels from aerobic granular sludge. Biofilm. 2020a;2:100011. DOI:10.1016/j.bioflm.2019.100011.
- Felz S, Neu TR, van Loosdrecht MC, et al. Aerobic granular sludge contains hyaluronic acid-like and sulfated glycosaminoglycans-like polymers. Water Res. 2020b;169:115291. DOI:10.1016/j.watres.2019.115291.
- Lin Y, Zhang H, Adin A. Characterization of bacterial alginate extracted from biofilm matrix. Desalin Water Treat. 2009;8(1–3):250–255. DOI:10.5004/dwt.2009.791.
- Lin Y, Reino C, Carrera J, et al. Glycosylated amyloid-like proteins in the structural extracellular polymers of aerobic granular sludge enriched with ammonium-oxidizing bacteria. Microbiology Open. 2018: e00616. DOI:10.1002/mbo3.616.
- Erskine E, MacPhee CE, Stanley-Wall NR. Functional amyloid and other protein fibers in the biofilm matrix. J Mol Biol. 2018;430(20):3642–3656. DOI:10.1016/j.jmb.2018.07.026.
- Romero D, Aguilar C, Losick R, et al. Amyloid fibers provide structural integrity to Bacillus subtilis biofilms. Proc Natl Acad Sci USA. 2010;107(5):2230–2234. DOI:10.1073/pnas.0910560107.