
 ?Mathematical formulae have been encoded as MathML and are displayed in this HTML version using MathJax in order to improve their display. Uncheck the box to turn MathJax off. This feature requires Javascript. Click on a formula to zoom.
ABSTRACT
This paper reports (1) an application of the modified hyperbolic sine law to P92 for the minimum creep strain rate over a wider range of stress level, and 2) the calibration of the creep cavity fracture model and its applications to such as P92, E911 and MARBN alloys. It was motivated by the original development of creep cavitation based creep rupture model and application to other alloys, and the need of creep strain and stress relation over a wider range of stress. The results include: (1) the calibration of creep cavity fracture model for E911, and the pre-required cavity nucleation and growth models, for E911, (2) the creep lifetime and stress relation coefficient U’ for P92, and (3) the relationship of the cavity nucleation rate coefficient A2 and stress level for MARBN cross-welds. This paper contributes to the specific knowledge and the methodology. It anticipates that this methodology will find its value and application in modelling other fractures such as ductile and fatigue.
Introduction
This paper details the application of a cavitation-based creep fracture model and the approach to accurately model the minimum creep strain rate with a broader range of stress level. The methodology for the calibration the cavity nucleation and cavity growth models, based on x-ray synchrotron cavity data, and their applications to the development of or creep lifetime prediction model was proposed by Xu et al. [Citation1] and applied to P91 [Citation1]. That was the very first creep cavity fracture model based on representable and a more accurate cavitation data. It is a fundamental breakthrough bearing in mind that most of the creep cavity damage model to date, is a correlation of the creep damage with creep strain failure. This paper will report the application such methodology to other materials such as P92, E911 and MARBN, where the x-ray synchrotron cavitation data has been available. It is further suggested that real mechanism based on creep cavity damage model should be integrated into the development of the scientifically sound creep damage constitutive equations [Citation2–Citation4], and further developed and validated under multi-axial situations [Citation5–Citation8].
Phenomenological cavitation modelling for creep damage
Dyson has proposed the well-known phenomenologically linear relationship between the creep cavity damage and creep strain. Yin et al. [Citation9] was modified that approach and proposed creep cavity damage function for the high Cr alloy as:
where A’, B’ are material constants, respectively, and both A’, B’ can be functions of temperature, but not of stress.
Such an approach was adopted by Yadav et al. [Citation10], and it was that the value of , hence,
where A is a parameter that depends on the material, temperature, and stress. The specific variation of cavitation coefficient A for P92 steel is shown in [Citation10] and graphically in .
Figure 1. The variation of creep cavitation coefficient with different stress and temperature.
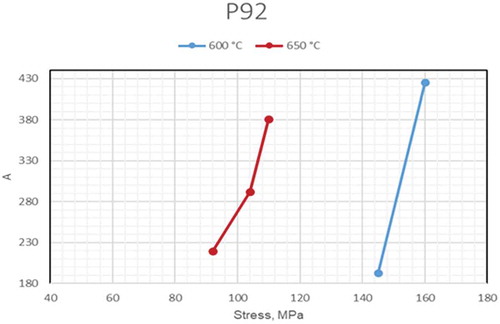
Table 1. The variation of creep cavitation coefficient A [Citation10].
The trend of coefficient bases on three, and two experimental points at 600°C and 650 °C, respectively, and the stress range is narrow and limited. Thus, the modelling is challenging for using an accurate prediction for long-term service.
Purpose
The application of new minimum creep strain rate with stress function
To develop and verify the application of modified hyperbolic sine law for minimum creep strain rate over a wider range of stress level for P92 alloy.
The development and application of creep fracture criterion based on cavity area fraction along grain boundary for high Cr steel
To provide an equation for cavity area fraction along grain boundary according to the appropriate cavity nucleation and cavity growth models for E911;
To define the material coefficient U’ of cavity area fraction equation based on the experimental data on the creep rupture time under different stress levels and temperature for P92;
To apply the obtained cavity nucleation model to MARBN steel in order to show the trend of cavity nucleation rate coefficient A2 with stress.
Experimental data
The application of new minimum creep strain rate with stress function
The chosen experimental data for this part, including:
Creep test for ASME Grade 92 (9Cr–1.8W–0.5Mo–V-Nb) steels: 1) temperature 600°C, stress range 120–250 MPa, minimum creep rate between 1.81E-5 h−1and 9.96E-1 h−1; 2) temperature 650°C, stress range 50–160 MPa, minimum creep rate between 1.5E-5 h−1 and 5.6E-1 h−1 [Citation11]. The coefficient designations used with linking to Equation (2.1).
The development and application of creep fracture criterion based on cavity area fraction along grain boundary for high Cr steel
The chosen experimental data for this part, including:
The creep rupture time for E911: temperature 600°C, creep time 37,800 h, the minimum and maximum cavity diameter of 1.2 and 9.5μm at rupture time [Citation12], for the work described in the above step (1). The coefficient designations used with linking to Equation (3.1.b), Equation (3.2), Equation (3.4), Equation (3.5.b), and Equation (3.6);
The creep rupture time for ASME Grade 92 (9Cr–1.8W–0.5Mo–V-Nb) steels: (1) temperature 600°C, stress range 120–250 MPa, lifetime 5.1–65,363.4 h; temperature 625°C, stress range 100–160 MPa, lifetime 213.4–33,518.5 h; temperature 650°C, stress range 50–160 MPa, lifetime 10.5–50,871.2 h [Citation11]; (2) temperature 600 °C, stress range 110–185 MPa, lifetime 1000–200,000 h; temperature 650°C, stress range 60–115 MPa, lifetime 1000–200,000 h, according to Yin et al. [Citation9], for the work described in the above step (2). The coefficient designations used with linking to Equation (3.9), and Equation (3.10);
Cavitation information for MARBN-heat 1 cross-welds (Martensitic Boron–Nitrogen strengthened steel): temperature 650°C, stress range 70–130 MPa, lifetime 3433–17,200 h, cavity number density between 2.95E-5 um−3 and 3.03E-5 um−3 [Citation13], for the work described in the above step (3). The coefficient designations used with linking to Equation (3.3), and Equation (3.11).
Method
The application of new minimum creep strain rate with stress function
The process for this part of the work is:
Apply a new mathematical function reference by Xu et al. [Citation1];
Compare the predictions with experimental data in order to display its ability.
The development and application of creep fracture criterion based on cavity area fraction along grain boundary for high Cr steel
The process for this part of the work is:
Base on the appropriate cavity nucleation and cavity growth models for E911 to originate a specific quantitative equation;
Base on the experimental data on the creep rupture time under different stress levels and temperature for P92 to decide the material coefficient U’ of cavity area fraction equation. In order to verify the science and rationality of the trend, the relevant data was collected from NIMS and Yin, respectively;
Apply the obtained cavity nucleation model to other high Cr steel (namely MARBN) to show the trend of cavity nucleation rate coefficient A2 with stress.
Results and discussion
The application of the modified hyperbolic sine law for minimum creep strain rate and stress for high Cr steel
A modified hyperbolic sine law has proposed by Xu et al. [Citation1] and applied in [Citation1,Citation14], it gives as:
where q is stress exponent for minimum creep strain rate.
The modelling results of power law and conventional hyperbolic sine law do not fit well with the experimental data such as follows three materials according to [Citation1,Citation14]. The modified hyperbolic sine law successfully applied to both low and high Cr steel, and materials and its parameters shown in .
Table 2. Materials and its parameters.
In order to reflect the relationship between minimum creep strain rate with stress for P92 (9Cr–1.8W–0.5Mo–V-Nb), Panait et al. [Citation15] adopted Norton power law to distinguish low and high-stress range to discuss the stress exponent n at 600°C and 650 °C, respectively, whom experimental data provided by SZMF, Germany. Sklenicka et al. [Citation16,Citation17] also adopted power law to discuss the relationship between the slope and the stress exponent n, and the difference in minimum strain rate between received at 600°C and aged state at 650°C. However, the relevant experimental data were extracted by reading the published graph and stress range is limited, which experimental data shows in . Thus, the specific data of minimum creep strain rate for P92 (9Cr–1.8W–0.5Mo–V-Nb) was taken from the NIMS creep data sheet [Citation11] at 600°C. Furthermore, the modelling by a conventional power law, sine law and the modified hyperbolic sine law show in . The calibrated material parameters display in . As can be seen, the curve fits well with experimental data.
Figure 2. Experimental data of minimum strain rate and stress at 600°C and 650°C for P92 steel [Citation9,Citation11,Citation15].
![Figure 2. Experimental data of minimum strain rate and stress at 600°C and 650°C for P92 steel [Citation9,Citation11,Citation15].](/cms/asset/c15d44dc-bd4c-42cb-a876-3c8b18f87b6b/ymht_a_1716145_f0002_c.jpg)
Figure 3. The comparison between the different function of minimum creep strain rate and applied stress for P92 steel at 600°C.
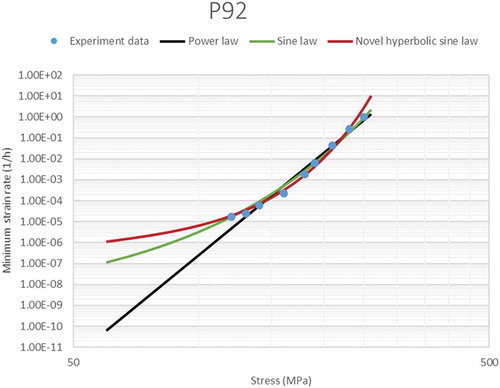
Table 3. The function of minimum creep strain rate with calibrated material parameters for P92 steel at 600°C.
The comparison of the above three functions shown in .
The modified hyperbolic sine law applied to P92 steel at 650°C, and the modelling result shown in with the calibrated material parameters shown in . As can be seen, the curve fits well with experimental data and a favourable agreement was achieved.
Figure 4. The comparison between the different function of minimum creep strain rate and applied stress for P92 steel at 650°C.
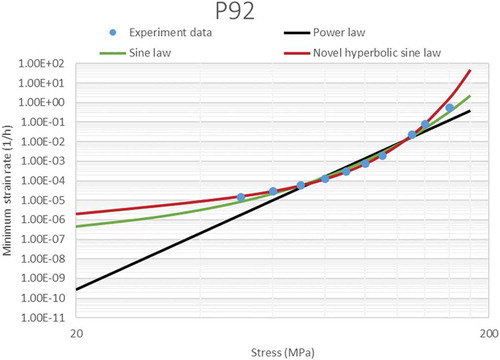
Table 4. The function of minimum creep strain rate with calibrated material parameters for P92 steel at 650°C.
The comparison of the above three functions shown in .
Cavity area fraction along with grain boundary-based creep fracture criterion for high Cr steel
Function for cavity area fraction and the cavity size distribution on E911
Generic theory of cavity area fraction along grain boundary was presented by Riedel [Citation22]. The cavity size distribution function is shown [Citation1,Citation22,Citation23]:
where A1, A2, α, β, and γ are material cavitation constants that may depend on stress.
The growth rate of the cavity radius and nucleation rate is given as, respectively [Citation1,Citation12,Citation22,Citation23]:
where the is the non-stationary growth rate of the cavity radius, the
, is the nucleation rate of the cavity.
The above cavity size distribution function (3.1.a) is a function of creep time, and theoretically, any such experimental data could use for the calibration of the cavity nucleation and cavity growth models specified by Equations (3.2) and (3.3). The cavity size distribution at creep lifetime tf is written as:
Furthermore, other directly obtained data on cavitation can also be used for the determination of the values of the parameters of the cavity nucleation and cavity growth models such as β, α, and γ.
From the literature [Citation1,Citation12,Citation22,Citation23], the typical vale of β is close to 2, and it agrees with the constrained cavity growth. Specifically, Renversade et al. [Citation12], reported β ≈ 2.1 ± 0.3 for P91 and E911, while Sket et al. [Citation23] report β = 2. In this paper, we adopt such value without further question.
The value of α the exponent and in case of actual α and γ unitary value in the literature [Citation22,Citation23], which suggests α = 0.9999
1.
With α = 1, Equation (3.1.b) rewrites as:
The curves of Equation (3.1) with α = 0.9999 type equation here, and curves of Equation (3.4) with α = 1, are shown in . There is no noticeable difference by eye, hence it is concluded either way can be used for prediction, though a singularity occurs when α = 1.
Figure 5. No noticed difference of the predicted probability density function by Equation (3.1) (with α = 0.9999) and Equation (3.4) dots: experimental data from ref [Citation12,25] curves.
![Figure 5. No noticed difference of the predicted probability density function by Equation (3.1) (with α = 0.9999) and Equation (3.4) dots: experimental data from ref [Citation12,25] curves.](/cms/asset/51534a24-c496-46bc-9a8f-d218cce1961e/ymht_a_1716145_f0005_c.jpg)
The value of γ = 1 characterised for continuum cavity nucleation with cavity constrained growth [Citation1,Citation23]. Xu et al. [Citation1] discussed and confirmed its predictions shape with γ = 1 is like to that from the experiment for P91.
The above Equation (3.4) can be rewritten as:
where C1 and C2 are a material parameter, and
.
This equation has also reported in the literature as [Citation1,Citation23]:
The following compares predictions with experimental data reported in the literature [Citation5] and confirms the value of α = 1, β = 2, γ = 1. It is essential to point out that the actual experimental data is much more intensive, and only a limited number taken from the graph for comparison. The process for this part work is:
Firstly, according to Equation (3.4) and using the minimum and maximum cavity diameter of 1.2 μm and 9.5 μm at 37,800 h solve the values of A1 = 8.76 and A2 = 9.47E-7.
Secondly, integrating Equation (3.2) with α = 1, β = 2, γ = 1:
where C is integration constant related to the cavity growth rate, using the above Equation (3.6) to calculate the values of C = −56.607 and t0 = 645.62h.
Thirdly, according to the value of A1 and A2 calculate C1 and C2, another method is using Equation (3.5.b) to solve the value of C1 = 154 and C2 = 0.228.
Finally, it found that the prediction curve by using Equations (3.5.b) fits with the experimental data very well, as displayed in . Thus, conforms the value of α = 1, β = 2, γ = 1.
Figure 6. The probability density function of cavity equivalent R for E911, dots: experimental data from ref [Citation12,25], curve by Equation (3.5.b).
![Figure 6. The probability density function of cavity equivalent R for E911, dots: experimental data from ref [Citation12,25], curve by Equation (3.5.b).](/cms/asset/0b5fbbd6-2641-4d19-877f-880c8927742f/ymht_a_1716145_f0006_c.jpg)
The cavity nucleation and cavity growth models for E911 have been calibrated based on x-ray synchrotron data. The comparison with these coefficients for P91, as shown by , has revealed that E911 has a much higher growth rate (10 times) and much slower nucleation rate (about 100 times).
Table 5. Comparison of nucleation and growth rate coefficients.
The trend of creep lifetime coefficient U’ with stress levels for P92
Based on the creep cavity nucleation, growth and coalescence, a generic mathematical formula for the creep cavity damage was proposed [Citation22]. Its specific mathematical equation for a given nucleation rate model and growth model was first time derived by [Citation1]. The cavity area fraction w obtained and based on the above Equation (3.1), Equation (3.2) and Equation (3.3), and gives below:
Inputting the above values of α = 1, β = 2 and γ = 1 into above Equation (3.7), the cavity area fraction w is:
When
When w reaches its critical value, then the rupture occurs.
The critical value, wf, is assumed to be π/4, refereeing to the view [Citation22].
The experimental data based on the NIMS creep rupture time under different stress levels and temperature on typical ASME Grade 92 (9Cr–1.8W–0.5Mo–V-Nb) steels [Citation11], and the value of U’ was calculated as shown in , and .
Table 6. The value of U’ for P92 at 600°C [Citation24].
Table 7. The value of U’ for P92 at 625°C.
Table 8. The value of U’ for P92 at 650°C [Citation24].
An apparent trend can see in , which provides much more stable scientific findings and that can use to convince researchers.
Figure 7. The trend of the values of U’ under different stress and temperature [Citation24].
![Figure 7. The trend of the values of U’ under different stress and temperature [Citation24].](/cms/asset/dc6a9753-f182-473e-8e65-da08d9ac477e/ymht_a_1716145_f0007_c.jpg)
In order to verify the science and rationality of the trend, the relevant data was collected by reading the published graph under different stress levels at 600°C and 650°C for P92 steels [Citation9]. The value of U’ was calculated, as shown in and , and the apparent trend can display in .
Figure 8. The trend of the values of U’ under different stress and temperature.
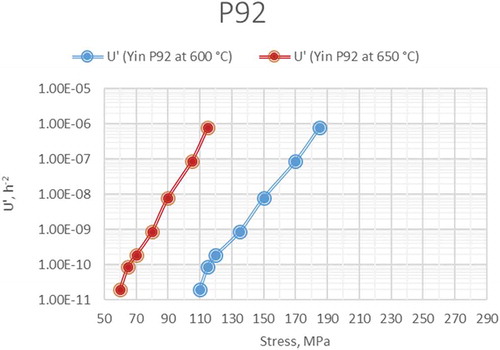
Table 9. The value of U’ for P92 at 600°C.
Table 10. The value of U’ for P92 at 650°C.
The two sets of trends are the same at 600°C and 650°C from , although experimental data based on the NIMS and Yin, respectively. Hence, it potentially provides a scientifically sound, novel, and instead of a simple lifetime prediction method.
Figure 9. Comparison of Yin’s U’ with experiment [Citation11] for P92 steel [Citation24].
![Figure 9. Comparison of Yin’s U’ with experiment [Citation11] for P92 steel [Citation24].](/cms/asset/66248ee0-5ff7-4741-a35e-d0cfa4801494/ymht_a_1716145_f0009_c.jpg)
The variation between cavity nucleation rate coefficient A2 and stress for MARBN
The coefficient A2 in the cavity nucleation rate Equation (3.3) is assumed dependent stress. Assuming there is no incubation time for simplification, with γ = 1, the integrating Equation (3.3) gives [Citation1]:
where J is the number density of cavities, and material parameter A2 may depend on stress and strain rate.
This section investigates the dependence between coefficient A2 and stress. The number density of cavities at failure for CB8 under a range of stress level has been researched by Xu et al. [Citation1], which the set of 3D cavity data referenced by X-ray micro-tomography. Fortunately, there is another set of 3D cavity data that the number density of cavities at failure for MARBN-heat 1 cross-welds under a range of stress levels from 70 MPa to 130 MPa are available [Citation13,25]. The relevant data were extracted by reading the published graph and table. Using the above data calculate the individual value of A2 at different stress level shown in and . A2 only reduces slightly with stress. Thus, this is significant as the above trend could be used for extrapolation to stress.
Figure 10. The trend of cavity nucleation rate coefficient A2 and stress.
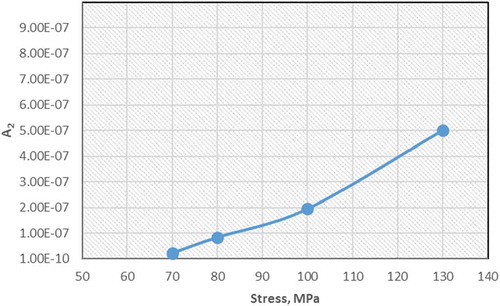
Table 11. The number of cavities at failure and the individual value of A2 under a range of stress levels.
Conclusions
Critical conclusions for this research include:
The reliable cavity nucleation and cavity growth models for E911 have been calibrated based on x-ray synchrotron data.
The comparison with these coefficients for P91, as shown by , has revealed that E911 has a much higher growth rate (10 times) and much slower nucleation rate (about 100 times), bearing in mind that there is a difference between the testing temperature and applied stress. It suggests that the creep cavitation rupture is more dependent on cavity nucleation than cavity growth.
The creep lifetime and stress relation coefficient U’ for P92 have been obtained based on cavity along with grain boundary criterion; its value is typically 10 times smaller than that [Citation1] of P91 under the same stress level and temperature.
The application of the calibrated creep cavity nucleation model gives a scientifically sound and simple cavity nucleation rate dependence of stress.
The methodology of the creep cavitation along grain boundaries is scientifically sound and should be a further application to other cases.
It also anticipated that such principle in methodology should find applications to other types of cavitation-based damage such as ductile failure, fatigue failure, and creep and fatigue combined failure [Citation3];
The minimum creep strain rate and a more extensive range of stress level for P92 have obtained. Such formulae should use in the future development of constitutive equations.
Nomenclatures
| = | Creep strain rate | |
| = | Minimum creep strain rate | |
| = | Creep cavity nucleation rate | |
| A, B, A’, B’ | = | Material parameters, possibly dependent on temperature |
| q | = | Stress exponent for minimum creep strain rate |
| R | = | Cavity radius |
| t | = | Time |
| A1, A2, α, β, γ | = | Material parameter may depend on stress |
| N(R, t) | = | The cavity size distribution function |
| = | The probability density function of cavity equivalent radius | |
| C1, C2 | = | Material parameter |
| = | The growth rate of the cavity radius | |
| J | = | The number density of cavity |
| = | Cavity nucleation rate | |
| C | = | Integration constant related to the cavity growth rate |
| w | = | The cavity area fraction along the grain boundary |
| wf | = | A critical value of the cavity area fraction at the fracture |
| U’ | = | Material parameter |
Acknowledgments
Mrs Xuming Zheng is grateful for the partial scholarship for PhD research provided by the Santander Student Mobility Scholarship.
Disclosure statement
No potential conflict of interest was reported by the authors.
Additional information
Funding
References
- Xu Q, Yang X, Lu ZY. On the development of creep damage constitutive equations: modified hyperbolic sine law for minimum creep strain rate and stress and creep fracture criterion based on cavity area fraction along grain boundaries. Mater High Temp. 2017;34(56):323–332.
- Xu Q, Lu Z, Wang X. Damage modelling: the current state and the latest progress on the development of creep damage constitutive equations for high Cr steels. Mater High Temp. 2017;34(3):229–237. ISSN 0960-3409.
- Xu Q, Lu Z. Modelling of creep deformation and fracture, a chapter in the book of “Strength of materials”. London: IntechOpen Ltd, 2019. Available from: https://www.intechopen.com/online-first/modeling-of-creep-deformation-and-creep-fracture
- Xu Q, Tu JD, Lu Z. Development of the FE In-house procedure for creep damage simulation at grain boundary level. Metals. 2019;9(6):656.
- Xu Q, Barrans S. The development of multi-axial creep damage constitutive equations for 0.5Cr0.5Mo0.25V ferritic steel at 590.DEG.C. JSME Int J. Ser. A. 2003;46(1):51–59. ISSN 13447912.
- Xu Q. Creep damage constitutive equations for multi-axial states of stress for 0.5Cr0.5Mo0.25V ferritic steel at 590°C. Theor Appl Fract Mech. 2001;36(2):99–107. ISSN: 0167-8442.
- Xu Q. The development of validation methodology of multi-axial creep damage constitutive equations and its application to 0.5Cr0.5Mo0.25V ferritic steel at 590°C. Nucl Eng Des. 2004;228(1–3):97–106. ISSN: 0029-5493.
- Wang X, Wang X, Xu Q, et al. Investigation on the validity of creep damage mechanics for the life time prediction of T92 welded joint. Int J Damage Mech. July 2019. DOI:10.1177/1056789519860240.
- Yin YF, Faulkner RG. Continuum damage mechanics modelling based on simulations of microstructural evolution kinetics. Mater Sci Technol. 2006;22:929–936.
- Yadav SD, Sonderegger B, Stracey M, et al. Modelling the creep behavior of tempered martensitic steel based on a hybrid approach. Mater Sci Eng A662. 2016;330–341. DOI:10.1016/j.msea.2016.03.071.
- Creep and rupture data of heat resistant steels, National Institute for Materials Science (NIMS). Available from: http://smds.nims.go.jp/creep/index_en.html, accessed May 2018
- Renversade L, Ruoff H, Maile K, et al. Microtomographic assessment of damage in P91 and E911 steels after long- term creep. Int J Mater Res. 2014;105(7):621–627.
- Schlacher C, Pelzmann T, Be´al C, et al. Investigation of creep damage in advanced martensitic chromium steel weldments using synchrotron X-ray micro-tomography and EBSD. Mater Sci Technol. 2015;31:516–521.
- Xu QH. Development of advanced creep damage constitutive equations for low Cr alloy under long-term service [doctor thesis]. Huddersfield University; 2016. Available from: http://eprints.hud.ac.uk/27858/1/27_AAFinal_thesis_Qihua_Xu_2016_1.pdf
- Panait CG. Metallurgical evolution and creep strength of 9–12% Cr heat resistant steels at 600°C and 650°C [doctor thesis]. Paris Tech Institut Des Sciences Et Technologies Paris Institute of Technology. Mines ParisTech; 2010. Available from: https://pastel.archives-ouvertes.fr/pastel-00579983
- Sklenicka V, Kucharova K, Kudrman J, et al. Microstructure stability and creep behavior of advanced high chromium ferritic steels. Kovove Mater. 2005;43:20–33.
- Sklenicka V, Kucharova K, Svoboda M, et al. Creep behaviour of advanced power plant steels after long-term isothermal ageing. Advances in materials technology for fossil power plants. Proceedings from the Sixth International Conference August 31–September 3. 2010; Santa Fe, New Mexico, USA.
- Bailey RW. Creep of steel under simple and compound stress. Engineering. 1930;121:129–265.
- Norton FH. The creep of steel at high temperature. New York (NY): McGraw-Hill Book; 1929.
- Dyson BF. Use of CDM in materials modelling and component creep life prediction. J Press Vessels Technol. 2000;122:281–296.
- Dyson B, McLean M. Microstructural evolution and its effects on the creep performance of high temperature alloys. In: Strang A, Cawley J, Greenwood GW, editors. Microstructural stability of creep resistant alloys for high temperature plant applications. 1997. p. 371–393, IOM Communications, London, United Kindom.
- Riedel H. Fracture at high temperatures. Berlin: Springer Verlag; 1987.
- Sket F, Dzieciol K, Borbély A, et al. Microtomographic investigation of damage in E911 steel after long term creep. Mat Sci Eng. 2010;528:103–111.
- Xu Q, Zheng XM, Okpa M, et al. Poster: the development of creep damage constitution equations for high Cr alloys. Power Plant Operation & Flexibility. 2018 July 4 –6; London: IOM3.
- Gupta C, Toda H, Mayr P, et al. 3D creep cavitation characteristics and residual life assessment in high temperature steels: a critical review. Mater Sci Technol. 2015;31:603–626.