
ABSTRACT
Scales are widely used to assess the personal experience of thermal conditions in built environments. Most commonly, thermal sensation is assessed, mainly to determine whether a particular thermal condition is comfortable for individuals. A seven-point thermal sensation scale has been used extensively, which is suitable for describing a one-dimensional relationship between physical parameters of indoor environments and subjective thermal sensation. However, human thermal comfort is not merely a physiological but also a psychological phenomenon. Thus, it should be investigated how scales for its assessment could benefit from a multidimensional conceptualization. The common assumptions related to the usage of thermal sensation scales are challenged, empirically supported by two analyses. These analyses show that the relationship between temperature and subjective thermal sensation is non-linear and depends on the type of scale used. Moreover, the results signify that most people do not perceive the categories of the thermal sensation scale as equidistant and that the range of sensations regarded as ‘comfortable’ varies largely. Therefore, challenges known from experimental psychology (describing the complex relationships between physical parameters, subjective perceptions and measurement-related issues) need to be addressed by the field of thermal comfort and new approaches developed.
Introduction
Buildings and their climate conditioning systems should be designed to provide a comfortable environment. The word ‘comfortable’ encompasses various aspects, but thermal comfort is, without discussion, one of the most important ones. Gagge, Stolwijk, and Hardy (Citation1967) described thermal comfort as ‘a recognizable state of feeling’ (p. 1) and stated that it ‘is usually associated with conditions that are pleasant and compatible with health and happiness; and discomfort, with pain which is unpleasant’ (p. 2). According to the definition by the American Society for Heating, Refrigerating and Air-Conditioning Engineers (ASHRAE), thermal comfort is defined as a ‘condition of mind that expresses satisfaction with the thermal environment and is assessed by subjective evaluation’ (ASHRAE, Citation2013, p. 3). Parsons (Citation2014, p. 257) states that ‘thermal comfort is a state people strive for when they feel discomfort’.
Engineers designing buildings today use different thermal comfort models to define boundaries for comfortable thermal conditions indoors so that they can appropriately design heating and cooling systems. Both ASHRAE’s Standard 55 (ASHRAE, Citation2013) and European Standard EN 15251 (EN 15251, Citation2012) adopted the thermal comfort model by Fanger (Citation1970). The model predicts thermal sensation of a large group of people exposed to a particular thermal environment (so-called predicted mean vote – PMV) and based on that estimates a percentage of people who would be dissatisfied with such environment (predicted percentage of dissatisfied – PPD). Moreover, each standard includes a specific version of so-called adaptive thermal comfort models relating comfortable temperatures indoors to outdoor temperatures (Olesen, Citation2007). Although Fanger’s model and the adaptive models are grounded on empirical data from completely different settings (climate chambers versus real work environments), they are both based on subjective assessments of the thermal environment given on the seven-point thermal sensation scale (cold – cool – slightly cool – neutral – slightly warm – warm – hot) (Fanger, Citation1970; Humphreys, Rijal, & Nicol, Citation2010).
Within this paper, thermal sensation is understood as a sensory experience – a psychological response to the state of thermoreceptors in a human body, as discussed in detail, for example, by Parsons (Citation2014). Because of that, thermal sensation describes how the person feels thermally, e.g. ‘slightly warm’. Thus, such assessment should be free of any affective information, because the information needed is ‘how do you feel’ (e.g. ‘slightly warm’) not ‘how do you find it’ (e.g. ‘comfortable’).
To derive an estimate of comfort/discomfort, Fanger (Citation1970) used previous results of Gagge et al. (Citation1967) to describe dissatisfied individuals as those who vote ‘cool’, ‘cold’, ‘warm’ or ‘hot’ on the thermal sensation scale. Gagge et al. used a perceptive thermal sensation scale and an affective comfort sensation scale. The relationship between the two scales was presented for votes given by three human subjects. The equation for the adaptive thermal comfort model presented in ASHRAE 55-2014 is based on the same approach as that by Fanger (de Dear, Brager, & Cooper, Citation1997). The underlying assumption is that one dimension (thermal sensation) is sufficient for the description of a state of mind (thermal comfort).
The European version of the adaptive comfort equation is based on a postulated linear relationship between thermal sensation and globe temperature along with considering a ‘neutral’ thermal sensation as comfortable (Nicol & Humphreys, Citation2010). This approach is only adequate when two conditions are fulfilled. The first is that distances between verbal markers of the scale (e.g. ‘cold’, ‘cool’, ‘slightly cool’) are perceived by human subjects as being equal – defined in this paper as the assumption of conceptual equidistance. The second condition is that the same size of steps in the physical variable, e.g. globe temperature, leads to equal steps in perception expressed by the markers on the scale, i.e. that there is a linear relationship – defined in this paper as the assumption of methodological equidistance. Both assumptions of equidistance can be doubted. Lantz (Citation2013) states that the perception of people is in general not equidistant. Further, McIntyre (Citation1978) found that the assumption of a linear relationship between physical temperature and thermal sensation does not hold true at the end categories for the thermal sensation scale.
The aforementioned thermal comfort models have been implemented in current standards and they are used in daily practice of heating, ventilation and air-conditioning (HVAC) engineers. But a scientific discussion on their suitability and correctness is still ongoing (e.g. Halawa & van Hoof, Citation2012). This discussion seems justified because results from field studies show that many buildings designed and operated according to the models fail to provide thermally comfortable conditions (Huizenga, Abbaszadeh, Zagreus, & Arens, Citation2006). Weak predictive accuracy of the models on an individual level has been also criticized. For example, Schweiker and Wagner (Citation2015) observed an accuracy of only 40–60% in predicting individual comfort votes using both models. One can find many scientific publications that criticize the aforementioned models for thermal comfort (see also the section below entitled ‘Criticism of scales’), but the fundamental assumptions regarding the usage of thermal sensation scales have not been adequately challenged.
The objective of this paper is to initiate a discussion among researchers and professionals about the way the thermal sensation scale is used as well as about methods for the assessment of the complex psychological phenomenon of thermal comfort. The approach chosen is a critical discussion of the following research questions:
What are potential pathways towards a multidimensional view on thermal comfort in contrast to the one-dimensional basis used for the derivation of existing thermal comfort models?
Are the three assumptions related to the usage of the thermal sensation scale correct?
The first question is addressed by a literature review of thermal comfort, including an insight into pain research. The second question is addressed by a quantitative analysis applied to an existing database and a combined (both quantitative and qualitative) analysis applied to new data.
Methods
Approach to the literature review
The literature review was performed using the Web of Science database as well as local archives at the universities to which the authors are affiliated. The review served three main purposes. First, to reconstruct history of the scales used to evaluate human thermal comfort. Second, to focus on recent scientific publications to determine which thermal comfort scales are most commonly used at present. Therefore, the 38 most recent publications were chosen using the keyword ‘thermal comfort’. Seventeen did not state or show the scales used, so that 21 publications from the last 15 years remained. Third, findings from other fields using scales for the evaluation of human perception, especially from pain research, were integrated.
Questioning assumptions of equidistance
Data acquisition and preparation
In total 52 data files from the 20 projects included in the ASHRAE RP884 (Citation2004) database were downloaded. One file (number 32) contained no data resulting in 51 files with a total of 24 657 votes. Most studies used the ASHRAE scale, but 10 studies used the Bedford scale (file numbers 18–26, 28). As it was done and justified during the RP884-Project, the Bedford seven-point thermal comfort scale was mapped directly to the ASHRAE seven-point thermal sensation scale for this study.
The thermal sensation scale is commonly used as a categorical scale, i.e. subjects can only choose the verbal markers between ‘cold’ and ‘hot’, but nothing in between, or as a pseudo-continuous scale, where subjects can choose a state exactly at one of the verbal markers or anywhere in between. Other variations are continuous scales, which can be in the form of numerical rating scales (NRS; e.g. from 0: ‘cold’ to 10: ‘hot’ with no additional verbal category in between) or visual analogue scales (VAS; e.g. ‘cold’ and ‘hot’ are connected using a continuous line without numbers and additional categories). Based on the project information given on the homepage together with a review of the original publications and a screening of the data, the dataset was divided based on the type of scale used to assess the thermal sensation vote (TSV).
This led to a clear categorization of studies using categorical (file numbers 1, 2, 5–10, 17–31, 38–41, 44) or continuous (file numbers 11–16, 49–52) type of the scale. At the same time some studies were mentioned to be based on category seven-point scales, but the files contained values for the TSV with differences of 0.1 (files numbers 33–37, 42, 43, 45–48). These files were classified as based on the continuous scale. One data point in the subset with categorical data had to be removed from the dataset because the value for the sensation vote in the database was 0.5.
In addition, the dataset was divided into data from naturally ventilated (NV) and conditioned (HVAC) buildings. The data from mixed-mode buildings were neglected because no data on the use of a continuous scale were available for this building category. We also removed all cases for which no TSV was available.
The final dataset was separated into data from 28 files with 11 438 votes on the categorical scale and from 21 studies with 11 049 votes on the continuous scale.
gives an overview of the conditions in those studies, showing that not all environmental and personal data were comparable between the studies using the categorical or the continuous scale.
Table 1. Summary of the conditions used in the studies.
Data analysis
In order to compare the categorical and continuous data and to apply the same statistical method, continuous data were binned into seven levels of an ordinal factor according to the seven categories of the categorical data, i.e. votes lower ‘–2.5’ were defined as ‘–3’, those equal or higher ‘–2.5’ and lower ‘–1.5’ as ‘–2’ etc.
To compare the characteristics of continuous and categorical scales, the relationship between the TSVs on the scales and operative temperatures was analysed. A positive relationship between operative temperature and TSVs (i.e. higher votes at higher temperatures) was expected but with differences on the shape and strength of the relationship depending on the type of the scales. In order to test these relationships, a linear regression approach was used using the lm-function of the statistical software R (R Development Core Team, Citation2012). The operative temperature was defined as the predicted variable. As predictors, the TSV and the type of rating were included. The TSV was not fitted as a regular factor, but as a numeric regressor with two orthogonal contrasts: a linear component and a quadratic component. One cannot use the labels assigned to the categories (–3, –2, –1, etc.) to the coefficients, but the contrasts calculated by the statistical software need to be used.
For the type of scale, a factor with two levels (‘categorical’ (ASHRAE scale) and ‘continuous binned’) was used. In addition, the interaction between the votes and the type of rating was included in the model to test if the slope of the linear or quadratic component differed depending on the type of scale.
Equidistance and whether middle votes reflect thermal comfort
For this part of the analysis, a qualitative approach was applied. In an experimental study, 33 participants (20–30 years of age) were asked to draw markers related to the verbal anchors of the ASHRAE scale, i.e. ‘cold’, ‘cool’, ‘slightly cool’, ‘neutral’, ‘slightly warm’, ‘warm’ and ‘hot’, onto a line of 10 cm length with non-labelled markers only presented at the two ends. In addition, they were asked to explain verbally why they placed their markers at the specific position. If this was not mentioned by the subjects, then they were asked whether the spaces between markers were supposed to be equally or unequally distributed and which area of the scale represents comfortable conditions for them. Answers were noted by the researcher and the distances between the markers were measured. Assessments were performed during summer season after an exposure to warm conditions. The distances and answers were analysed descriptively.
From thermal sensation towards a multidimensional approach
To answer the first research question addressed in this paper, this section reviews how the usage of scales evolved, how it was criticized, the current recommendations and usage of scales, and possible future advancements towards a multidimensional approach.
Development of scales and related criticisms
History of scales used
As one of the first, Houghten and Yagloglou (Citation1923) asked subjects three questions about the perception of comfort:
Is this condition comfortable or uncomfortable?
Do you desire any change?
If so, do you prefer warmer or cooler?
From a psychological point of view, the first question relates to the cognitive thermal state and the other two to the preferred thermal state as defined by Parsons (Citation2014) (see also the section below entitled ‘Consequences and possible future advancements’). Although these questions represented different dimensions of thermal comfort, the answers were transformed according to by Houghten and Yagloglou (Citation1923) into one five-point scale:
TOO COLD – COMFORTABLY COOL – VERY COMFORTABLE – COMFORTABLY WARM – TOO WARM.
Table 2. Transformations described by Houghten and Yagloglou (Citation1923) to convert the answers given to three questions into a five-point scale.
This procedure must have changed, because Gagge et al. (Citation1967) stated that the group of Houghten used a seven-point scale with following verbal categories for consecutive studies:
COLD – COOL – SLIGHTLY COOL – COMFORTABLE – SLIGHTLY WARM – WARM – HOT.
The markers of this scale mix sensation statements like ‘cold’ or ‘cool’ with the evaluation of comfort. Until 1967, researchers used either the scale shown above, the scale known these days as the Bedford scale (Bedford, Citation1936):
COLD – COOL – COMFORTABLE COOL – COMFORTABLE – COMFORTABLE WARM – WARM – HOT
or the scale introduced by Winslow, Herrington, and Gagge (Citation1937):
VERY PLEASANT – PLEASANT – INDIFFERENT – UNPLEASANT – VERY UNPLEASANT.
As denoted by Macfarlane (Citation1978), Gagge et al. (Citation1967) were the first to point out the mixed assessment of sensation and comfort in one scale and proposed to use two distinct scales: the later seven-point ASHRAE scale (ASHRAE, Citation1968) with the markers
COLD – COOL – SLIGHTLY COOL – NEUTRAL – SLIGHTLY WARM – WARM – HOT
as a ‘scale of thermal sensation’ and a four-point scale with the markers
COMFORTABLE – SLIGHTLY COMFORTABLE – UNCOMFORTABLE – VERY UNCOMFORTABLE
as a ‘scale of comfort sensation’. In contrast to Houghten and Yagloglou (Citation1923), the contextual questions asked with the scales were not included in Gagge et al. (Citation1967) and Winslow et al. (Citation1937).
Since then, a huge number of different scales have been applied (e.g. Humphreys, Citation1976; Lee, Stone, Wakabayashi, & Tochihara, Citation2010; Macfarlane, Citation1978, for summaries). Humphreys (Citation1976) details variations in the number of categories used and the scales’ symmetry. He also highlights differences in the types of questions asked with the scales. Some ask for an evaluation of the thermal state of the room (‘How do you perceive the room?’), others ask to evaluate the subjects’ personal thermal state (‘How do you feel now?’).
Criticism of scales
Related to conceptual aspects of scales, Auliciems (Citation1981b) denotes that the Bedford scale tends to confuse sensation and comfort. In another article, Auliciems (Citation1981a) specified that the scales of thermal comfort have not been tested for validity and reliability. In this context, a scale is reliable if the same result is obtained if a person is measured again under (hypothetically) exactly the same circumstances. On the other hand, validity is used to ascertain whether a value obtained by the scale really represents the construct it intends to measure (e.g. if ratings given on a sensation scale really represent the person’s state of sensation).
Humphreys and Nicol (Citation2004) explored a discrepancy between ‘neutral’ on the ASHRAE scale and ‘prefer no change’ on a thermal preference scale. The results of Humphreys and Hancock (Citation2007) showed that the respondents’ desired thermal sensation changed depending on the situation. Moreover, the mean desired sensation depended to some extent on the actual sensation and differed systematically among the respondents. In addition, the authors showed that sensations expressed on the ASHRAE scale can have more than one meaning, encompassing psychological factors such as a motivation to express (dis)satisfaction with the situation or mood. This leads to the question how strongly the ASHRAE scale is affected by factors concerning the overall context rather than (only) the actual thermal conditions. Similarly, the findings by de Dear et al. (Citation1997) show that ratings differ at comparable temperatures depending on whether the building is NV or air-conditioned.
Comparative analysis of thermal sensation and thermal comfort votes by Wong et al. (Citation2002) revealed that a high proportion of people experiencing sensations of +2/+3 on the ASHRAE scale still found the conditions to be comfortable on the Bedford scale.
From a methodological point of view it should be noted that Nicol et al. (Citation1973), Macfarlane (Citation1978) and McIntyre (Citation1978) studied the assumption of equidistance and found small changes/equal distances for the middle votes, but more rapid changes/unequal distances for the end votes ‘cold’ and ‘hot’.
McIntyre (Citation1980) showed differences between the categorical and continuous version of the scale. According to his studies in climate chambers, the continuous scale leads to smaller intervals of temperatures between the categories when it is getting slowly warmer between the votes compared with the categorical scale. His argument is that people feel differences, so they want to report. On a categorical scale, the only chance is to change their vote by one category, while on the continuous scale the changes of the vote can be much smaller, likely representing a more differentiated evaluation. Parsons (Citation2014) articulates important differences in the use of statistical methods when the scale is presented as continuous or as a categorical scale (see also Lee et al., Citation2010). In the section below entitled ‘Results and discussion: a methodological point of view’, another example related to the scale type is discussed.
More recently, Wong and Khoo (Citation2003) demonstrated that depending on the type of thermal comfort scale (ASHRAE scale, Bedford scale, preference (McIntyre) scale), the percentage of people classified as feeling comfortable varies under comparable conditions between 21% and 70%. The major differences were found between votes of preference on the one hand and votes on ASHRAE and Bedford scale on the other hand. The percentage of persons voting within the central three categories of both scales (ASHRAE and Bedford) was above 90 (a comparison of individual votes was not presented).
Lee et al. (Citation2010) emphasized insufficient reports about advantages and limitations of different scales. They compared a nine-point categorical scale, a visual analogue scale and a categorical scale combined with a visual analogue scale (called a ‘graphic categorical scale’; see also Kolarik, Toftum, Olesen, & Shitzer, Citation2009; Toftum, Wyon, Svanekjær, & Lantner, Citation2005) for the assessment of thermal sensation. Based on their regression analysis, the indoor air temperature, regarded in the mean as neutral, differed depending on the scale applied only slightly by 0.5 K. It was the highest for the categorical scale and the lowest for the visual analogue scale. However, the slope of temperature–TSV relationship also varied among the scales. As a consequence, the mean air temperature evaluated as hot was, for example, 24°C for the categorical scale and 22.5°C for the graphic categorical scale.
Current recommendations and usage of scales
Recently, the variation in used scales decreased, probably due to the existence of the International Standard ISO 10551 (Citation1995), which recommends subjective judgement scales for the evaluation of the thermal state of the human body (). Application of the standard is limited to subjects performing sedentary work (metabolic rate in range 60–70 W/m2) and wearing clothing with thermal resistance in range 0.5–1.0 clo. Another requirement by the standard is that the assessment should take place first after 30 min of exposure to the investigated conditions. The scales should be presented to subjects in the order shown in .
Table 3. Overview of the judgement scales.
Regarding the scale for assessment of ‘perception of the personal state’ (commonly called ‘thermal sensation’), the standard offers seven- and nine-point scales. The seven-point alternative corresponds to the ASHRAE scale, while the nine-point variant extends the range by the categories VERY HOT and VERY COLD. Although this extension is meant for environments with markedly high/low temperatures (–2 < PMV < +2), the standard recommends this version also for moderate environments to provide a reference frame for the subjects. To determine the level of discomfort, the standard suggests to use the ‘evaluative scale’ (), which can be compared with the PPD index (Fanger, Citation1970). However, the standard offers neither a deeper justification of such an approach nor a discussion of the assumptions made by Fanger when establishing the PPD index. Furthermore, ISO 10551 (Citation1995) states that scales with more than two degrees/categories can be presented both as discontinuous (categorical) and continuous scales. Regarding data analysis, the standard mentions that mathematical properties (data structure) of the analysed dataset determine appropriate analytical methods.
shows scales applied in 21 field studies published after 2000. Nearly all used the original ASHRAE scale (ASHRAE, Citation1968) (N = 16) or a variation of it (N = 3) as a sensation scale. Four of those studies based their conclusion merely on the sensation scale, while in all other studies more scales were used to assess thermal comfort. However, results obtained through different scales are rarely combined.
Table 4. Overview of scale usage in reviewed studies.
Consequences and possible future advancements
In contrast to the one-dimensional approach used for the comfort models included in current standards, the scientific community around the world dealing with thermal comfort has adopted several straightforward scales to assess different aspects (dimensions) related to human perception of thermal environment.
Simultaneously, researchers have recognized that one cannot infer if peoples’ state of feeling is pleasant or not from the application of the thermal sensation scale (cf., de Dear, Citation2011). Thus, de Dear proposed to take a multidimensional view on (comfort) experience. Similarly, as long ago as the 1970s, Rohles and colleagues (Rohles, Citation2007; Rohles, Woods, & Morey, Citation1989) pleaded for multidimensional semantic differentials, named a ‘thermal comfort ballot’. Addressing hedonic and evaluative aspects, this ballot consists of six bipolar adjective pairs: comfortable–uncomfortable, good–bad, pleasant–unpleasant, unacceptable–acceptable, satisfied–unsatisfied, and uncomfortable temperature–comfortable temperature. Closer to de Dear’s suggestion, Parsons (Citation2014) distinguishes between the perceptual, affective and preference thermal state as defined in ISO 10551 (Citation1995) ().
However, the results of studies applying such multidimensional approach have not been utilized to improve existing thermal comfort models. In addition, compared with other disciplines dealing with perception, such as pain research, the number of dimensions used still seems to be rather limited. Further dimensions can be defined when looking at commonly used dimensions in psychological research.
Due to the variety of psychological research, the following is limited to the field of pain research. Similar to thermal discomfort, pain is an aversive experience. In addition, the assessment of a subjective experience in relation to an objective stimulus is highly relevant in pain research. Typically ‘sensory–discriminative’, ‘affective–motivational’ and ‘cognitive–evaluative’ components of pain (Melzack & Casey, Citation1968) are distinguished. The first two components roughly relate to the distinction proposed by de Dear (Citation2011). However, ‘affective–motivational’ refers not only to a ‘hedonic’ dimension but also to other emotions associated with the experience (e.g. anger and sadness) as well as motivation to behave in a specific way (e.g. to distract oneself from the stimulus or to avoid pain).
The cognitive component describes thoughts, expectations and appraisals (evaluations of situations and capacities to influence them) associated with the experience. Such cognitive factors have a strong influence on perception. In pain, for example, expectations modulate the perceived pain intensity as demonstrated by placebo analgesia (Wager et al., Citation2004). Similarly, attention towards or distraction from a stimulus as well as perceived control over pain alters the perception (e.g. Villemure & Bushnell, Citation2009; Wiech et al., Citation2006). describes the ‘sensory–discriminative’, ‘affective–motivational’ and ‘cognitive’ components of pain and elaborates on possibilities to transfer such evaluation to thermal comfort research.
Table 5. Example questions for the three components of perception from pain research and corresponding examples for thermal comfort research.
Separating the experience of thermal comfort into different dimensions and measurements of these dimensions using separate scales might help to understand better inter-individual differences. For example, a psychological factor such as perceived control over the situation might be a mediator between thermal sensation and thermal comfort. This is in line with findings in the field of thermal comfort (Brager, Paliaga, & de Dear, Citation2004; Schweiker & Wagner, Citation2016).
While several scales to evaluate the thermal environment can be applied in laboratory studies, field studies require a reduction of scales to a minimum. One proposition to limit the number of scales with still getting information more than one perceptual dimension is to use matrix-like two dimensional scales. However, while this way to deal with data might be intuitive for scientists, the general public and thus the subjects in the studies are likely not used to such a two-dimensional plane representation of their sensations so that this approach might be prone to misunderstandings. Thus, it is rather advisable to keep scales one-dimensional and as simple as possible to achieve valid data, although this implies that the number of dimensions that can be assessed in field studies is limited. The combination of different dimensions assessed by different scales can easily be achieved post-hoc using statistical methods.
Despite the number of dimensions mentioned in , the present authors do not suggest a long questionnaire that includes all of them in future thermal comfort studies. Instead, the application of some of the listed dimensions is suggested in order to broaden the multidimensional view on the phenomenon of thermal comfort. Such data could then be used to assess the construct of comfort multidimensionally. This kind of analysis will reveal if all dimensions correlate and can be summarized by the umbrella term ‘comfort’ or if the dimensions are at least partly independent, i.e. capturing different aspects.
Assumption of equidistance of the thermal sensation scale
Despite the aforementioned criticism, the thermal sensation scale will likely be used for subjective evaluation in future thermal comfort studies (see also later section on ‘Alternatives to scales’). Thus, the central assumption of equidistance should be critically challenged.
Results and discussion: a methodological point of view
The leading question is whether the same size of steps in temperature (objective) leads to equal steps in perception, whether this is affected by the type of scale and, consequently, whether it is possible to compare studies based on different thermal sensation scales.
shows the relationship between TSV and operative temperature for different building types (NV and HVAC) and for studies using the categorical (ASHRAE) scale and studies that used a continuous scale (continuous binned), based on the procedure described in the section entitled ‘Questioning assumptions of equidistance’.
Figure 1. Distribution of the operative temperatures for different votes. The violins show the shape of the distribution. The black dots show the mean values. The lines indicate the fit of a linear regression using a linear and a quadratic component. The grey-shaded areas around the curves indicate the 95% confidence interval of the values predicted by the linear model. Note that (for better visibility of the regression slopes) the scaling of the y-axis differs between the four plots.
The regression model for the NV buildings explained a significant portion of the variance in the operative temperature (, F(5, 10846) = 1645, p < 0.001; see for the statistical parameters of the regression coefficients). In a model without the quadratic component, R2 dropped to 41.3%. Although this drop does not seem to be substantial, the comparison of the models indicated that the model with a quadratic component had a significantly better fit (F = 177.25, p < 0.001) probably due to the large sample size.
Table 6. Results from the multiple regression analysis for the naturally ventilated (NV) buildings.
Importantly, both the linear and quadratic component were significantly different from zero; there are smaller differences between the votes between neutral and hot compared with those between neutral and cold. Detailed inspection of reveals that with continuous data the parabolic shape of the relationship was shallow in the area of ‘cold’ thermal sensation (–3, 0). This means that small changes in operative temperature were associated with larger spread of TSVs. For ‘warm’ area of thermal sensation (0, +3), the parabolic shape of the relationship became more profound. Therefore, a change in one category on the scale corresponded to relatively larger change in operative temperature. Moreover, it is clear from as well as from that the predicted relationship between TSVs and operative temperature changed significantly depending on which scale was used. The operative temperatures were overall positively predicted by the linear component of the ASHRAE scores. Collapsed across the two different types of scales (continuous binned and categorical) there was a significant change of the quadratic component from negative to positive. This means that the shape of the polynomial relationship changes orientation from downwards (categorical data) to upwards (continuous binned data). Further, the linear component of the relationship (the slope) significantly changed with the type of the scale used. However, this was caused by a large difference in the range of operative temperature corresponding to the two investigated scale construction types (). Finally, there was also an effect of the type of scale on the intercept of the relationship (the ‘neutral’ operative temperature) for the data from NV buildings. In the studies using the continuous scale, the operative temperature corresponding to predicted neutral thermal sensation was 2.05 K higher.
The regression model for the conditioned buildings (HVAC) explained a rather minor portion of variance in the operative temperature (, F(5, 8981) = 208.4, p < 0.001; see for the statistical parameters of the regression coefficients). A model without the quadratic component explained about 1% of the variance. The model with the quadratic component had a significantly better fit (F = 23.45, p < 0.001).
Table 7. Results from the multiple regression analysis for the conditioned (heating, ventilation and air-conditioning (HVAC)) buildings.
shows that the type of scale influenced the relationship between thermal sensation and operative temperature also in the case of data collected in buildings with HVAC systems. The change of the sign for the quadratic component indicates that there was a change in orientation of the relationship – the same trend that was observed for data from NV buildings. On the contrary, the change in the slope was not significantly different from zero, which means that the ranges of operative temperatures for the two compared scale types were similar. The intercept has slightly but significantly decreased in the case of continuous binned data leading to 0.18 K lower neutral temperature.
As mentioned in the section entitled ‘Questioning assumptions of equidistance’, mean values and standard deviations of the environmental and personal variables differed between studies using the categorical or continuous scale. This was most pronounced for the NV buildings. Here, the variation in studies using categorical scale was higher (and the mean temperature lower) than in the studies using continuous scales. This was caused by studies that used very low (e.g. 15°C) operative temperature. However, a repetition of the regression analysis using a subsample that only included studies with operative temperatures between 20 and 35°C did not change the general trends in regression results.
In addition, the difference between the types of scales used also remained significant when substituting the operative temperature with the standard effective temperature (SET) given in the database. The SET (Gagge, Stolwijk, & Nishi, Citation1971) accounts for differences in other environmental and personal factors.
It is beyond the scope of the current paper to conduct an in-depth investigation of the reason for the differences. However, there was a large difference in the distribution of data collected on the two investigated scale types (). The difference was more pronounced for data from NV buildings ((b)). Even if one disregards the categories of –3 and –2 (because they were derived from the studies in NV buildings with some conditions characterized by much lower temperatures than the studies using continuous scale), it is observable that the central tendency was associated with different temperature levels for categorical and continuous data. This difference probably led to the differences in the orientation of the fitted polynomial regression lines. illustrates that difference in distributions for the two scale types was much higher for NV buildings. shows that difference in slopes of the relationships is much higher for NV buildings. The difference in the shape of the regression curves was much smaller in the case of HVAC buildings ( and ).
Figure 2. Density plots illustrating distribution of operative temperature for particular categories on the thermal sensation scale; a) for data from HVAC buildings, b) for data from NV buildings.
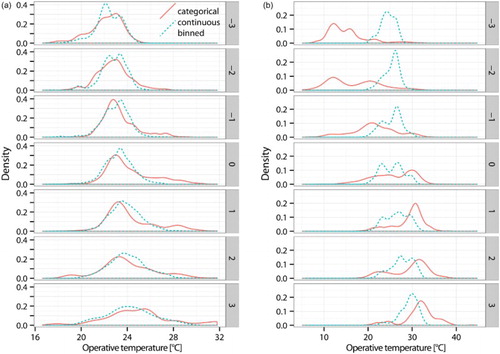
As mentioned in the section entitled ‘Criticism of scales’, McIntyre (Citation1980) argued that people can indicate differences in their perception on the categorical scale only through a whole category. In addition, operative temperature in HVAC buildings is usually kept within a narrow range, leading to smaller differences in the data distribution. In the present authors’ opinion, the differences in the ability to express changes in perception together with differences in the range of operative temperature led to different distribution characteristics of the data and above described results. This may have large practical consequences when thermal sensation scales are integrated in questionnaire surveys conducted in real buildings and therefore for members of the research community and others conducting surveys.
In order to address the issue of binning, it was investigated whether the results were different without binning, and it was found that this led to the same conclusions.
Results and discussion: a conceptual point of view
shows box plots of the positions of the markers participants drew on an empty visual scale. The medians suggest that especially from cold to neutral there is a strong agreement between the assumption of equidistance and the responses of the subjects.
Figure 3. Boxplots of positions of TSV labels as drawn by subjects. Major ticks on the y-axis show positions of equal distances between labels. The line indicates the fit of a linear regression using a linear and a quadratic component. The grey shaded area around the line indicates 95% confidence interval.
shows the distribution of markers that participants assigned to be within a comfortable range of the scale participants had drawn before. At a first glance, this supports the common assumption that the area between ‘slightly cool’ and ‘slightly warm’ represents comfortable conditions for the majority of the subjects.
Figure 4. Number of times that each vote within the comfortable range was mentioned.
shows the distribution of verbal labels drawn by each subject that they regarded as comfortable and the information, whether the subject mentioned equally or unequally distributed labels. Twelve of 33 subjects (36%) stated that the markers were supposed to be equally distributed, while 19 subjects (58%) stated that the distribution is not equal along the scale (in two subjects this information was missing). Of those who stated that the distribution was not equal, 10 stated that the distance between cold and cool was bigger, seven stated that the distance between hot and warm was bigger, and four stated that the distance between cold and cool was smaller. Two subjects mentioned other combinations.
Figure 5. Position of verbal labels of the thermal sensation vote as drawn by the subjects. From left to right the order is from cold to hot according to the 7-point ASHRAE scale. The area of comfort as described by each subjects is shown by black dots. Subjects without any black dot did not answer this question. Subjects stating an unequally spaced scale are subjects 1 to 17, subjects 18 to 30 stated an equally spaced scale, and subject 33 did not answer this question. Each line/point on the y axis represents one subject.
Related to the range of categories regarded as comfortable, this area encompassed the area of the scale from cool to warm (). In the standard procedures the three middle votes from ‘slightly cool’ to ‘slightly warm’ are considered to be related to comfort. Looking at the individual levels as shown in , only four subjects (12%) stated exactly this area as representing comfortable conditions, while 24 (73%) chose other combinations or single items (in five subjects this information was missing). Based on the standard procedure, there would be 84 (28 subjects multiplied with three categories) options regarded as comfortable. However, only 54 of them (64%) were defined as comfortable by the subjects. At the same time, the subjects reported 15 out of the remaining 112 options (13%) typically considered as uncomfortable to be comfortable. This shows that evaluating the votes according to the standard procedure, the assumption that comfortable conditions are between slightly cool and slightly warm on an individual level appears to be wrong. In addition, one subject mentioned that the range of comfort depended on the season; another subject mentioned that it depended on the air velocity. Such statements signify that the range of categories regarded as comfortable might change within-subjects depending on the context.
Note that these results were obtained by asking a small number of subjects during the summer season. As a consequence, this study should be followed up by a large-scale, systematic investigation.
Consequences with respect to the usage of scales
Alternatives to scales
The usage of thermal sensation scales faces many major and minor issues (not all have been discussed here, e.g. other biasing factors such as social desirability, seasonal influences, the statistics applied, etc.). Therefore, one may question of what use they are. More provocatively, one could ask if such scales are of any use for thermal comfort research or whether more objective alternatives should be used. Alternatives discussed in the literature related to thermal comfort are physiological or behavioural (re-)actions of people to thermal conditions. In this context, it is worth looking again to the field of thermal pain research. A distinction often made in pain research is between ‘implicit’ and ‘explicit’ perceptual processes. Implicit perceptual processes refer to the processing of a stimulus that humans are not aware of. These can either be peripheral or central physiological processes or they can be behaviours that we are not aware of or that we do not consciously relate to the presence of a stimulus. Explicit perception, on the other hand, describes the aspect of perception that is consciously perceived and can be described.
The distinction between implicit and explicit overlaps with the distinction between ‘objective’ and ‘subjective’. Similarly to implicit measures, objective measures are either captured by physiological or by behavioural recordings while subjective measures are captured by self-reports. Subjective measures are explicit. However, objective measures are not necessarily implicit. For example, skin temperature is an objective measure of a physiological reaction. But subjects can be well aware of their skin temperature, particularly if lower than normal. Furthermore, only a subjective assessment of the state of mind allows conclusions on the cause for observed physiological or behavioural (re-)actions. For example, increased skin temperature could be a sign of warm discomfort, but it could also be a sign of an elevated stress level.
Despite the many issues, scales still allow one to learn about subjective perception and experiences, which would not be accessible without directly asking. Using a scale standardizes this questioning and allows for systematic analysis. Therefore, scales are an invaluable tool in assessing thermal comfort. However, one has to be cautious to consider the following aspects when applying the existing scales and the addition of objective measures could lead to further insights into the phenomenon of thermal comfort.
Implications of falsified assumptions
The history and current way of scale usage implies that the assumptions of equidistance are rather based on intuition and they have not been sufficiently challenged or explicitly tested so far. At first glance, equidistant categories on a scale appear as a valid approach that allows results to be analysed and understood in a straightforward manner. However, research on the perception of thermal non-painful and painful stimuli, for example, shows that the so-called Stevens coefficient, which describes the relationship between the magnitude of a physical stimulus and its perceived intensity (Stevens, Citation1960), varies greatly between non-painful and painful stimuli even if implemented within the same modality (Lautenbacher, Moltner, & Strian, Citation1992). These results illustrate that a psychophysical function spanning from warmth to heat and further to heat-related pain is non-linear. McIntyre (Citation1978) found that for the thermal sensation scale the linear assumption does not hold at the end categories, thus a similar non-linear function appears likely.
The present results confirm this aspect and suggest that analysing data based on these equidistance assumptions may oversimplify the concept of human thermal sensation, and possibly introduce systematic misinterpretations. This is of particular importance as data derived from TSVs are further processed to calculate the neutral comfort temperature (cf. Griffiths, Citation1990; Nicol & Humphreys, Citation2002; Schweiker, Brasche, Bischof, & Wagner, Citation2012, for a discussion about this method). As mentioned in the introduction, this approach assumes a linear relationship between the ratings of the thermal sensation scale and the temperatures observed. However, our results contradict such a linear relationship. As a consequence, careful statistical analyses revealing the relationship between TSV and physical variables are recommended prior to the main statistical analysis.
The environmental context in which questions are asked can also induce systematic biases (cf., Friedman & Amoo, Citation1999). Our results, showing differences between ratings in NV and HVAC buildings, indicate that ratings of thermal sensation are not directly comparable among different environmental conditions. Therefore, it is advisable to assess and report, among others, the different climatic (cold/warm/winter/summer conditions) and situational (office/residential/quality of building envelope/type of control) contexts, to be careful in directly comparing results obtained in different contexts, and not to generalize results based on data from one context to other contexts.
Similarly, internal conditions of the participants, such as different motivations, expectations, moods or arousal, influence ratings as well as well-known response biases (Paulhus, Citation1991; Schwarz & Sudman, Citation2012). Thermal comfort research is starting to take such factors into account. For example, first evidence shows that individual factors like personality traits influence thermal sensation: the thermal sensation of people who are cold-sensitive appears to be different from not cold-sensitive people (Hawighorst, Schweiker, & Wagner, Citation2015). Other factors such as gender, age or the body mass index (BMI) of a person affect thermal sensation as well (Karjalainen, Citation2012; Tuomaala, Holopainen, Piira, & Airaksinen, Citation2013). This is supported by our data showing a wide inter- and intra-individual variation of the range of subjective comfort. As a consequence, votes given on any scale should be interpreted with respect to not only differences between individual preferences of thermal conditions but also individual differences in the interpretation of the scale provided. In addition, future studies need to discuss whether such differences in thermal sensation are due to a different perception of the thermal conditions or a difference in the interpretation of the scales. In case information is available on an individual level on how subjects relate temperatures to comfort, this could be taken into account in the statistical analyses.
There are no immediate consequences for individual studies using different types of thermal sensation scale. However, such an approach hinders comparisons between studies. The number of categories is not necessarily an issue for comparisons across studies, but different levels of measurement pose a problem. Continuous scales prompt the subjects to interpret the scale as a continuum. In contrast, Likert scales or categorical scales use multiple categories in an ascending or descending order. In this case it is an empirical question if the differences between the verbal categories are perceived as equal or not. Accordingly, an interval scaling can be assumed for continuous scales, which allows mathematical transformations such as averaging. In contrast, an ordinal level of measurement has to be assumed for Likert scales unless the equidistance assumption of the categories has been verified empirically, using a sufficiently large normative sample. Without such verification, transformations (e.g. averaging or the application of linear regression analyses) are not allowed and would bias the results.
Conclusions and future directions
In conclusion, the evaluation of thermal comfort by use of scales faces several issues, e.g. rendering comparisons between studies and generalizations to different environments problematic. This leads to efforts done by individual researchers less usable for the whole scientific community as it is not easy to compare those results with others.
This paper shows the complexity involved and precautious to be taken when dealing with such simple methods as scales.
The main results of this paper can be summarized as follows:
Current models of thermal comfort are based on oversimplified assumptions and their performance might be improved by adopting a multidimensional concept.
Although the most commonly used scales are thermal sensation scales, steps towards a multidimensional concept of thermal comfort have been taken on the scientific level and in standardization. However, taking the field of pain research as an example, many more dimensions were presented in this paper which are going beyond the dimensions of sensation, preference and acceptability. In addition, results from other dimensions than thermal sensation presented in the scientific literature have not been taken into account in thermal comfort models so far, so that the interrelationships between the different aspects remain unexplored.
Common assumptions concerning the equidistance of thermal sensation scales appear to be wrong. Our data show that subjects vary largely in the range of the sensation scale classified as comfortable.
Furthermore, results presented in this paper demonstrate that (1) distances between the scale markers are not perceived as equidistant (conceptual aspect), (2) there is no linear relationship between temperatures and votes on the thermal sensation scale, and (3) the fact whether the scale was constructed as continuous or categorical has an effect on this relationship (methodological aspect).
Presenting subjects an empty visual analogue scale and having them locate the seven markers of the sensation scale improves our understanding of how people perceive the distances between levels of thermal sensation.
Therefore, the field of thermal comfort could largely benefit from a critical reflection of current scales usage together with a discussion and clarification of the following issues which have been discussed throughout the paper:
The aspects of equidistance and the effect of different types of scales (continuous versus categorical) should be further investigated, e.g. by using techniques such as the free positioning of labels as proposed here. With a larger and extended application of our approach, the effect of additional aspects like season, the individual’s thermal history or the cultural context on the subjects’ interpretation and usage of the scales used could be analysed. In addition, this would allow establishing calibration coefficients needed when comparing data or results based on different types of scales or the same type of scale applied in different contexts. Thereby, the reliability and validity of the instrument should be systematically investigated as assessed in the literature on psychological diagnostics. Furthermore, also the wording of the labels needs to be investigated, potentially leading to adapted explanations for the subjects on how to interpret them.
Based on the analyses described in point (1), suggestions for different statistical approaches should be followed. For example, if equidistance between the categories is not given, statistics suitable for ordinal data should be used; if the relationship between temperatures and votes on the scales is not linear, non-linear regression terms should be used, etc. Inter-individual differences in responses to a scale (originating from different interpretations of the scale) could be controlled by assessing the subjective interpretation and taking it into account in the analyses. This way, the assessment of thermal sensation could be optimized.
The interrelationships between different aspects of thermal sensation and comfort should be studied. This could be done by assessing both aspects simultaneously and exploring correlations or underlying dimensions using multivariate statistics such as principal component analysis or hierarchical clustering. Scales should be validated by correlating them with aspects of thermal sensation or comfort assessed by other methods (e.g. by behavioural assessments). Another approach could be meta-analytical. Since large amounts of data from different scales have been reported in the literature, the data could be shared among researchers and pooled. This would allow further insights into the interrelationships without the need to collect a huge amount of new data. The way we prepared the data provided by the ASHRAE might be a starting point; however, this approach needs to be extended by integrating various other aspects.
Based on insights derived from the analyses suggested in point (3), a multidimensional questionnaire to assess the perception and evaluation of indoor climate could be constructed. Such a questionnaire should be validated using external aspects such as job satisfaction, health, personality and so on. In research settings, the questionnaire should be related to aspects of thermal sensation and comfort measured on different levels, e.g. behavioural and physiological responses. This way, models used in thermal comfort research could be adapted and improved.
In addition, more research is needed for a better understanding of which components show the closest relationship to factors that we seek to optimize in the design or operation phase of buildings, such as health, well-being or work performance. Further, it needs to be determined which factors can directly be improved by variations of the built environments and which are related or interact with social variables or work-related stressors. Such knowledge is not only of interest for the research community, but also for those involved in the design of buildings, selection of suitable work places, or political decisions related to building standards.
Acknowledgement
MS, XF and JK contributed equally to this paper.
Disclosure statement
No potential conflict of interest was reported by the authors.
ORCID
Marcel Schweiker http://orcid.org/0000-0003-3906-4688
Xaver Fuchs http://orcid.org/0000-0002-7690-8969
Susanne Becker http://orcid.org/0000-0002-5681-4084
Masanori Shukuya http://orcid.org/0000-0003-2777-4375
Mateja Dovjak http://orcid.org/0000-0003-4929-0232
Maren Hawighorst http://orcid.org/0000-0002-6859-6053
Jakub Kolarik http://orcid.org/0000-0002-3872-1802
Additional information
Funding
References
- Andersen, R. (2012). The influence of occupants’ behaviour on energy consumption investigated in 290 identical dwellings and in 35 apartments. Proceedings of Healthy Buildings 2012, Brisbane, Australia.
- ASHRAE. (1968). Handbook of fundamentals. New York: American Society of Heating, Refrigerating and Air-Conditioning Engineers.
- ASHRAE. (2013). Standard 55-2013. thermal environmental conditions for human occupancy. New York: American Society of Heating, Refrigerating and Air-Conditioning Engineers.
- ASHRAE RP884. (2004). ASHRAE RP884. Retrieved from http://sydney.edu.au/architecture/staff/homepage/richard_de_dear/index.shtml
- Auliciems, A. (1981a). Psycho-physiological criteria for global thermal zones of building design. International Journal of Biometeorology, 26, 69–86.
- Auliciems, A. (1981b). Towards a psychophysiological model of thermal perception. International Journal of Biometeorology, 25, 109–122. doi: 10.1007/BF02184458
- Becker, R., & Paciuk, M. (2009). Thermal comfort in residential buildings–failure to predict by standard model. Building and Environment, 44(5), 948–960. doi: 10.1016/j.buildenv.2008.06.011
- Bedford, T. (1936). The warmth factor in comfort at work: A physiological study of heating and ventilation. Industrial Health Research Board Report, 76 , Medical Research Council. London: HMSO.
- Brager, G. S., Paliaga, G. and de Dear, R. (2004). Operable windows, personal control, and occupant comfort. ASHRAE Transactions, 110, Part 2:17–35.
- Cao, B., Zhu, Y., Ouyang, Q., Zhou, X., & Huang, L. (2011). Field study of human thermal comfort and thermal adaptability during the summer and winter in Beijing. Energy and Buildings, 43(5), 1051–1056. Tackling building energy consumption challenges – Special Issue of {ISHVAC} 2009, Nanjing, China. doi: 10.1016/j.enbuild.2010.09.025
- Corgnati, S. P., Ansaldi, R., & Filippi, M. (2009). Thermal comfort in Italian classrooms under free running conditions during mid seasons: Assessment through objective and subjective approaches. Building and Environment, 44(4), 785–792. doi: 10.1016/j.buildenv.2008.05.023
- de Dear, R. (2011). Revisiting an old hypothesis of human thermal perception: Alliesthesia. Building Research & Information, 39(2), 108–117. doi: 10.1080/09613218.2011.552269
- de Dear, R., Brager, G., & Cooper, D. (1997). Developing an adaptive model of thermal comfort and preference. In Final Report on ASHRAE Research Project 884. Macquarie University Sydney.
- EN 15251. (2012). Indoor environmental input parameters for design and assessment of energy performance of buildings addressing indoor air quality, thermal environment, lighting and acoustics; German version EN 15251:2012. DIN EN 15251.
- Erickson, V. L., & Cerpa, A. E. (2012). Thermovote: participatory sensing for efficient building HVAC conditioning. In Proceedings of the Fourth ACM Workshop on Embedded Sensing Systems for Energy-Efficiency in Buildings, pp. 9–16. ACM.
- Fanger, P. O. (1970). Thermal comfort analysis and applications in environmental engineering. New York: McGraw-Hill.
- Friedman, H. H., & Amoo, T. (1999). Rating the rating scales. Journal of Marketing Management, 9(3), 114–123.
- Gagge, A. P., Stolwijk, J., & Hardy, J. (1967). Comfort and thermal sensations and associated physiological responses at various ambient temperatures. Environmental Research, 1(1), 1–20. doi: 10.1016/0013-9351(67)90002-3
- Gagge, A. P., Stolwijk, J., & Nishi, Y. (1971). An effective temperature scale based on a simple model of human physiological regulatory response. ASHRAE Transactions, 77(1), 247–262.
- Goto, T., Mitamura, T., Yoshino, H., Tamura, A., & Inomata, E. (2007). Long-term field survey on thermal adaptation in office buildings in Japan. Building and Environment, 42(12), 3944–3954. doi: 10.1016/j.buildenv.2006.06.026
- Griffiths, I. (1990). Thermal comfort studies in buildings with passive solar features; field studies, Report No. ENS35090. Technical report, Commission of the European Community.
- Halawa, E., & van Hoof, J. (2012). The adaptive approach to thermal comfort: A critical overview. Energy and Buildings, 51, 101–110. doi: 10.1016/j.enbuild.2012.04.011
- Hawighorst, M., Schweiker, M., & Wagner, A. (2015). The psychology of thermal comfort: Influences of thermo-specific self-efficacy and climate sensitiveness. In M. Loomans & M. te Kulve (Eds.), Proceedings of the healthy buildings Europe, Eindhoven the psychology of thermal comfort: Influences of thermo-specific self-efficacy and climate sensitiveness.
- Heidari, S., & Sharples, S. (2002). A comparative analysis of short-term and long-term thermal comfort surveys in Iran. Energy and Buildings, 34(6), 607–614. doi: 10.1016/S0378-7788(02)00011-7
- Hong, S. H., Gilbertson, J., Oreszczyn, T., Green, G., & Ridley, I. (2009). A field study of thermal comfort in low-income dwellings in England before and after energy efficient refurbishment. Building and Environment, 44(6), 1228–1236. doi: 10.1016/j.buildenv.2008.09.003
- Houghten, F., & Yagloglou, C. (1923). Determination of the comfort zone. Journal of ASHVE, 29, 361–384.
- Huizenga, C., Abbaszadeh, S., Zagreus, L., & Arens, E. A. (2006). Air quality and thermal comfort in office buildings: Results of a large indoor environmental quality survey. In Proceedings of conference: Healthy Buildings, Vol. III, 393–397. Lisbon, Portugal.
- Humphreys, M. A. (1976). Field studies of thermal comfort compared and applied. Journal of the Institution of Heating and Ventilating Engineers, 44, 5–27.
- Humphreys, M. A., & Hancock, M. (2007). Do people like to feel ‘neutral’?: Exploring the variation of the desired thermal sensation on the ASHRAE scale. Energy and Buildings, 39(7), 867–874. doi: 10.1016/j.enbuild.2007.02.014
- Humphreys, M. A., & Nicol, J. F. (2004). Do people like to feel ‘neutral’? Response to the ASHRAE scale of subjective warmth in relation to thermal preference, indoor and outdoor temperature. ASHRAE Transactions, 110(2), 569–577.
- Humphreys, M., Rijal, H., & Nicol, J. (2010). Examining and developing the adaptive relation between climate and thermal comfort indoors. In Proceedings of conference: Adapting to change: new thinking on comfort, Windsor, UK, Network for Comfort and Energy Use in Buildings, London, pp. 9–11.
- Indraganti, M., & Rao, K. D. (2010). Effect of age, gender, economic group and tenure on thermal comfort: A field study in residential buildings in hot and dry climate with seasonal variations. Energy and Buildings, 42(3), 273–281. doi: 10.1016/j.enbuild.2009.09.003
- ISO 10551. (1995). Ergonomics of the thermal environment–assessment of the influence of the thermal environment using subjective judgement scales. Geneva, Switzerland: International Organization for Standardization.
- Jazizadeh, F., Marin, F. M., & Becerik-Gerber, B. (2013). A thermal preference scale for personalized comfort profile identification via participatory sensing. Building and Environment, 68, 140–149. doi: 10.1016/j.buildenv.2013.06.011
- Karjalainen, S. (2012). Thermal comfort and gender: A literature review. Indoor Air, 22(2), 96–109. doi: 10.1111/j.1600-0668.2011.00747.x
- Kolarik, J., Toftum, J., Olesen, B. W., & Shitzer, A. (2009). Occupant responses and office work performance in environments with moderately drifting operative temperatures (rp-1269). HVAC&R Research, 15(5), 931–960. doi: 10.1080/10789669.2009.10390873
- Lantz, B. (2013). Equidistance of Likert-type scales and validation of inferential methods using experiments and simulations. Electronic Journal of Business Research Methods, 11(1), 16–28.
- Lautenbacher, S., Moltner, A., & Strian, F. (1992). Psychophysical features of the transition from pure heat perception to heat pain perception. Perception & Psychophysics, 52(6), 685–690. doi: 10.3758/BF03211705
- Lee, J.-Y., Stone, E. A., Wakabayashi, H., & Tochihara, Y. (2010). Issues in combining the categorical and visual analog scale for the assessment of perceived thermal sensation: Methodological and conceptual considerations. Applied Ergonomics, 41(2), 282–290. doi: 10.1016/j.apergo.2009.07.007
- Macfarlane, W. (1978). Thermal comfort studies since 1958. Architectural Science Review, 21(4), 86–92. doi: 10.1080/00038628.1978.9697240
- McIntyre, D. (1978). Seven point scales of warmth. Building Services Engineering Research and Technology, 45, 215–226.
- McIntyre, D. A. (1980). Indoor climate. London: Applied Science Publisher.
- Melzack, R., & Casey, K. L. (1968). Sensory, motivational, and central control determinants of pain. In The skin senses, pp. 423–439.
- Nicol, J., Doré, C., Weiner, J., Lee, D., Prestidge, S., & Andrews, M. (1973). Comfort studies of rail passengers. British Journal of Industrial Medicine, 30(4), 325–334.
- Nicol, J. F., & Humphreys, M. A. (2002). Adaptive thermal comfort and sustainable thermal standards for buildings. Energy and Buildings, 34, 563–572. doi: 10.1016/S0378-7788(02)00006-3
- Nicol, J. F., & Humphreys, M. A. (2010). Derivation of the adaptive equations for thermal comfort in free-running buildings in European standard EN15251. Building and Environment, 45, 11–17. doi: 10.1016/j.buildenv.2008.12.013
- Olesen, B. W. (2007). The philosophy behind EN15251: Indoor environmental criteria for design and calculation of energy performance of buildings. Energy and Buildings, 39(7), 740–749. Comfort and Energy Use in Buildings – Getting Them Right. doi: 10.1016/j.enbuild.2007.02.011
- Parsons, K. (2014). Human thermal environments (3rd ed). Boca Raton, FL: CRC Press.
- Paulhus, D. L. (1991). Measurement and control of response bias.
- R Development Core Team. (2012). R: A language and environment for statistical computing. Vienna, Austria: R Foundation for Statistical Computing. ISBN 3-900051-07-0.
- Rohles, F., Woods, J., & Morey, P. (1989). Indoor environment acceptability: The development of a rating scale. ASHRAE transactions, 95, 23–27.
- Rohles, F. H. (2007). Temperature & temperament: A psychologist looks at comfort. ASHRAE Journal, 49(2), 14–22.
- Schwarz, N., & Sudman, S. (2012). Context effects in social and psychological research. New York: Springer Science & Business Media.
- Schweiker, M., Brasche, S., Bischof, W., & Wagner, A. (2012). Is there a method for understanding human reactions to climatic changes? – Developing experimental designs for climate chambers and field measurements to reveal further insights to adaptive processes. Proceedings of 7th Windsor Conference: The changing context of comfort in an unpredictable world Cumberland Lodge, Windsor, UK.
- Schweiker, M., & Wagner, A. (2015). A framework for an adaptive thermal heat balance model (ATHB). Building and Environment, 94, 252–262. doi: 10.1016/j.buildenv.2015.08.018
- Schweiker, M., & Wagner, A. (2016). The effect of occupancy on perceived control, neutral temperature, and behavioral patterns. Energy and Buildings, 117, 246–259. doi: 10.1016/j.enbuild.2015.10.051
- Singh, M. K., Mahapatra, S., & Atreya, S. (2011). Adaptive thermal comfort model for different climatic zones of North-East India. Applied Energy, 88(7), 2420–2428. doi: 10.1016/j.apenergy.2011.01.019
- Spagnolo, J., & de Dear, R. (2003). A field study of thermal comfort in outdoor and semi-outdoor environments in subtropical Sydney Australia. Building and Environment, 38(5), 721–738. doi: 10.1016/S0360-1323(02)00209-3
- Stevens, S. S. (1960). The psychophysics of sensory function. American Scientist, 48(2), 226–253.
- Tablada, A., De Troyer, F., Blocken, B., Carmeliet, J., & Verschure, H. (2009). On natural ventilation and thermal comfort in compact urban environments – The old Havana case. Building and Environment, 44(9), 1943–1958. doi: 10.1016/j.buildenv.2009.01.008
- Toftum, J., Wyon, D., Svanekjær, H., & Lantner, A. (2005). Remote performance measurement (rpm)–a new, internet-based method for the measurement of occupant performance in office buildings. In 10th International Conference on Indoor Air Quality and Climate, pp. 357–361.
- Tuomaala, P., Holopainen, R., Piira, K., & Airaksinen, M. (2013). Impact of individual characteristics such as age, gender, BMI and fitness on human thermal sensation. Proceedings of BS, pp. 26–28.
- Villemure, C., & Bushnell, M. C. (2009). Mood influences supraspinal pain processing separately from attention. Journal of Neuroscience, 29(3), 705–715. doi: 10.1523/JNEUROSCI.3822-08.2009
- Wager, T. D., Rilling, J. K., Smith, E. E., Sokolik, A., Casey, K. L., Davidson, R. J., … Cohen, J. D. (2004). Placebo-induced changes in FMRI in the anticipation and experience of pain. Science, 303(5661), 1162–1167. doi: 10.1126/science.1093065
- Wiech, K., Kalisch, R., Weiskopf, N., Pleger, B., Stephan, K. E., & Dolan, R. J. (2006). Anterolateral prefrontal cortex mediates the analgesic effect of expected and perceived control over pain. Journal of Neuroscience, 26(44), 11501–11509. doi: 10.1523/JNEUROSCI.2568-06.2006
- Winslow, C.-E., Herrington, L. P., & Gagge, A. P. (1937). Relations between atmospheric conditions, physiological reactions and sensations of pleasantness. American Journal of Epidemiology, 26(1), 103–115. doi: 10.1093/oxfordjournals.aje.a118325
- Wong, N., Feriadi, H., Lim, P., Tham, K., Sekhar, C., & Cheong, K. (2002). Thermal comfort evaluation of naturally ventilated public housing in Singapore. Building and Environment, 37(12), 1267–1277. doi: 10.1016/S0360-1323(01)00103-2
- Wong, N. H., & Khoo, S. S. (2003). Thermal comfort in classrooms in the tropics. Energy and Buildings, 35(4), 337–351. doi: 10.1016/S0378-7788(02)00109-3
- Yang, W., & Zhang, G. (2008). Thermal comfort in naturally ventilated and air-conditioned buildings in humid subtropical climate zone in China. International Journal of Biometeorology, 52(5), 385–398. doi: 10.1007/s00484-007-0133-4
- Yun, H., Nam, I., Kim, J., Yang, J., Lee, K., & Sohn, J. (2014). A field study of thermal comfort for kindergarten children in Korea: An assessment of existing models and preferences of children. Building and Environment, 75, 182–189. doi: 10.1016/j.buildenv.2014.02.003
- Zhang, Y., & Altan, H. (2011). A comparison of the occupant comfort in a conventional high-rise office block and a contemporary environmentally-concerned building. Building and Environment, 46(2), 535–545. doi: 10.1016/j.buildenv.2010.09.001
- Zhang, Y., Wang, J., Chen, H., Zhang, J., & Meng, Q. (2010). Thermal comfort in naturally ventilated buildings in hot-humid area of China. Building and Environment, 45(11), 2562–2570. doi: 10.1016/j.buildenv.2010.05.024