
 ?Mathematical formulae have been encoded as MathML and are displayed in this HTML version using MathJax in order to improve their display. Uncheck the box to turn MathJax off. This feature requires Javascript. Click on a formula to zoom.
ABSTRACT
The commitments to mitigate the negative impacts associated with final energy use stipulate the increase of energy efficiency of the built environment. This is the focus of urban energy policies and of built stock energy models that aid them. The complexities behind the phenomenon, however, hinder the development of the means for controlling and unbiased modelling. Such tasks necessitate the empirical evidence of causal relationships between architectural and technical attributes and building energy performance at the population level. This study, therefore, elaborates on the methods of inferential statistics for establishing such causal effects. The focus is on the methods of frequentist inference, active use of which may advance the understanding of the phenomenon and foster more accurate modelling practices. The case study examines the energy performance exhibited by distinct configurations of construction periods, envelope materials, sources of energy for space heating and the ventilation system types. The empirical sample consists of more than 11,000 records registered in the Norwegian energy performance certification system. The results document the effects and their significance. These methods are applicable in any urban context and may provide the empirical basis for promoting/discouraging certain technological and architectural tendencies, and simulating the phenomena through probabilistic programming.
Introduction
Energy use in buildings is seen as one of the key bottlenecks in the transition towards more sustainable cities, communities and nations. Improving the energy efficiency and energy flexibility of the built stock, therefore, is amongst the central components of urban development strategies which are being initiated, supported and/or supervised through a variety of political mechanisms (Kennedy et al., Citation2014; Tozer, Citation2020). Developing, implementing and reviewing such mechanisms rely on long-term urban energy planning that seeks to accurately predict and rationally match future energy use to the generation capacities. Building energy use at the urban level, however, is a complex phenomenon governed by multiple factors of socioeconomic, architectural, technical, environmental and other kinds. Such complexities, amplified by the heterogeneity and the continuous evolution of the built environment, entail uncertainties that undermine the plausibility of energy planning. Developing the means for analysing and predicting the phenomenon while overcoming these challenges is the subject of built stock energy modelling and has important implications for achieving sustainability targets.
The significance of stock-wide energy modelling for practical and policy-related applications is one of the reasons for elevated attention to such models in building energy research (Johari et al., Citation2020; Moghadam et al., Citation2017; Reinhart & Davila, Citation2016). Given a variety of objectives that build stock energy modelling may pursue, their design, methodological foundations and resource needs may differ substantially. These characteristics are the basis for the hierarchical model classification proposed by Swan and Ugursal (Citation2009). A more recent study by Langevin et al. (Citation2020) suggested an extended classification of models by design and several additional criteria to determine their taxonomic affiliation, namely the degree of transparency, system boundaries, spatial resolution, temporal dynamics and the approach to handle the uncertainties.
The prevailing modelling practices, although indisputably instrumental at addressing their objectives, do not rest on empirically validated causal relationships between building attributes and the energy performance at a population level. Even if such relationships may have been established for individual buildings, projecting them to the urban scale implies the risks of biased results. The bias is caused by a virtually infinite number of aspects that, directly and indirectly, statically and dynamically, individually and jointly, affect the real energy use at a population level. Addressing such complexities represents a significant challenge. To maintain the data, labour and computational resources rational, modelling procedures often involve the assumptions and approximations in relationships. These are, ultimately, some of the key drivers of the performance gap (van den Brom et al., Citation2018; Menezes et al., Citation2012) and elevate the risks of developing irrelevant theories, making misleading conclusions and pursuing implausible or ineffective energy strategies.
Establishing the causal relationships with explicit account for variabilities in final energy use at the population level is advocated by energy epidemiology - a framework for incisive analysis and modelling proposed by Hamilton et al. (Citation2013). Methodologically, it implies synthesizing the analytical instruments used in health sciences with already established architecture- and engineering-based foundations of building energy research. Epidemiological approaches articulate the need for robust conclusions about the direct and indirect, individual and joint causal effect of a certain factor on the phenomenon of interest. It is, for example, expected that within the built stock renovation program, insulation of building envelope leads to energy savings (direct positive effect) (Jones et al., Citation2013). The occupant may, however, prefer elevated indoor temperature setpoints once the renovation is done which leads to higher energy use (indirect negative effect), a.k.a. rebound effect (Guerra Santin, Citation2013; Hamilton, Citation2016). Furthermore, the joint influence of multiple factors is likely to result in ‘effect modification’, e.g. the energy savings that follow envelope insulation together with the deployment of renewable energy technologies is not equal to the sum of savings from these measures if implemented separately.
Documented evidence-based causal relationships, considering the inherent variabilities handled through the epidemiological approach, may enable to (i) acquire a better theoretical understanding of the phenomenon; (ii) improve the accuracy of modelling practices; (iii) rationalize the energy planning and the associated legislative mechanisms. Although these needs are understood, building energy research lacks the means to address them. The causalities are commonly documented by comparing the parameters of central tendency (mean, median, mode), dispersion (variance, standard deviation, interquartile range, support) and shape (skewness, kurtosis) of the empirical univariate sample distribution, as shown in van den Brom et al. (Citation2019); Gangolells et al. (Citation2016); Hjortling et al. (Citation2017). Individually, neither of these parameters characterize the phenomenon through the entire range of possible values. More comprehensive metrics must be used to facilitate the conclusions about the causal relationships. Probability density function (PDF) and probability mass function (PMF) are therefore used as parsimonious representations of continuous and discrete phenomena accordingly. PDF or PMF accommodate the central tendency, dispersion and shape of the distribution, represent a statistical model capable of generating synthetic data and hence, used for carrying out simulations facilitated by the methods of probabilistic programming (Zhuravchak et al., Citation2021). The procedure of identifying the underlying PDF or PMF given the empirical sample is referred to as density estimation.
Documenting the properties of the population based on the available subset (empirical sample) is the objective of statistical inference, density estimation being one of its components. The focus on population makes statistical inference distinct from the descriptive analysis which is focused on the empirical sample only. The practices of statistical inference follow either of the two established paradigms: frequentist and Bayesian inference. The debates on theoretical correctness, practical benefits and the possible synthesis of frequentist and Bayesian approaches last for a century (Bayarri & Berger, Citation2004; Cox, Citation2006; Raue et al., Citation2013). In numerous applications dealing with knowledge discovery and modelling, the choice between these approaches is driven primarily by the objectives, considerations on the accessibility and quality of data, availability of prior information and computational resources. In the built stock energy research, density estimation is often approached using Bayesian inference, as a part of either forward or inverse uncertainty analysis procedures (Tian et al., Citation2018). The distributions of parameters related to architectural and operational characteristics of the buildings, for example, are documented in several studies (Booth et al., Citation2012; Heo et al., Citation2015; Tian & Choudhary, Citation2012; Zhao et al., Citation2016). The variability of typology-specific actual building energy performance is quantified by Choudhary (Citation2012), Choudhary and Tian (Citation2014), Braulio-Gonzalo et al. (Citation2016). Frequentist methods are scarcely represented in the domain literature, with one example of density estimation by Fonseca and Panão (Citation2017).
Unless the data for the entire population is collected, any conclusions about the population based on a randomly collected sample are prone to errors. That is, there is the risk that the causal relationships apparent in the sample do not apply to the population. In such a case, projecting the sample-based analysis on the population leads to biased results. Most of the time, however, collecting the data for the whole population is irrational or impossible to carry out. To address the problems of this kind, both frequentist and Bayesian inference provide the methods of hypothesis testing (Silva, Citation2018) that yield a measure of confidence in any claims related to causal relationships. Statistical hypothesis testing, despite its appreciation in epidemiological studies (Rigby, Citation1998) and scientific practices in general (Mizrahi, Citation2020), is not being used systematically in building energy research. One of the likely causes is that hypothetical reasoning is amongst the most challenging statistical concepts to explain and to comprehend (Park, Citation2019).
This study, therefore, is motivated by the need to elaborate on some methods for determining the causal relationships in the context of energy epidemiology, with the focus on frequentist approaches (Section Methodology). Statistical hypothesis testing, in this study, is represented by Kolmogorov–Smirnov (KS) test. Density estimation - by maximum likelihood estimation (MLE) and several metrics for judging the goodness-of-fit. The case study is based on the empirical dataset, as described in Methodology section, and exemplifies (in Results section): (i) hypothesis testing procedures to find if the age, envelope material, source of energy for space heating and the type of ventilation system have direct or indirect implications on the actual energy performance of the population of apartments in Oslo, Norway; (ii) density estimation to document the variability of energy performance between apartments having distinct combinations of these attributes. This enabled identifying the combinations of attributes that exhibit relatively high and low energy performance within the scope of the case study. Discussion section points towards several practical applications of the methods discussed, evaluates the possibilities for upscaling and diversifying the scope and outlines several alternative methods of interest. A summary of findings is provided in Conclusion section. These findings are partially based on and can be reproduced/replicated through Built Stock Explorer (https://buildingstockexplorer.indecol.no) – an open access research software for knowledge discovery and modelling of the Norwegian built stock.
Methodology
Empirical data
Following the Energy Performance of Buildings Directive (EPBD) 2002/ 91/ EC, the Norwegian strategy for advancing towards low energy use in buildings is assisted by the Energy Labelling System for Houses and Dwellings (Brekke et al., Citation2018). One of the outputs of this system is the energy performance certificate (EPC) registry. EPCs contain the reported total annual energy use () per certified unit and its source-specific annual energy use if more than one source is used. The values are averaged over 3 years of the building's operation to account for the varying weather conditions, occupancy- and maintenance-related factors. The reported total annual energy use normalized per unit of heated floor area is a continuous random variable that reflects the actual energy performance - a reported total energy use intensity (EUI) in
.
The residential built stock in Oslo consists of apartment blocks and several typologies of houses, namely detached, semi-detached, chained, terraced and quad house. In the EPC registry, the apartment is the most frequent typology, reaching 74% by records count, 54% by heated floor area and 52% by total annual energy use amongst all the residential units. Certified apartments have four attributes relevant to this study, namely:
| (1) | Construction period (CP) > 1990: binary [True, False]; | ||||
| (2) | Primary envelope material (EM) used: either of [Concrete, Brick, Wood]; | ||||
| (3) | Source of energy for space heating (SH): either or a combination of [Electricity (El), District heating (DH), Wood, Gas, Oil, Heat pump (HP)]; | ||||
| (4) | Ventilation system (VS) type: either of [Natural (N), Periodical (P) extraction, Continuous (C) extraction, Balanced (B)]. | ||||
The construction period is seen as a proxy to architectural and envelope-related measures made to comply with the energy performance standards active during a certain period. Historically, in Norway, substantial improvements in the energy performance requirements occurred in 1990 (Sandberg et al., Citation2016; Sartori et al., Citation2009). The year 1990, therefore, is used in this study as the basis for separating the empirical sample into two groups. The other attributes reflect structural, technological and indoor environmental comfort considerations which are likewise expected to affect the actual energy performance. In addition to the direct effects triggered by the building attributes, they could be the cause and/or the result of more indirect tendencies of socio-cultural, physiological, economic and other kinds exhibited by the occupants. The inferential analysis presented in this study, therefore, examines both direct and indirect effects associated with building attributes.
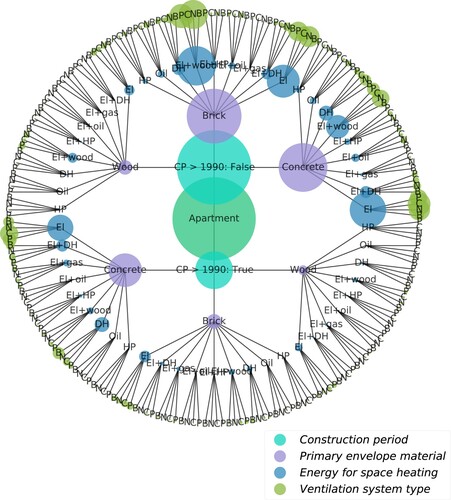
The subset of the EPC registry, limited to apartments in Oslo, with the reported total EUI and the four attributes specified, constitutes a sample of 11,163 records. These units have distinct combinations of attributes, each of which is defined explicitly in this study. The number of all possible combinations of two CPs, three EMs, nine unique combinations of energy sources for SH and four VS types is given by the cardinality (216) of the Cartesian product of these attributes. All possible combinations of these attributes are illustrated as a circular tree structure in . A central (root) node in represents the entire sample (11,163 records) of apartments in Oslo. This node has two child nodes representing the subsets of apartments in Oslo constructed (i) before and (ii) after 1990. Similarly, each of these nodes has the child nodes that represent the subsets of distinct EMs, sources of energy for SH and VS types. This tree structure has 216 leaf nodes that form the outermost circle. Every distinct path from the root to the leaf node defines a unique combination of four attributes that characterize the apartments in Oslo. The diameter of the node is proportional to the size of the sample represented by this node.
Figure 1. Building attributes structured as a circular tree.
Statistical hypothesis testing
Identifying the direct or indirect effects of building attributes on the energy performance involves comparing the samples of the energy performance of buildings with and without this attribute. However, since the available empirical sample is only a subset of the population, the effect observed in the data may occur by chance. Statistical hypothesis testing, therefore, answers the question: ‘If the attribute does not affect the energy performance in the population, how likely is it to observe this effect in the empirical sample that represents this population?’
A formal hypothesis testing requires (i) the choice of test statistic -- the metrics that quantify the effect of interest, e.g. differences in population means, population proportions, etc.; (ii) the formulation of the null hypothesis, which is an initial assumption about the absence of direct or indirect effect measured by the test statistic; (iii) computing the p-value (), which is the likelihood of observing a certain effect provided that the null hypothesis is true; (iv) judging the statistical significance of the results: small p-value suggests that the observed effect is not likely to occur by chance (implies rejecting the null hypothesis), a large p-value implies a failure to reject the null hypothesis. This decision is typically based on comparing p-value to the threshold α of statistical significance established prior to the experiment.
Figure 2. p-value under the distribution of test statistic x.
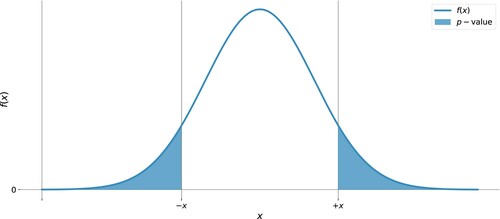
In , the shaded area illustrates p-value as the likelihood of observing the values of the test statistic as large as x or more extreme. The illustration applies to two-sided tests since p-value accounts for extreme values on both sides of the distribution. Alternatively, one-sided tests can be used (outside the scope of this study).
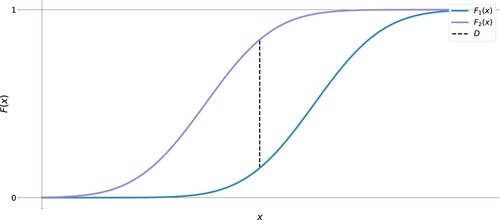
This study tests the null hypothesis formulated as ‘distinct combinations of building attributes do not affect the energy performance’. Rejecting this hypothesis is made at a significance level . The test statistic and the calculation of p-value are based on the KS test (Bhattacharya et al., Citation2016; Feldman & Valdez-Flores, Citation2010). In the (two-sided) KS test, a measure D of conformity between two empirical samples is the supremum of the difference between their cumulative distribution functions (CDF) (Marsaglia et al., Citation2003):
(1)
(1) where: x, random variable;
, CDF of sample being tested;
, CDF of the sample against which the test is carried out.
illustrates the empirical CDFs of two arbitrary samples and the associated D-statistic. Because the CDF fully characterizes the central tendency and the dispersion of the empirical sample, the KS test is recognized as a comprehensive and convenient method for hypothesis testing. This is a non-parametric test, applicable to any empirical and theoretical distributions. The p-value associated with the test can be found from the asymptotic distribution of the KS test statistic.
Figure 3. Empirical CDFs of two arbitrary samples and the D-statistic.
Density estimation
Density estimation seeks to fit (and to evaluate the goodness-of-fit) a set of parameters θ that characterize the PDF of the theoretical random variable X to the empirical sample
. MLE (Robert & Casella, Citation2013; Thomopoulos, Citation2017) is a method for finding the parameters θ by solving a multivariate unconstrained optimization problem of maximizing the log-likelihood function that has a form:
(2)
(2)
The objective of MLE may be achieved with numerous optimization techniques, such as the downhill simplex (Nelder–Mead) method (Gao & Han, Citation2012; Härdle et al., Citation2017; Nelder & Mead, Citation1965), where the objective function converges by adjusting the arbitrary-selected initial parameters step-wisely. The objective is met either if the error tolerance satisfies a certain criterion or if the objective function exhibits no changes for several past iterations.
Goodness-of-fit between the theoretical parameterized distribution and the empirical data must be quantified further. A KS test, discussed above, may be adapted for this purpose, with D-statistic and the associated p-value used as reference metrics. High p-value suggests that the null hypothesis ‘the observed sample is the outcome of the fitted PDF’ cannot be rejected. The conformity between the sample density and the theoretical parameterized PDF can be also quantified with the sum of squared errors (SSE, Equation (Equation3(3)
(3) )), where a small SSE indicates a better fit. Another instrumental metric is the coefficient of determination
(squared coefficient of correlation R) of the linear least-squares fit between the quantiles of the theoretical distribution and the ordered values of the sample.
quantifies the total variation in the sample described by the variation in the theoretical quantiles. High
suggests a good fit and vice versa.
(3)
(3) where
, sample density at the ith interval;
, density of a fitted PDF at the ith interval; n, number of intervals considered.
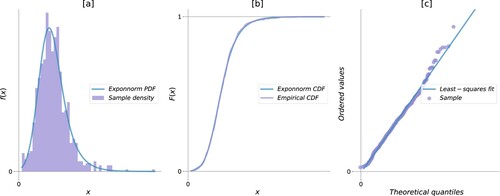
exemplifies the metrics for goodness-of-fit associated with fitting the exponentially modified Normal (Exponnorm) distribution to the empirical sample. The figure suggests overall conformity between the empirical sample and the parameterized distribution. The theoretical PDF (a) approximates the density histogram, with occasional underestimated spikes compensated by overestimating the neighbouring density. This fit is associated with a small SSE. A theoretical continuous CFD (b) follows the step function of the empirical CDF, with rare minor deviations. The corresponding D-statistic is small, and the p-value is high. A strong positive correlation between theoretical quantiles and the empirical values can be observed ( c), with negligible deviations from the linear fit and, therefore, high . The example demonstrates the key goal of density estimation - obtaining an approximate parametric description of the data generating process. It is not possible and not attempted to assure that the observed empirical sample is generated by one distribution and not another. The p-value solely suggests that the observed D-statistic is not too rare to reject the choice of the distribution. SSE and the
provide the quantitative metrics to support the choice of the distributions amongst the alternatives and to better understand the performance of the probabilistic model based on this fit.
Figure 4. Goodness-of-fit between the arbitrary sample and the MLE-parameterized exponentially-modified Normal distribution: (a) sample density histogram over 100 bins with the PDF of a fitted distribution; (b) an empirical CDF with the CDF of a fitted distribution; (c) probability plot, i.e. quantiles in the PDF of a fitted distribution against the ordered values of the empirical sample with the linear fit.
Results
The method of statistical hypothesis testing introduced above assists with concluding if buildings characterized by distinct attributes have distinct energy performance. The difference and the statistical significance of such difference are quantified and documented for individual attributes. A significance level for hypothesis testing through this study is set to . The KS test statistic enabled identifying which building configurations amongst those analysed are most- and least favourable for better energy efficiency of the built stock within the scope of the study. This section also elaborates and documents the results of density estimation per individual building configuration. The reference is made to whenever applicable to explain which sample(s) are considered.
Attribute-wise analysis of conformity
The first question of interest is formulated as: ‘do the populations of apartments in Oslo, constructed [1] before and [2] after 1990 have a significant difference in their energy performance?’. The null- and the alternative hypothesis are set as follows:
(4)
(4) where
, energy use intensity (
) of the population [1];
, energy use intensity (
) of the population [2].
The empirical samples used for testing correspond to all the EPC records for apartments in Oslo where [1] CP and [2] CP
. These samples are accommodated by all the nodes in [1] upper and [2] lower semicircles accordingly in . The results of the test are illustrated in .
Figure 5. Energy performance of apartments in Oslo, by construction periods: (a) ECDFs of the samples; (b) D-statistic found with KS test; (c) p-values associated with the test.
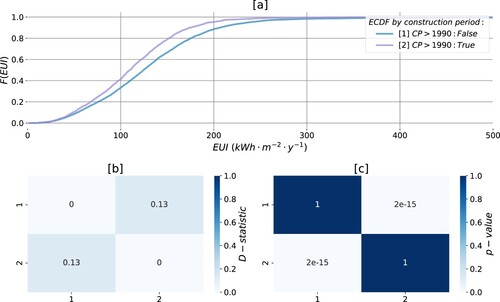
Empirical cumulative distribution functions (ECDF) in (a) suggest that the phenomenon exhibits distinct properties in the two groups, particularly in the range []
. The energy performance of recently built apartments is evidently better. The non-diagonal elements in the colour-encoded matrix (b) illustrate the largest absolute difference (D-statistic) found within pairwise KS testing. Obtaining this D-statistic is associated with rather small p-values illustrated as the non-diagonal elements (c). Because the p-values obtained through the test are substantially smaller than the established significance level
, the null hypothesis is rejected. With the available empirical samples, energy use intensity in the populations of apartments in Oslo constructed [1] before and [2] after 1990 is found to differ significantly.
Pairwise KS testing enables examining the implications of the other attributes on building energy performance. illustrates the results of KS testing to answer the next question: ‘is there a significant difference in the energy use intensities between populations of apartments in Oslo that have [1] concrete, [2] bricks or [3] wood as a primary construction material in their envelope?’. All nodes matching a specific envelope material in either of construction periods (upper or lower semicircle in ) constitute the empirical samples.
Figure 6. Energy performance of apartments in Oslo, by envelope material: (a) ECDFs of the samples; (b) D-statistic found with KS test; (c) p-values associated with the test.
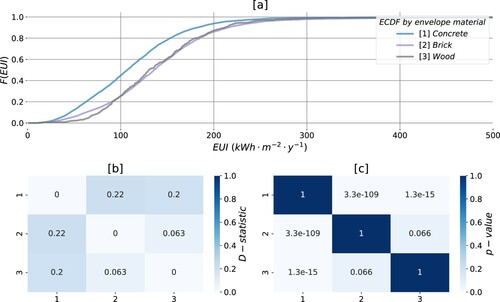
(a) suggests that apartments constructed with [1] concrete exhibit better energy performance compared to the alternatives. Energy use intensity in this population is significantly different from apartments built with bricks [2] or wood [3], which is conveyed by small p-values associated with the tests [1] –[2] and [1] – [3] accordingly in (c). The null hypothesis adapted from Equation (Equation4(4)
(4) ) which asserts the conformity between populations, in this case, can be rejected. The p-value returned by the test [2] and [3], however, exceeds the significance level α, meaning that the significant evidence against the null hypothesis is absent which implies a failure to reject it. It may be concluded that, given the empirical samples, the populations of apartments in Oslo constructed from [2] bricks and [3] wood do not have a significantly different energy use intensity.
Similarly to the previous attributes, implies rejecting or failing to reject the asserted null hypothesis for populations of apartments given the distinct sources of energy for space heating. All nodes matching a specific energy supply solution in any of construction periods and any of envelope materials () form the samples.
Figure 7. Energy performance of apartments in Oslo, by the source of energy for space heating: (a) ECDFs of the samples; (b) D-statistic found with KS test; (c) p-values associated with the test.
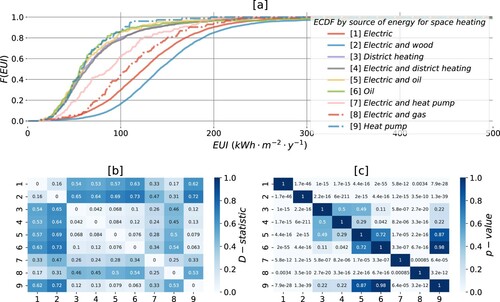
(a) suggests mutual conformity in the distribution of total energy use intensity amongst the apartments heated by [3,4] district heating, [5,6] oil and [9] heat pump. The differences ((b)) between their ECDFs are insignificant (c). Energy performance of apartments with space heating solutions based on [1] electricity only and the combinations of electricity with [2] wood, [7] heat pump and [8] natural gas is significantly different from any other alternatives considered (a–c). Electric combined with wood [1], on the one hand, and a group of solutions [3,4,5,6,9] on the other are the two extremes in the energy performance (a). Whereas for the latter, 80% of records use less than 100 , the share of such efficient units representing the former is only 20%.
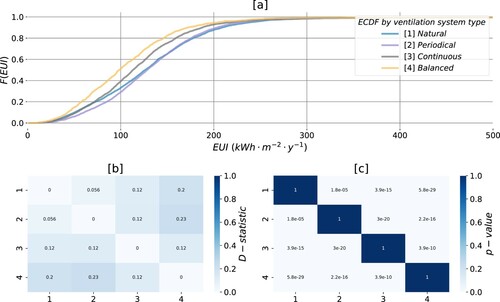
enables concluding that energy use intensity amongst the populations of apartments in Oslo featuring various types of ventilation systems differs significantly. The empirical samples include all the nodes matching [1] natural, [2] periodical extraction, [3] continuous extraction or [4] balanced ventilation systems in . (a) suggests that the units equipped with the balanced [4] system perform better compared to the alternatives. With the empirical interpretation of (a), 50% of such units use less than 100 which is followed by continuous extraction [3] (40%). The units having natural [1] and periodical [2] types appear as the least efficient, and often mutually conforming (a). The difference between these two types, however, is found to be significant given the choice of the test statistic and the significance threshold.
Figure 8. Energy performance of apartments in Oslo, by type of ventilation system: (a) ECDFs of the samples; (b) D-statistic found with KS test; (c) p-values associated with the test.
The most and the least favourable configurations
The section above provides the empirical evidence that there are differences in the energy performance of populations of apartments in Oslo given the energy sources for space heating, envelope materials, vintage and ventilation systems used. These differences, provided that they are significant, tend to vary across the distinct attributes, e.g. the energy sources for space heating are associated with a larger D-statistic compared to the construction period. Such variability hinders the understanding of which combination of attributes that constitute building configurations perform relatively better or worse. Additionally, actual building energy performance is likely to be governed by the attributes jointly rather than individually. This section, therefore, is concerned with finding which building configurations exhibit significantly better and significantly worse energy performance relative to the entire stock of apartments in Oslo. The task requires analysing all the members in the Cartesian product of four attributes provided that the sample of minimum size is available. In this study, the minimum required sample size is set arbitrary to 20 records. 62 out of 216 possible building configurations () met this requirement.
Identification of the best performing configurations amongst those available involves pairwise KS testing of the corresponding sample (leaf nodes in ) versus the composite sample (root node in ) of all the apartments. A favourable configuration is associated with a large positive D-statistic between the two ECDFs. For this difference to be considered significant, the p-value associated with the test should be below . A reverse objective focused on large negative D-statistic enables the identification of the worst-performing building configurations. illustrates 62 ECDFs for all building configurations and highlights the best- (a) and worst-performing (b) compared to the composite if the difference is significant.
Figure 9. ECDFs for 62 building configurations within the scope of the study. Ten configurations that are found to perform considerably better (a) or worse (b) compared to the composite are highlighted.
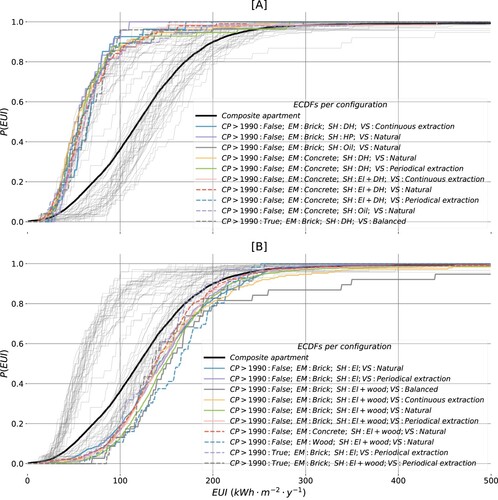
enables drawing several conclusions about the implications of building configurations on the actual energy performance. Building configurations already present in the built stock are associated with a wide spectrum of high and poor energy performance. Poorly performing apartments are typically more common (correspond to larger sample size), which governs a generally poor performance of the entire stock of apartments, as shown by the composite ECDF. To the largest extent, the distinction between the best- and poorest-performing configurations follows the distinct energy source for space heating, which, as shown earlier, reflect the largest significant differences in total energy use intensity. The least favourable configurations are featuring purely electric or electric with wood-based space heating solutions (b). Amongst the most favourable ones, the demand for space heating is fulfilled through district heating alone or in combination with electric heaters, through heat pumps or oil (a). The concrete- or brick-based building envelope is the most common amongst the apartments with low energy intensity (a). The walls made of bricks, however, also appear frequently amongst the least-favourable configurations (b). Despite having a high energy performance standard, new apartments are not common amongst those with the best energy performance (a). Some configurations involving new apartments appear amongst the worst-performing ones (b). Various types of the ventilation system are equally frequent amongst the least and most favourable configurations (a,b).
Density estimation for building configurations
Varying shapes and locations of the ECDFs in indicate that the populations of apartments with distinct building configurations exhibit distinct statistical properties, which can be effectively characterized by the PDFs. Accounting for these properties is crucial for probabilistic simulation of the populations. This objective necessitates selecting, parameterizing and evaluating the goodness-of-fit of the PDF for each building configuration.
Parameterized distributions that are found to characterize the empirical data per individual building configuration are documented in Appendix. The distribution and the parameters represent the MLE-based best fit (the smallest D statistic) amongst the 97 distributions available in scipy.stats if p-value exceeds 0.05. The ranges (Min–Max) of values that the random variables are known to take are specified. The metrics used to evaluate the goodness-of-fit (D-statistic, p-value, SSE and ) is present in the table together with the sample size (SS) that the fit is based on.
Discussion
The development of large-scale energy efficiency strategies necessitates building energy research to establish better theoretical foundations and more accurate modelling practices. It becomes apparent that these needs cannot be addressed through architectural and engineering knowledge alone, because of the underlying complexity, magnitude, dynamics and genuinely stochastic aspects that govern the phenomenon. The instruments of inferential statistics, intended for making robust conclusions under the acute variability, uncertainty and data scarcity, are often used in population health sciences and may tackle similar challenges in building energy research. This study, therefore, agrees with (Hamilton et al., Citation2013) on energy epidemiology as capable to address the performance gap at the population level.
From the epidemiological point of view, three mutually related questions about the population-level energy use are essential: (i) given all possible direct or indirect effects that the technical or architectural measures may have, is there evidence of causal relationships between these measures and the phenomenon? (ii) under such complex relationships, which combinations of building attributes exhibit the most- and the least-favourable energy performance? (iii) how can this knowledge inform more accurate modelling practices? This study exemplifies the achievable answers and elaborates on some of the applicable instruments.
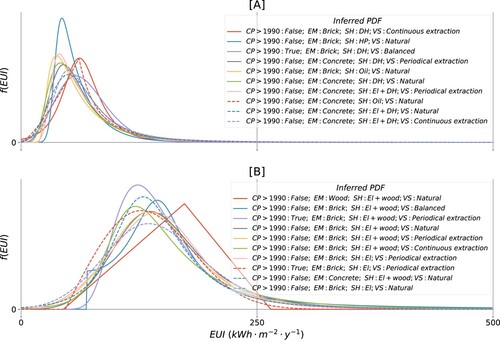
The results suggest that individually, the construction period, some primary envelope materials, some of the energy sources for space heating and all ventilation system types considered in this study entail a causal effect on the energy performance of apartments in Oslo. These are inferred at the significance level using the KS test. The energy policies that are targeting the building attributes that have a causal effect on the phenomenon can be used to mediate this phenomenon. The picture is less clear once more building attributes are under consideration since multiple effects are involved. Empirical evidence of a particular combination of attributes to perform better or worse compared to the alternatives is essential for energy policies that may promote or discourage certain architectural and technological tendencies in the built environment. A KS test statistic, therefore, is advocated in this study as the means for detecting the most and the least favourable combinations. An approach for structured sample analysis based on the hierarchical tree can be adapted to increasingly diversified combinations. Modelling of transformational processes in the built stock requires accommodating the underlying variability which is effectively addressed through the probabilistic framework. The inferred PDF for each combination of attributes is a parsimonious parametric approximate of the variability. The phenomenon can further be modelled as a random variable that follows its distribution. , for example, illustrates the parameterized distributions for the most- (a) and the least-favourable (b) building configurations identified in the Results section. Energy policies that support the substitution of units from the least with the ones from the most favourable groups is a rational step to increase the energy performance of the built stock within the shortest time. These conclusions, however, need to be justified and possibly corrected considering the expected targets, the size of populations targeted, the anticipated socioeconomic and technical constraints.
Figure 10. Theoretical distributions of the energy performance of apartments in Oslo featuring distinct building configurations: (a) with low and (b) high energy intensity, as described in Results.
In this study, a list of 216 possible building configurations () is not examined exhaustively due to the absence of the sample or the limited available sample size for some of them. Because of scarce presence in the EPC registry, the anticipated size of their populations is small and therefore, of little significance to the current total energy use at the municipal level. Given the continuous transformation of the built stock, future analysis is likely to reveal other promising combinations of attributes in addition to or instead of those found in this study. Revising these analytical results systematically is also necessary for maintaining the knowledge about the actual state and the development of the built stock.
A hierarchical structure enables further up- or downscaling of the scope of the analysis carried out in this study. The level of architectural and technological detail may be extended by numerous attributes of interest. Upscaling the scope may further improve the understanding of the phenomenon across building types, geographical and national contexts. The presented case study, for example, is focused on apartments which is the largest residential building type in Oslo. A more comprehensive and complete inference for the municipality must involve other typologies, energy performance of which is known to exhibit distinct statistical properties ().
Figure 11. ECDFs for 21 building types in Oslo, illustrating the variability of energy performance in both residential (RE) and non-residential (NR) buildings.
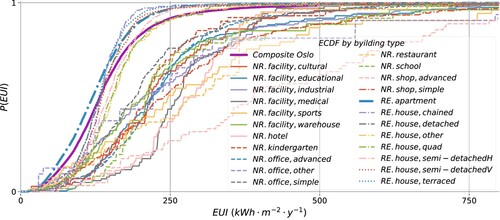
suggests the presence of two distinct groups of building types within the built stock. ECDFs of residential types are evidently shifted towards zero and steeper compared to the non-residential, which implies generally higher efficiency and smaller dispersion of the former. The variation among individual building types within both residential and non-residential groups is likewise evident. Comprehensive energy policies must consider the attributes that significantly affect the energy performance of all these typologies. A similar conclusion applies to the nation-wide energy efficiency programs.
The methods and procedures applied in this study are exemplary of a broader toolset offered by probability theory to tackle the problems alike. The analysis of skewness versus kurtosis proposed by Cullen and Frey (Citation1999), for example, may support the choice of a theoretical continuous distribution. Probability–Probability (P–P) and Quantile–Quantile (Q–Q) plots may inform about the goodness-of-fit likewise. Alternatively to the KS test, Cramer–von Mises and Anderson–Darling methods (D'Agostino & Stephens, Citation1986) may be instrumental for evaluating the goodness-of-fit between the empirical sample and the theoretical continuous distribution. Examining the criteria related to penalties in the log-likelihood functions, such as Akaike and Bayesian information criteria is also a common practice to consider for this task. The present study applies MLE for parameter estimation which has alternatives, e.g. several variations of minimum distance estimation, moment matching estimation and quantile matching estimation. In some cases, a downhill simplex method for finding the maximum of the log-likelihood function is substituted by e.g. Broyden–Fletcher–Goldfarb–Shanno or conjugate gradient algorithms.
Aided by the inferential analysis, meaningful conclusions about the population based on the sample necessitate rather strict demands from experimental design and data quality (Breiman, Citation2001; Miller, Citation2014). Distortion of measurements, errors in readings, reporting and registering the data affect the reliability of conclusions further based on it. Preventing and/or mitigating the bias occurring within data collection/measurement procedures must be supplemented by responsible data management practices and the objective interpretation of findings. Concerning this study, the potential source of bias is in identifying, measuring and reporting the characteristics and the energy use in the buildings certified. Unless there is a systematic source of large error, the conclusions are expected to be valid. Minor and seldom inaccuracies in simulating the phenomenon are tolerated by the probabilistic programming.
Conclusion
High energy efficiency and flexibility are amongst the pivotal characteristics envisioned for sustainable cities and neighbourhoods. Modelling of such complex systems necessitates systematic identification and documenting of the causal relationships between building attributes and the phenomenon at the population level. This study suggests the means to obtain the empirical evidence of such relationships, if any, under an acute variability of the phenomenon. It elaborates on (i) statistical hypothesis testing to aid with concluding whether the buildings featuring certain attributes have a causal effect on the energy performance and (ii) methods for density estimation to obtain a parsimonious probabilistic representation of variability. The former is discussed and exemplified with the Kolmogorov–Smirnov test whereas the latter, in this study, is focused on maximum likelihood estimation and several metrics for goodness-of-fit. The proposed hierarchical structure enables hypothesis testing and density estimation for virtually any number of attributes individually and in combinations. The same structure allows a more comprehensive inference with an extended list of attributes and an account for various building types, climate and administrative boundaries.
As exemplified through the case study, the combinations of building attributes already present in the built stock represent a wide spectrum, from high to poor energy performance. This leaves room for the policies to mediate them towards the achievement of energy-related and environmental targets. Practically, quantifying the variabilities given the architectural and technological configurations may provide the necessary support with setting realistic goals, identifying the bottlenecks/opportunities and screening the solutions for energy efficiency improvements.
Hence, several configurations are identified as capable of effectively improving the energy performance of the stock of apartments in Oslo. The case study likewise reveals the configurations that perform poorly and thus, considered to be the major barrier towards reducing the total energy use by apartments in the municipality. The former are typically featuring space heating solutions involving either district heating with and without electricity or oil or heat pumps and either concrete- or brick-based envelope. The latter rely on electricity alone or combined with wood to meet the demand for space heating and have either brick or concrete or wood as the main envelope material. The majority of apartments having distinctly high or low energy performance were constructed before 1990. Each configuration has unique statistical properties accommodated by the parameterized probability density function.
It is shown in this study that inferential statistics offers the essential means to improve the understanding of energy performance of the built stock, to advance the modelling approaches and thus, to safeguard the effectiveness of energy-related strategies based on these models.
Disclosure statement
No potential conflict of interest was reported by the author(s).
Additional information
Funding
References
- Bayarri, M., & Berger, J. (2004). The interplay of Bayesian and frequentist analysis. Statistical Science, 19(1), 58–80. https://doi.org/https://doi.org/10.1214/088342304000000116
- Bhattacharya, R., Lin, L., & Patrangenaru, V. (2016). A course in mathematical statistics and large sample theory. Springer.
- Booth, A., Choudhary, R., & Spiegelhalter, D. (2012). Handling uncertainty in housing stock models. Building and Environment, 48, 35–47. https://doi.org/https://doi.org/10.1016/j.buildenv.2011.08.016
- Braulio-Gonzalo, M., Juan, P., Bovea, M. D., & Ruá, M. J. (2016). Modelling energy efficiency performance of residential building stocks based on Bayesian statistical inference. Environmental Modelling & Software, 83(4), 198–211. https://doi.org/https://doi.org/10.1016/j.envsoft.2016.05.018
- Breiman, L. (2001). Statistical modeling: The two cultures (with comments and a rejoinder by the author). Statistical Science, 16(3), 199–231. https://doi.org/https://doi.org/10.1214/ss/1009213726
- Brekke, T., Isachsen, O. K., & Strand, M. (2018). EPBD implementation in Norway. Status in December 2016 (Tech. Rep.). Enova, Norwegian Water Resources and Energy Directorate (NVE), Norwegian Building Authority (DIBK).
- van den Brom, P., Hansen, A. R., Gram-Hanssen, K., Meijer, A., & Visscher, H. (2019). Variances in residential heating consumption – Importance of building characteristics and occupants analysed by movers and stayers. Applied Energy, 250(5–6), 713–728. https://doi.org/https://doi.org/10.1016/j.apenergy.2019.05.078
- van den Brom, P., Meijer, A., & Visscher, H. (2018). Performance gaps in energy consumption: Household groups and building characteristics. Building Research & Information, 46(1), 54–70. https://doi.org/https://doi.org/10.1080/09613218.2017.1312897
- Choudhary, R. (2012). Energy analysis of the non-domestic building stock of Greater London. Building and Environment, 51(8), 243–254. https://doi.org/https://doi.org/10.1016/j.buildenv.2011.10.006
- Choudhary, R., & Tian, W. (2014). Influence of district features on energy consumption in non-domestic buildings. Building Research & Information, 42(1), 32–46. https://doi.org/https://doi.org/10.1080/09613218.2014.832559
- Cox, D. (2006). Principles of statistical inference. Cambridge University Press.
- Cullen, A., & Frey, H. (1999). Probabilistic techniques in exposure assessment: A handbook for dealing with variability and uncertainty in models and inputs. Springer US.
- D'Agostino, R., & Stephens, M. (1986). Goodness-of-fit-techniques. Marcel Dekker Inc.
- Feldman, R., & Valdez-Flores, C. (2010). Applied probability and stochastic processes (2nd ed.). Springer-Verlag.
- Fonseca, J., & Panão, M. J. O. (2017). Monte Carlo housing stock model to predict the energy performance indicators. Energy and Buildings, 152(2), 503–515. https://doi.org/https://doi.org/10.1016/j.enbuild.2017.07.059
- Gangolells, M., Casals, M., Forcada, N., Macarulla, M., & Cuerva, E. (2016). Energy mapping of existing building stock in Spain. Journal of Cleaner Production, 112(10), 3895–3904. https://doi.org/https://doi.org/10.1016/j.jclepro.2015.05.105
- Gao, F., & Han, L. (2012). Implementing the Nelder–Mead simplex algorithm with adaptive parameters. Computational Optimization and Applications, 51(1), 259–277. https://doi.org/https://doi.org/10.1007/s10589-010-9329-3
- Guerra Santin, O. (2013). Occupant behaviour in energy efficient dwellings: Evidence of a rebound effect. Journal of Housing and the Built Environment, 28(2), 311–327. https://doi.org/https://doi.org/10.1007/s10901-012-9297-2
- Hamilton, I. G. (2016). Balancing theory with practice: Studying the rebound effect. Building Research & Information, 44(8), 935–938. https://doi.org/https://doi.org/10.1080/09613218.2016.1174909
- Hamilton, I. G., Summerfield, A. J., Lowe, R., Ruyssevelt, P., Elwell, C. A., & Oreszczyn, T. (2013). Energy epidemiology: A new approach to end-use energy demand research. Building Research & Information, 41(4), 482–497. https://doi.org/https://doi.org/10.1080/09613218.2013.798142
- Härdle, W., Okhrin, O., & Okhrin, Y. (2017). Basic elements of computational statistics. Springer International Publishing.
- Heo, Y., Augenbroe, G., Graziano, D., Muehleisen, R. T., & Guzowski, L. (2015). Scalable methodology for large scale building energy improvement: Relevance of calibration in model-based retrofit analysis. Building and Environment, 87(5–6), 342–350. https://doi.org/https://doi.org/10.1016/j.buildenv.2014.12.016
- Hjortling, C., Björk, F., Berg, M., & af Klintberg, T. (2017). Energy mapping of existing building stock in Sweden – analysis of data from energy performance certificates. Energy and Buildings, 153(October (5)), 341–355. https://doi.org/https://doi.org/10.1016/j.enbuild.2017.06.073
- Johari, F., Peronato, G., Sadeghian, P., Zhao, X., & Widén, J. (2020). Urban building energy modeling: State of the art and future prospects. Renewable and Sustainable Energy Reviews, 128(1), 109902. https://doi.org/https://doi.org/10.1016/j.rser.2020.109902
- Jones, P., Lannon, S., & Patterson, J. (2013). Retrofitting existing housing: How far, how much? Building Research & Information, 41(5), 532–550. https://doi.org/https://doi.org/10.1080/09613218.2013.807064
- Kennedy, C. A., Ibrahim, N., & Hoornweg, D. (2014). Low-carbon infrastructure strategies for cities. Nature Climate Change, 4(5), 343–346. https://doi.org/https://doi.org/10.1038/nclimate2160
- Langevin, J., Reyna, J., Ebrahimigharehbaghi, S., Sandberg, N., Fennell, P., Nägeli, C., & Camarasa, C. (2020). Developing a common approach for classifying building stock energy models. Renewable and Sustainable Energy Reviews, 133(1), 110276. https://doi.org/https://doi.org/10.1016/j.rser.2020.110276
- Marsaglia, G., Tsang, W. W., & Wang, J. (2003). Evaluating Kolmogorov's distribution. Journal of Statistical Software, Articles, 8(18), 1–4. https://doi.org/https://doi.org/10.18637/jss.v008.i18
- Menezes, A. C., Cripps, A., Bouchlaghem, D., & Buswell, R. (2012). Predicted vs. actual energy performance of non-domestic buildings: Using post-occupancy evaluation data to reduce the performance gap. Applied Energy, 97(2), 355–364. https://doi.org/https://doi.org/10.1016/j.apenergy.2011.11.075. Energy Solutions for a Sustainable World -- Proceedings of the Third International Conference on Applied Energy, May 16–18, 2011 -- Perugia, Italy.
- Miller, T. (2014). Modeling techniques in predictive analytics with Python and R: A guide to data science. Pearson Education.
- Mizrahi, M. (2020). Hypothesis testing in scientific practice: An empirical study. International Studies in the Philosophy of Science, 33(1), 1–21. https://doi.org/https://doi.org/10.1080/02698595.2020.1788348
- Moghadam, S. T., Delmastro, C., Corgnati, S. P., & Lombardi, P. (2017). Urban energy planning procedure for sustainable development in the built environment: A review of available spatial approaches. Journal of Cleaner Production, 165(S), 811–827. https://doi.org/https://doi.org/10.1016/j.jclepro.2017.07.142
- Nelder, J. A., & Mead, R. (196501). A simplex method for function minimization. The Computer Journal, 7(4), 308–313. https://doi.org/https://doi.org/10.1093/comjnl/7.4.308
- Park, R. (2019). Practical teaching strategies for hypothesis testing. The American Statistician, 73(3), 282–287. https://doi.org/https://doi.org/10.1080/00031305.2018.1424034
- Raue, A., Kreutz, C., Theis, F. J., & Timmer, J. (2013). Joining forces of Bayesian and frequentist methodology: A study for inference in the presence of non-identifiability. Philosophical Transactions of the Royal Society A: Mathematical, Physical and Engineering Sciences, 371(1984), 20110544. https://doi.org/https://doi.org/10.1098/rsta.2011.0544
- Reinhart, C. F., & Davila, C. C. (2016). Urban building energy modeling – A review of a nascent field. Building and Environment, 97, 196–202. https://doi.org/https://doi.org/10.1016/j.buildenv.2015.12.001
- Rigby, A. S. (1998). Statistical methods in epidemiology: I. Statistical errors in hypothesis testing. Disability and Rehabilitation, 20(4), 121–126. https://doi.org/https://doi.org/10.3109/09638289809166071PMID: 9571378.
- Robert, C., & Casella, G. (2013). Monte Carlo statistical methods. Springer.
- Sandberg, N. H., Sartori, I., Vestrum, M. I., & Brattebø, H. (2016). Explaining the historical energy use in dwelling stocks with a segmented dynamic model: Case study of Norway 1960–2015. Energy and Buildings, 132(6), 141–153. https://doi.org/https://doi.org/10.1016/j.enbuild.2016.05.099
- Sartori, I., Wachenfeldt, B. J., & Hestnes, A. G. (2009). Energy demand in the Norwegian building stock: Scenarios on potential reduction. Energy Policy, 37(5), 1614–1627. https://doi.org/https://doi.org/10.1016/j.enpol.2008.12.031
- Silva, I. R. (2018). On the correspondence between frequentist and Bayesian tests. Communications in Statistics -- Theory and Methods, 47(14), 3477–3487. https://doi.org/https://doi.org/10.1080/03610926.2017.1359296
- Swan, L. G., & Ugursal, V. I. (2009). Modeling of end-use energy consumption in the residential sector: A review of modeling techniques. Renewable and Sustainable Energy Reviews, 13(8), 1819–1835. https://doi.org/https://doi.org/10.1016/j.rser.2008.09.033
- Thomopoulos, N. T. (2017). Statistical distributions. Applications and parameter estimates (1st ed.). Springer International Publishing.
- Tian, W., & Choudhary, R. (2012). A probabilistic energy model for non-domestic building sectors applied to analysis of school buildings in greater London. Energy and Buildings, 54, 1–11. https://doi.org/https://doi.org/10.1016/j.enbuild.2012.06.031
- Tian, W., Heo, Y., [de Wilde], P., Li, Z., Yan, D., Park, C. S., & Augenbroe, G. (2018). A review of uncertainty analysis in building energy assessment. Renewable and Sustainable Energy Reviews, 93, 285–301. https://doi.org/https://doi.org/10.1016/j.rser.2018.05.029
- Tozer, L. (2020). Catalyzing political momentum for the effective implementation of decarbonization for urban buildings. Energy Policy, 136, 111042. https://doi.org/https://doi.org/10.1016/j.enpol.2019.111042
- Zhao, F., Lee, S. H., & Augenbroe, G. (2016). Reconstructing building stock to replicate energy consumption data. Energy and Buildings, 117, 301–312. https://doi.org/https://doi.org/10.1016/j.enbuild.2015.10.001
- Zhuravchak, R., Pedrero, R. A., Nord, N., & Brattebø, H. (2021). Top-down spatially-explicit probabilistic estimation of building energy performance at a scale. Energy and Buildings, 238(17), 110786. https://doi.org/https://doi.org/10.1016/j.enbuild.2021.110786
Appendix. Sample density estimation results
Sample information (Min/Max values and sample size (SS)) per building configuration (construction period (CP), primary envelope material (EM), space heating (SH) solution and ventilation system (VS) type), best-fit distribution with its parameters and the goodness-of-fit metrics (D-statistic, p-value, sum of squared errors (SSE) and ).
Table