
ABSTRACT
Housing retrofits are undertaken to reduce energy use and to improve ‘occupants’ indoor environmental conditions. Despite increased retrofitting of the Italian housing stock, there is a lack of data on their energy use and indoor environmental quality (IEQ). This paper fills this gap by a post-occupancy evaluation (POE) study of seven retrofitted apartments in northern Italy; a non-retrofitted case study was included as a comparison. The study aimed to understand aspects of IEQ and occupant satisfaction after energy-efficiency retrofits. A mixed-method approach encompassed occupant satisfaction surveys, energy bill comparisons, in-situ indoor air temperature, and relative humidity measurements. Results highlighted ‘occupants’ thermal comfort improvement and heating energy consumption reduction after retrofits. Furthermore, reported preferred indoor temperatures w within a broader range than the recommended Italian regulations and CIBSE guide A standard. However, some participants reported unintended consequences, including mould growth and noise from the mechanical ventilation system. This study shows the potential of POE to understand the actual performance of retrofitted residential buildings. However, the difficulties of conducting a POE in retrofitted existing residential buildings show the need of further research on how to effectively conduct POE in retrofitted residential buildings, including improved digital quality monitoring methods.
Introduction
Around 75% of the European Union (EU) buildings are energy inefficient, contributing to significant energy use and carbon emissions (EC, Citation2020). The predominant energy end-use in EU households is space heating and hot water, which account for 78.4% of the total final energy use (Eurostat, Citation2021). The importance of tackling this is highlighted by the EU’s ambition to cut the CO2 emissions levels set in 1990 by 55% by 2030 (DW, Citation2021) with a 32.5% improvement in energy efficiency in end-use sectors directly consumed by the user (EC, Citation2021). Between December 2020 and December 2021, EU energy import prices nearly doubled (eurostat, Citation2022). Furthermore, the Russian-Ukrainian crisis has already led to oil prices reaching their highest level in seven years since 2015 (Jones, Citation2022). A refurbished building stock is considered to play a key role not only in the transition to a carbon-neutral society (Basili et al., Citation2020) but also in reducing natural gas imports for space heating, which is vital for energy security targets set in the EU energy regulations (European Parliament, Citation2018).
In Italy, almost 27.8% of the final energy consumption in 2019 was associated with residential buildings, which increased by 12.2% between 2000 and 2019 (Iorio & Federici, Citation2021). The main energy use in the Italian housing stock is space heating, which accounts for 69% of the total energy used within the residential sector (Odyssee-Mure, Citation2021). Almost three out of four buildings in Italy do not meet the national energy efficiency standard (Eurostat, Citation2020); around 70% of the Italian housing stock was constructed before the first national building energy efficiency regulations in 1976 (Episcope, Citation2014). From then on, the Italian government has promoted building renovation through incentive schemes and funding programmes to upgrade existing buildings to official national standards (Costanzo et al., Citation2018).
A recognized energy efficient standard in Italy is the CasaClima standard, which calculates the energy efficiency of buildings according to the requirements of the European Directives 2010/31/EU and 2012/27/EU (CasaClima, Citationn.d.). According to Italian Law 90/2013, when a building is retrofitted, the average transmission heat transfer coefficient of refurbished elements and the average efficiencies of renovated technical systems must be better than the indicated reference values set by the Italian building regulations (Costanzo et al., Citation2018). CasaClima’s energy classification for space heating energy demand varies from Gold to G, where a Gold classified building is expected to consume ≤10 kWh/m2a, A ≤ 20 kWh/m2a, B ≤ 35 kWh/m2a, C ≤ 50 kWh/m2a, D ≤ 65 kWh/m2a, E ≤ 90 kWh/m2a, F ≤ 120 kWh/m2a and G ≤ 120 kWh/m2a (Casaclima, Citation2022). Unless there are obvious constraints that prevent the building from meeting the requirements of the ‘CasaClima technical directive’, it may still be possible to achieve the CasaClima R certification by enhancing the efficiency of the envelope (Dolzani et al., Citation2021).
Improving the energy performance of dwellings also aims to improve indoor environmental quality (IEQ) (Šujanová et al., Citation2019), which includes four aspects: indoor air quality, and thermal, acoustic and visual comfort (Ribino et al., Citation2021). IEQ can be evaluated via physical measurements, using occupant satisfaction questionnaires or using both methods (Adekunle & Nikolopoulou, Citation2016). A poor IEQ affects health and well-being in a direct way, such as the number of sick days, asthma rates, medication usage rates and the life expectancy of older people (Kimpian, Citation2021). For example, there is a well-established relationship between high temperatures and mortality rates (Vidal et al., Citation2020; Wang et al., Citation2022); this highlights the connection between human health and well-being and the benefits of a building’s retrofit on IEQ (Coggins et al., Citation2022; Šujanová et al., Citation2019). Despite the link between health and well-being and the indoor environment, there is a lack of real-world data related to the impact of building retrofit, creating a challenge for the actual creation of highly efficient and healthy buildings (Jowkar et al., Citation2022).
There is no standard method for defining a satisfactory building based on the IEQ parameters mentioned above (Dawe, Citation2019). In addition, attempts to develop a method to evaluate building occupant’s satisfaction from individual IEQ parameters have yielded different results (Heinzerling et al., Citation2013). Thermal comfort is defined as: ‘the condition of mind that expresses satisfaction with the thermal environment and is assessed by subjective evaluation’ (ASHRAE, Citation2010). It is one of the essential aspects of user satisfaction and energy consumption in buildings (Nicol et al., Citation2012). Thermal comfort preferences vary from person to person (Menezes et al., Citation2012), and an individual’s subjective response to their thermal environment is often investigated by using thermal sensation indexes describing the degree of thermal sensation perception and satisfaction (Schweiker et al., Citation2020).
In Italy, thermal comfort parameters such as air temperature are prescribed by Law when a heating or cooling system is applied (Fabbri & Tronchin, Citation2011). For example, the maximum ambient temperature values during operation of the heating or cooling system measured in the individual heated rooms of each building unit should not exceed 22°C during winter time and not be less than 24°C in summer when occupied (Boriani et al., Citation2020). CIBSE Guide A, which is used to assess the indoor air temperature of individual spaces (e.g. Jones et al., Citation2016; Vidal et al., Citation2020) recommends indoor air temperatures in dwellings of 22–23°C for living rooms, 17–19°C for bedrooms, 26–27°C for bathrooms and 17–19°C for kitchens in winter (CIBSE, Citation2015). In retrofitted buildings, it is crucial to know whether the recommended values mentioned above are achievable and whether they would meet occupants’ satisfaction in reality (Guerra-Santin et al., Citation2016; Vergerio & Becchio, Citation2022). In this regard, post-occupancy evaluation (POE) can evaluate if the certified retrofitted buildings perform as anticipated and meet occupant satisfaction or if corrections and adaptations are required (Cuerda et al., Citation2020).
POE has been defined as ‘the process of evaluating an asset/facility after it has been completed and is in use, to understand its actual performance against that required and to capture lessons learned’ (British Standards Institution (BSI), Citation2015). It includes obtaining feedback about a building’s performance in use, including quantitative and qualitative data collection. Qualitative methods include walkthroughs, user interviews and surveys while quantitative methods include data collection on IEQ, energy and water use (Stevenson, Citation2019). POE studies have been conducted mainly in Spain, Germany, Switzerland, France, Portugal, Sweden and the UK, focusing on schools, office buildings and residential buildings (Li et al., Citation2018; Mustaffa et al., Citation2021). In Italy, there have been several POE studies focusing on new residential buildings located in the Lombardy region, such as Aste et al. (Citation2020), and in the Emilia-Romagna region, such as Mavrigiannaki et al. (Citation2021). Hence this study further contributes to a better understanding of retrofitted residential buildings’ performance in the South Tyrol region in Italy. This research provides a better understanding of actual IEQ, focusing on occupant thermal comfort and heating energy use by presenting the POE results of seven CasaClima-certified retrofitted dwellings and a non-retrofitted dwelling. The paper is structured as follows: Section 2 outlines the research methods used, including the description of the selected case studies and in-situ data collection. Section 3 presents the results and discussion of the monitored cases, followed by the conclusion in Section 4.
Research methods
A mixed-method POE approach was used, encompassing an occupant satisfaction survey, comparison of energy bills pre–post retrofit, and in-situ measurements of indoor air temperatures and relative humidity. Seven case studies were purposively selected based on access to monitor the indoor environment for limited periods of one to two weeks, as conducted in previous research such as Altan et al. (Citation2013), and Sodagar and Starkey (Citation2016). Another criteria was the ability to undertake an occupant survey with residents who had lived there for at least six months post-retrofit; this time frame is recommended when evaluating buildings post-occupancy to avoid assessing the effects of putting the building into commission, but early enough to help identify and fix any issues (ASHRAE, Citation2017). A non-retrofitted case study was included as a comparison. POE practices for retrofitted buildings should occur continuously to determine whether retrofitted buildings perform as expected in different seasons (Altomonte et al., Citation2019). However, our ability to monitor the same cases for a more extended time, including during the summer period, was hindered by limited resources, time and the pandemic situation in Italy. The case studies were not intended to be representative of a larger sample but to enable insights based on their characteristics. No pre-retrofit data were available. The online survey (see Appendix I – online supplemental material) contained open-ended as well as multiple-choice questions addressing the following topics: building information overview (5 questions); thermal comfort winter season (5 questions); thermal comfort summer season (5 questions); perceived indoor air quality, acoustic comfort and indoor natural lighting (5 questions); domestic hot water (2 questions); health and well-being (4 questions); and an open section for general feedback.
The occupant satisfaction survey was translated into Italian and German, checked with native speakers, and piloted with 34 students and other colleagues before the field study. Research ethics was obtained for the study, including data privacy statements and collection of informed consents. The survey was sent to participants by e-mail with an information sheet and informed consent form, explaining the purpose of the survey and monitoring campaign, the amount of time it would take to complete, and their rights as a research participant. Participation in the survey was voluntary and anonymous with no incentives; all eight participants responded to a survey delivered via e-mail and agreed to take part.
Description of case studies
Of eight apartments, seven were retrofitted, and one case study was not retrofitted at the time of monitoring; case studies were pseudonymized from A to H, with apartment H being the non-retrofitted apartment. The retrofitted cases were retrofitted according to CasaClima’s standard ‘the official local authority for building certification in South Tyrol and Italy’ (Europe, Citation2018). The case studies were in the region of South Tyrol, Northern Italy, i.e. in climate zone EFootnote1 (humid subtropical climate (Cfa) according to Koppen’s classification). Cfa climate is characterized by hot and humid summers, and cool to mild winters (Köppen, Citation1980). All the apartments were located in the city of Bolzano in multi-family buildings, except for case C which is in the city of Merano, 34 km from Bolzano – see for three case study pictures that received consent to be published. The monitoring campaign took place from the period of 24th January until 29th March, 2021.
Figure 1. Exterior view of case studies: (a) case C, (b) case F, (c) case H.
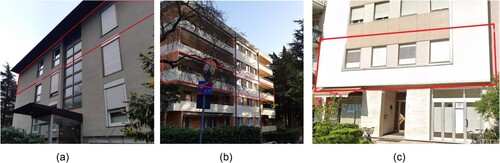
The apartments had a different envelope and window thermal characteristics and different heating systems. However, all had a thermostat for occupant control of indoor temperatures (five of which with a digital display) and all the materials used for the renovation were recognized and certified by CasaClima (CasaClima, Citationn.d.). The average U-values for the building envelope and the estimated heating energy consumption were calculated for each case study using the CasaClima software.Footnote2 summarizes the basic information for each case study, the main thermal characteristics and heating systems used, alongside calculated heating energy demand and the energy class for each case study. Only two cases (E and G) had a mechanical ventilation system (MV); all dwellings had some kind of radiant heating system.
Table 1. Overview of case studies, thermal and physical characteristics (Data obtained from CasaClima certification documents & occupant survey).
Data collection
Air temperature, and relative humidity (RH, %)
Air temperature (°C) and relative humidity (RH) levels were collected during the wintertime of 2021 to evaluate aspects of the IEQ of the retrofitted apartments alongside occupant thermal comfort satisfaction. Due to the limited number of available data loggers, and the time it takes for setting up and collecting them, two types of data loggers were used: Tiny-tag Ultra 2 temperature data loggers (TGU-4500) (Tinytag, Citation2022), and DATAQ temperature loggers (EL-USB-2-LCD) (DATAQ, Citation2021). The time interval for data logging was set to two minutes for the Tiny-tag, due to the memory capacity and one minute for the DATAQ, averaging readings for every two minutes. For analysis, one hour at the beginning and at the end of the monitoring time was removed to ensure that the data were not affected by the placement process. summarizes the specifications of each data logger.
Table 2. Measuring instruments specifications.
Due to availability of data loggers, the cases were monitored consecutively rather than in parallel during the eight-week monitoring campaign. Two data loggers were placed outside if a dwelling faced multiple directions to reduce orientation bias due to differing outdoor climate conditions on different building facades; this was the case for 5 cases (C-E-F-G-H). For analysis, the average of these two outdoor sensors was then used to determine the mean outdoor temperature. summarizes the minimum, maximum and average recorded outdoor temperature for each case. The indoor data loggers, they were installed inside the most used living spaces where access was possible. The data loggers were placed by the researcher in cases A and B, and by CasaClima for cases C to H to an agreed set of standards (e.g. sited away from heat sources and direct sunlight). The apartments did not have the same design, however, data loggers were placed in the living room, kitchen, bathroom and main bedroom within a height of 1.1 m and 1.7 m and 100–500 mm away from the wall in all the apartments to not be affected by the wall surface temperatures, in accordance with ISO Citation7726 (Citation2001), ASHRAE (Citation2017) and others (e.g. Dartevelle et al. (Citation2021) Littlewood and Smallwood (Citation2017), Dartevelle et al. (Citation2021)). The monitored indoor air temperatures can be used to clarify the occupant satisfaction survey and compare to those recommended by the Italian Law (Presidential Decree 74/2013 (Art.3) and CIBSE Guide A).
Table 3. Recorded outdoor air temperatures during the monitoring periods.
Each monitoring campaign is subject to measurement errors, e.g. placement of sensors and the accuracy of the sensors itself (GUM, Citation2008). Placement errors have been controlled for by careful placement of sensors with an agreed protocol. The result of a measurement is complete when accompanied by a statement of the uncertainty of the estimated value of the measurand (Taylor, Citation1997). The instrument errors, expressed with the accuracy of the sensors themselves, are presented with each reading.
Winter thermal comfort, and IEQ satisfaction survey
There are three methods that have been generally used to evaluate thermal comfort with occupants: occupant survey, human subject responses from laboratory experiments and lastly, the predicted mean vote (PMV) method proposed by Fanger (Citation1970), and embedded in many thermal comfort standards such as ISO 7730 (de Dear et al., Citation2020; Fanger, Citation1970; ISO, Citation7726, Citation2001; Zhao et al., Citation2021). The PMV model predicts the thermal sensation as a function of non-environmental factors such as metabolic activity, clothing and environmental parameters such as air temperature, mean radiant temperature, air velocity and relative humidity. The equation predicts the thermal sensation of occupants on the 7-points thermal sensation scale ranging from −3 to +3 (Fabbri, Citation2015; Fanger, Citation1970). However, PMV was designed to predict the mean sensation vote for a group of occupants (without specifying the minimum valid size of the group), meaning that the evaluation method assumes that PMV is equally reliable for individual predictions (as conducted in this study) as it is for groups of occupants (Cheung et al., Citation2019).
The actual mean vote (AMV), on the other hand, indicates the actual thermal sensation reported by occupants on the perception scale (Amasuomo & Amasuomo, Citation2016). The perception scale has 0 as a middle point and people voting from −1 to +1 are generally assumed to be comfortable (Fanger et al., Citation1970). The 7-points satisfaction scale (where 1 is very dissatisfied and 7 is very satisfied) aims to evaluate the satisfaction level of the four main parameters defining IEQ, i.e. thermal comfort, indoor air quality, acoustic and visual comfort, alongside domestic hot water (DHW), and general health and well-being conditions (Lollini et al., Citation2020). Both perception and satisfaction scales are commonly featured in standards such as ASHRAE Standard 55 (ASHRAE, Citation2017), and embedded in previous studies (e.g. Adekunle & Nikolopoulou, Citation2020). Hence, in this study, both perception and satisfaction scales were used along with other multiple-choice questions with diagnostic questions, as well as open answers through an online survey as recommended by ASHRAE (Citation2017) – see online appendix 1.
PMV calculation and sensitivity analysis
In some IEQ studies, the accuracy of PMV Fanger’s model was evaluated by combining survey responses with physical environmental conditions in addition to comparing PMV to AMV (Humphreys et al., Citation2007). Disparities between PMV and AMV in field studies are often attributed to the adaptive opportunities offered to residents (de Dear & Brager, Citation1998). These discrepancies are further compounded by methodological differences (e.g. sampling protocol, sensor accuracy, clothing estimation, metabolic rate estimation, etc.) and individual differences in thermal preferences (Malama & Sharples, Citation1997). In this study, different scenarios were defined to investigate the possibilities for improving the PMV prediction, rather than bridging the gap between AMV and PMV.
This was achieved by comparing the results from the thermal perception and comfort satisfaction questions to the PMV as modelled. The online CBE Thermal Comfort Tool was used for the calculations of the PMV, using available measured data, with assumptions made for the clothing value, metabolic rate and air speed as follows: 1 clo, 1 met, 0.1 m/s, respectively, as recommended by ASHRAE and ISO 7726 as values for a seated person (Ashrae Standard, Citation2017; ISO, Citation7726, Citation2001). In addition, 40 different PMV scenarios were created with different combinations of these theoretical variables (air speed, metabolic rate and clo. levels) to understand the potential PMV uncertainty as reported in previous literature (Dawe, Citation2019; Ricciu et al., Citation2017) (see Appendix II – online supplemental material).
Heating energy consumption
For evaluating the energy performance, the energy calculation sheets for all the retrofitted case studies were obtained from CasaClima. One of the challenges the research faced was to obtain the energy data for all the cases and energy bills were received from only three cases (B, C and E). For these cases, it was also possible to obtain the energy consumption for the year/s before the monitoring time.
Results and discussion
This section presents the results and discussion of the recorded indoor air temperature and relative humidity (% RH), the survey results for the thermal comfort monitoring campaign, IEQ occupant satisfaction of the eight case studies, and the energy consumption reported by participants. Since each case study was a different typology, and the study spanned a different period, the results of each case study were not intended for comparison, but rather for individual analysis and understanding.
Air temperature, and relative humidity (RH, %) results
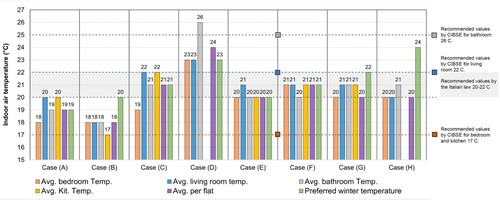
The average recorded air temperature for all bedrooms ranged between 17 ± 0.5°C and 23 ± 0.5°C, bathroom temperature ranged between 19 ± 0.5°C and 26 ± 0.5°C, kitchen spaces ranged between 17 ± 0.5°C and 21 ± 0.5°C, and finally living rooms ranged between 18 ± 0.5°C and 23 ± 0.5°C. Overall, the average air temperatures recorded in the living rooms were the warmest in all the case studies with the exception of case D in which the bathroom space was the warmest space 26 ± 0.5°C, while the living room was 23 ± 0.5°C (). The un-retrofitted apartment H had an average of 20 ± 0.5°C for bedroom 1 and living room, and an average of 21 ± 0.5°C for bedroom 2 and bathroom.
Table 4. Average indoor temperatures, and %RH.
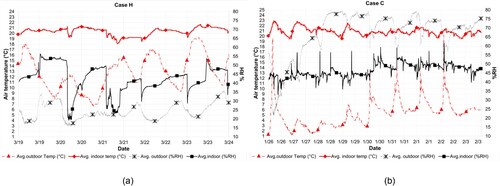
While the indoor temperatures in all the case studies were within a small range of difference, in cases with mechanical ventilation (MV) systems such as cases G and E (), the indoor temperature, and RH were more stable on a daily basis than the other cases such as case H which is not retrofitted, or for example case C that is naturally ventilated (). These findings might support that in winter-time, controlled background ventilation achieved through mechanical means has the potential to balance indoor air temperatures and hence supports good levels of thermal comfort (Belussi et al., Citation2019; Berge & Mathisen, Citation2016). Furthermore, in naturally ventilated cases such as H and C, the outdoor temperature fluctuation rapidly affects the indoor air temperature regardless of the energy class. Winter-time naturally ventilated dwellings may lead to increased heat loss (Gupta & Kapsali, Citation2016). However, seven occupants reported winter-time window opening behaviour, which will have affected indoor temperatures and heat loss. Nevertheless, the effect of this cannot be characterized in this study given that no detailed window opening behaviour was monitored – monitoring this variable (through e.g. window sensors or occupant diaries) has been noted for future research.
Figure 2. Avg. indoor and outdoor temperatures, and (%RH) per apartment. (a) Case G with mechanical background ventilation, (b) case E with mechanical background ventilation. The solid red and black lines are more stable than in naturally ventilated apartments (see ).
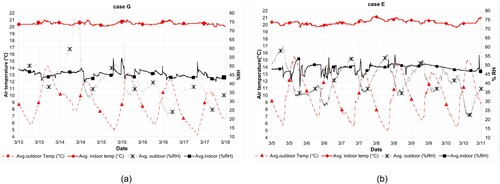
Figure 3. Avg. indoor and outdoor temperature, and (%RH) per apartment. (a) Case H un-retrofitted, (b) case C Naturally ventilated. The solid red and black lines fluctuate more compared to mechanically ventilated apartments (see ).
The recorded indoor air temperatures were compared to values recommended by the national Italian Law (DPR nr. Citation74, Citation2013), the recommended indoor temperatures by CIBSE Guide A, and occupants’ reported preferred temperatures through the survey. From the monitored data, the average indoor air temperature per apartment of five cases (C, E, F, G and H) met the recommended winter temperatures set out in the Italian regulations (i.e. 20–22°C). Two cases (A and B) were below the recommended temperature. Case D was above the recommended value. From the survey, five cases (B, C, E, F and G) reported preferred indoor temperatures which are aligned with the recommended Italian regulations. Cases D and H reported higher preferred temperatures (23–24°C, respectively), whereas case A reported a lower preferred temperature (19°C).
Evaluating the recorded temperatures against CIBSE GUIDE A highlights that the minimum recommended temperature for bedrooms, and kitchens (17°C) were achieved. However, the recommended temperature for the bathroom (26–27°C) was met only for case D (26°C), while for all the other cases, the bathroom temperatures ranged between 18 and 21°C. For the living room spaces, only cases C and D met the minimum recommended CIBSE air temperature (22°C), and the other values range between 18°C in case B and 21°C in cases E, F and G ().
Figure 4. Average recorded indoor air temperature compared to the recommended values by CIBSE guide A and Italian Law.
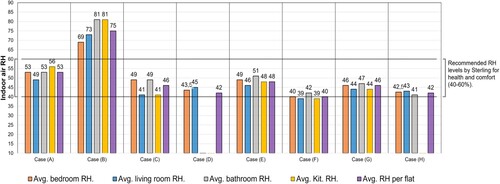
Regarding RH levels, the average RH in both naturally, and mechanically ventilated monitored case study dwellings ranged between 40 and 53% ±3%. The highest average relative humidity level, 75% ±3%, was found in case B with 81% ±3% in kitchen and bathroom. Case B is located on the ground floor, connected directly to the ground, and ground floor insulation was not added during the renovation. Both the kitchen and bathroom in case B were fitted with extract fans. While the extract fan in the bathroom turns on automatically when the light is turned on, the one in the kitchen must be turned on manually. On the other hand, case G was also located on the ground floor with an average indoor relative humidity of 46% ±3%, however, it had an underfloor heating system, and an insulation layer was added during retrofitting; the absence of which might explain the reason for the high RH in case B (Taptiklis et al., Citation2022).
Dwelling RH is also affected by occupant behaviour and moisture-creating activities or window opening behaviour (Berge & Mathisen, Citation2016). In conditions where air temperature is within comfort range, the effect of humidity on thermal sensation is modest (Djamila et al., Citation2015). Too low or too high RH can lead to discomfort; e.g. low RH levels (<15–20%) may cause irritation of the eyes, bacteria and viral infection (Sterling et al., Citation1985). High humidity levels on the other hand may increase the occurrence of allergic rhinitis, and respiratory infections (Berge & Mathisen, Citation2016).
In this study, except for case B, all RH levels () were within the recommended RH levels for health and comfort (40–60%) (Baughman & Arens, Citation1996; Sterling et al., Citation1985). While generally good RH values were met in this study, there was no significant difference between the mechanically and the naturally ventilated units in average RH levels. It is unclear why average RH values were higher in Case B located on the ground floor (75%) with mould being reported on the lower wall surfaces that were connected directly to the ground. Insufficient data were available to understand the exact cause for this; however, this may have been caused by the lack of ground floor insulation after the retrofit, where the ground surface may have become the coldest surface post-retrofit of other elements, potentially leading to surface condensation and mould growth. Another factor, or in combination, might be the user-unfriendliness of the extraction fans where the occupant reported noise issues with the installed extraction fans that need to be manually turned on by the occupant, and may therefore not be used as often; further research is needed. The recorded average RH for case G (46%), located on the ground floor, highlights the potential benefits of preventing high humidity from entering the building through the ground as reported by Leivo and Rantala (Citation2008). It also highlights that energy-efficient retrofits need to be carefully considered to ensure mould growth is prevented and – if it occurs – needs to be rectified. Finally, the un-retrofitted apartment H reported mould growth on the wall behind the radiators in the living room, however, its recorded mean RH values were within the recommended values. Further investigations are needed to understand the cause of this; e.g. whether caused by insulation gaps or workmanship or other reasons.
Figure 5. Average recorded indoor RH aligned with the recommended values by Sterling (40-60% RH).
Winter thermal comfort according to the AMV, PMV
As previously described, occupants were asked to report their perception and satisfaction with the indoor temperature and their preferred indoor temperature. The occupant perception (AMV, −3 to +3 scale) was compared to the PMV results derived from the online CBE Thermal Comfort Tool.Footnote3 The average recorded air temperature and humidity levels were used to obtain the PMV values for each case. summarizes the satisfaction level, temperature description and the preferred indoor air temperature reported by occupants.
Table 5. Occupant satisfaction level, and temperature description on a 7 points scale for the indoor temperature during winter and summertime.
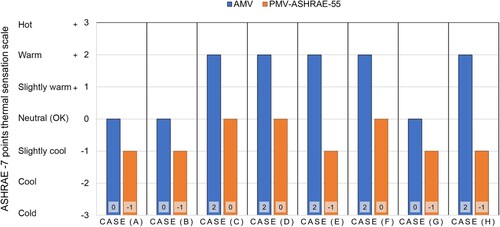
According to the AMV reported by residents, five of the participants reported feeling warm in their houses during wintertime, and three reported feeling neutral. However, the PMV as reported by the online CBE Thermal Comfort Tool suggested that people would feel slightly cool in five cases, and neutral in three cases (). The un-retrofitted apartment H report being somehow satisfied with feeling warm on the AMV scale, however, the PMV suggested that people in case H would feel slightly cool. Similar discrepancies between reported AMV and PMV have been observed in other studies (e.g. Guerra-Santin et al., Citation2016; and Cheung et al., Citation2019). The PMV by Fanger generally assumes people voting from −1 to +1 to be comfortable. If the PMV was used alone, all cases would be considered comfortable. While based on AMV, only three cases would be considered comfortable, however, the majority of average recorded temperatures met the recommended temperature by the Italian Law, and CIBSE. The reported satisfaction level by occupants () showed that the majority of residents were to some extent satisfied. Reported thermal satisfaction and AMV are only achieved by conducting POE, however, the PMV can theoretically be calculated. Since previous studies reported result discrepancies (e.g. Dartevelle et al., Citation2021; Vidal et al., Citation2020), this comparison also emphasizes the need to use more than one evaluation method to evaluate the actual occupants’ sensations and levels of comfort. Based on this study, the PMV results seemed to assume that occupants would be feeling cooler with the monitored conditions, compared to AMV and survey responses. In existing buildings, it can be argued that AMV has more potential to be used than PMV because occupants are able to report their actual thermal sensation.
Figure 6. Comparison between AMV and PMV compared.
Since every single individual person has a different metabolism rate and physiological behaviour, thermal comfort levels are an acceptable approximation (Fabbri & Tronchin, Citation2011). In this regard, a sensitivity analysis with 40 scenarios with different values was modelled (see Appendix II – online supplemental material), to uncover the gap between PMV and AMV. This was achieved by applying the average recorded temperature and relative humidity for each case, and a range of assumed theoretical different values for air speed, metabolic rate and clo. levels in different scenarios. The metabolic rate was set to 1 met in the first 20 scenarios. The air speed was set to 0.2 m/s for another 20 scenarios. Such an approach was also embedded in ISO Citation7726, (Citation2001) for the determination of PMV. As synthesized in (), most modelled scenarios (including the non-retrofitted case H) would be considered comfortable according to the ASHRAE standard by feeling slightly cool, neutral, or slightly warm. Case D has the largest number of theoretical scenarios with a neutral feeling (though 8 scenarios were slightly warm), on the contrary case B, has the least scenarios with a neutral feeling.
Figure 7. PMV modelled sensitivity analysis of different scenarios for each case study.
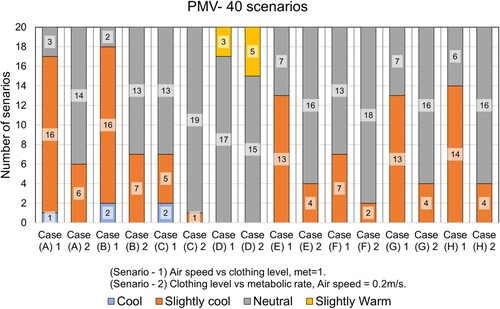
The sensitivity analysis of the PMV proposed 40 different scenarios in which the results assume that people would feel neutral instead of slightly cool by adding more clothes, reducing air flow, or increasing the metabolic rate. As a result, such behaviours are described as adaptive behaviours, in which occupants engage in actions to adjust the surrounding environment to their preferences (Ascione et al., Citation2020). However, people typically might not adjust their clothing when they have other options such as increasing temperature set points indoors (Zhao & Carter, Citation2015). In fact, an occupant’s choice could significantly affect a building’s energy demand and indoor thermal comfort (Hong et al., Citation2017). Of the 40 different scenarios for each case, only cases A, B and G resulted in a similar neutral thermal sensation as that reported by occupants. This highlights the limitations of using PMV to understand an individual’s actual occupant thermal comfort in their home.
Thermal comfort according to recorded and recommended indoor air temperatures
As reported by the survey, five cases (A, B, C, F and G) out of eight had a thermometer and hygrometer that showed temperature and RH on a digital screen; three (A, C and F) reported their preferred indoor air temperature similar to the mean of the monitored temperature. Participants (A, C, D, E and F) who reported preferred temperatures close to, or similar to, the actually measured ones, also reported being thermally satisfied. However, participants in cases B and G, who reported a higher preferred temperature (+2°C than the recorded temperature), reported the lowest satisfaction level for winter thermal satisfaction. This highlights the potential of people feeling comfortable when their preferred indoor temperature is met, which is why the possibility of controlling and reporting the indoor air temperature of living spaces should be considered in all its forms (European Parliament, Citation2018; Partington, Citation2017). In some cases this may lead to lower heating energy use, and in other cases to higher heating energy consumption, if residents have the ability (and can afford) to regulate their indoor temperatures.
Typically, thermal comfort standards and guidelines propose a single static temperature or a small range to meet thermal satisfaction for most people, disregarding the variations in perception and subjective evaluation that drive users’ preferences and needs (Altomonte et al., Citation2020). In this study, the average recorded temperatures varied between 18°C and 24°C, and the reported preferred ones varied between 19°C to 24°C. Moreover, five occupants reported preferred indoor air temperatures >20°C, confirming the findings of Guerra Santin (Citation2013) that occupants tend to prefer higher indoor temperatures which might lead to increased energy consumption and, consequently, cause unintended rebound effects (Attia, Citation2020). The rebound effect is the result of occupants using more energy than predicted to be more thermally satisfied after retrofit (Sorrell & Dimitropoulos, Citation2008). As observed by previous studies, people might seek higher comfort levels if the heating systems are improved due to overall reduced costs (Attia, Citation2020), though it can also be an unintended consequence of the retrofit and system upgrades (Love, Citation2014).
IEQ satisfaction
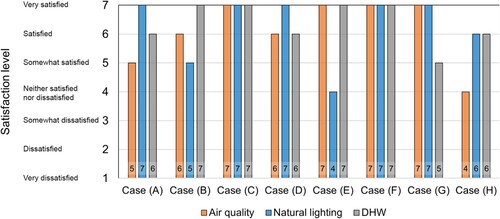
Indoor air quality, natural lighting and DHW conditions were evaluated by a 7-point satisfaction scale. Overall, high satisfaction levels were reported for air quality, natural lighting and DHW (). The un-retrofitted apartment H reported the lowest ranking among all cases (4 out of 7) for air quality satisfaction compared to the retrofitted apartments. On the other hand, case H reported being satisfied with natural lighting and DHW (6 out of 7). Located on the first floor, case E had the lowest ranking for natural lighting (4 out of 7). Cases A, D and H are also located on the first floor, but they are generally very satisfied and satisfied with natural lighting conditions.
Figure 8. Air quality, natural lighting and DHW satisfaction level.
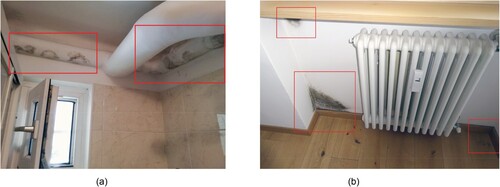
Despite the generally high level of satisfaction with IEQ, there were some reported IEQ issues similar to previous literature (e.g. Harvie-Clark et al., Citation2019). When participants indicated they were unsatisfied with any IEQ parameter, a follow-up question addressed the possible reasons. For example, if dissatisfaction with air quality was reported, reasons such as mould (), bad smell, high level of humidity, draughts, low or high air flow, dry air, or ‘other’ were options. Bad smells were reported in case A, and mould growth in cases B and H.
Figure 9. Some of the mould issues reported in (a) case B included mould on the bathroom ceiling, (b) case H on the wall facing the outside, and behind the radiator.
Noise from the mechanical ventilation system was reported by three occupants in cases B, F and G. Noise from neighbours by two cases (E, H), and noise from outside by case A. However, occupants in case C reported it to be quieter compared to before the retrofit. Case D reported noise from outdoor only when windows were open (Yan et al., Citation2015). The following summarizes the main IEQ issues reported by the eight occupants.
Table 6. Survey IEQ questions feedback.
Indoor environmental conditions and air quality are determined by the performance of the building fabric and building systems as well as the interaction of occupants with them (Gupta & Kapsali, Citation2016). Window opening in particular is seen as of the most occurring adaptive actions occupants make, which has an impact on indoor environmental conditions and consequently, building energy consumption (Jones et al., Citation2015; Stazi et al., Citation2017). Occupants were asked about their habits of opening windows during wintertime; all occupants tended to open the window during the day, including in the apartments with mechanical ventilation systems. Window opening habits were investigated in the survey (see ). The most regularly occurring habit was opening windows after showering, followed by early morning window opening. Case H (un-retrofitted) reported leaving the window tilted most of the time, while case D with a mounted radiant wall heating system reported only rarely opening the window during wintertime. Throughout the cases, only cases B and E reported opening a window while cooking, although such behaviour was reported most frequently in previous studies (e.g. Silva et al., Citation2017).
Figure 10. Window opening habits as reported by occupants.
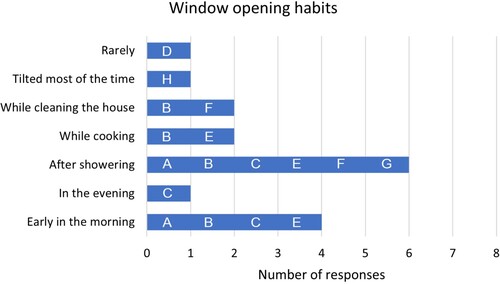
The reported habits of opening the windows, regardless of the ventilation method available, might indicate that people still perceive window opening as one of the most favourable options to obtain fresh air and expel stale air; a pre-retrofit habituation that continues post-retrofit. Moreover, windows may be opened if mechanical systems are too noisy to operate - as discussed further below.
Health and well-being
Regarding health and well-being, with the exception of the non-retrofitted case, all other occupants did not report any medical issues after renovation. The most negative feedback regarding health and well-being questions was reported in the non-retrofitted case H, where the occupant reported experiencing ‘below good’ health and well-being conditions. Reasons for this are unclear, and more investigation is needed, but this might have been caused by the poorly insulated fabric. This in turn may have caused mould growth in places, such as kitchen, bedroom and bathroom (Nilakshini Wimalasena et al., Citation2022), as reported by the case H occupant (see ). The occupant of case B reported similar mould growth issues, but they reported experiencing good health and well-being conditions. However, health risks are associated with specific mould species and several indoor mould species can pose a risk of reactions to allergic individuals who are already hypersensitive to moulds (Mansour et al., Citation2022).
Heating energy consumption results
A building’s energy consumption is influenced by several factors, including energy costs; tracking energy costs could lead to energy conservation (Moeller & Bauer, Citation2022). However, in this study, occupants receive their energy bill after the end of the heating season and hence occupants are not able to track their consumption in a shorter timeframe which may otherwise encourage energy savings. Nevertheless, all participants living in retrofitted apartments reported a reduction in the heating energy pre- and post-retrofit in the survey. The actual energy consumption (kWh) of only two case studies (C and E) was reported, and the third case (B) was in a different unit (uc).
Of these three cases, the highest energy reduction was in case B, where extra external insulation was added in addition to upgrading all the windows to new ones with a higher insulation level. Case B, ‘energy class C’ was naturally ventilated with wall-mounted radiators and was located on the ground floor. The heating energy consumption of case B decreased dramatically after renovation with a reduction of 55% in 2019 and 70% in 2020 compared to 2017. This reduction buffered some of the energy cost increases from 0.18 € in 2017 to 0.61€ per heating energy unit in 2020.
For case C, the actual heating energy consumption in 2019 reported in kWh was lower than the calculated one by 11%. Case C was located on the 3rd floor (top floor), achieved ‘energy class C’; wall-mounted radiators were used pre-retrofit and an electric boiler for DHW. The space heating energy consumption was 8300 kWh in 2015. The renovation took place in 2017 and involved a new boiler connected to the district heating distribution system, new windows, additional thermal insulation and changing the heating system to a radiant ceiling system. The space heating energy consumption from the district heating system in the year 2019 was reduced by 36% compared to the heating energy consumption in 2015.
For case E, the actual heating energy consumption in 2019 reported in kWh was lower than the calculated one by 75%. Case E achieved ‘energy class F’, and had a calculated heating energy consumption of 121 kWh/m2a, an underfloor heating system, and a mechanical ventilation system. The space heating energy consumption in 2017 was 2974 kWh, and in 2019 was 1857 kWh with a reduction factor of 37.6%. These results are summarized in .
Table 7. Reported energy consumption of three cases.
Despite the significant energy savings, the occupant of case B reported not being very satisfied with the indoor environment due to the high level of humidity, mould problems and noise from the new mechanical extract fan. The non-retrofitted case H was also reported to have mould growth, and case A reported to have a bad smell. In cases F and G, mechanical ventilation systems were reported to have caused noise. Noise from mechanical ventilation systems post retrofit was found in previous research (e.g. Berge & Mathisen, Citation2016; Mlecnik, Citation2013). As reported by van Kamp et al. (Citation2011) people sometimes turn off ventilation systems/extraction fans to eliminate noise. As such, it might encourage people to open windows to get fresh air, as seen even in cold countries such as Sweden during wintertime (Nordquist & Fransson, Citation2015). Opening window habits were reported through the survey however, they were not separately monitored or recorded.
Conclusion
Through POE, this paper provides a better understanding of some relevant aspects of the actual performance of energy efficiently retrofitted apartments to the CasaClima standard in South Italy. Results indicated that the satisfaction levels with indoor air quality, natural lighting and DHW were high in all cases. For the thermal comfort, all occupants were to a high extent thermally satisfied. From the monitored temperature data, in five cases, the average indoor air temperature per apartment met the recommended winter temperatures set out in the Italian regulations (i.e. 20–22°C). Two cases were below the recommended temperature, and one case was above the recommended value. When applying CIBSE GUIDE A to evaluate the recorded temperatures, the minimum recommended temperature for bedrooms, and kitchens were achieved. However, the recommended temperature for the bathroom was met only for one case, while for all the other cases, the bathroom temperatures ranged from 18 to 21°C. For the living room spaces, only two cases met the minimum recommended CIBSE air temperature. Occupants tended to prefer higher indoor temperatures (i.e. ideally 20–24°C), except for one case. In this study, all RH levels were within the recommended RH levels for health and comfort (40–60%) except for one case. While generally good RH values were met in this study, there was no significant difference between the mechanically and the naturally ventilated units in average RH levels. However, as explained above, a mechanical ventilation system may have the potential to provide more consistent indoor environment conditions during winter-time. Some residents reported noise issues from the mechanical ventilation system, which can lead to inefficient use of the ventilation system as occupants may open the window instead to avoid noise discomfort.
When comparing AMV and PMV, the majority of occupants reported feeling warm, however, the PMV suggested that the majority of people would feel slightly cool. Even with 40 different predicted scenarios, an ideal match could not be achieved with an exception for three cases (A, B and G), highlighting the importance of more accurately understanding occupants’ thermal satisfaction. Arguably, AMV has more potential to be used in an existing building as occupants can report their actual thermal sensation. Results showed that – based on indoor thermometer and hygrometer readings – there was a high potential for occupants to achieve thermal satisfaction in five cases, either by opening the windows or adapting the mechanical ventilation system. It is worth highlighting that opening the windows was still perceived as a favourable means to obtain fresh air and expel stale air, a habit that continued after retrofitting.
Finally, it was shown that retrofitting existing buildings to energy-efficient standards can result in energy savings and improved occupant satisfaction. However, several IEQ issues were observed in this study, including bad odours, mould growth, noise from the mechanical ventilation system/extract fan, noise from neighbours and noise from outside. The study findings indicate that POE practices are an important and integral part of refurbishment strategies for residential buildings in the future. POE makes it possible to guarantee that the retrofit practice not only aims for energy-efficiency improvements but also meets people’s indoor environmental satisfaction.
As with all research studies, there were some limitations in this study: the limited number of data loggers hindered the monitoring period and the parallel monitoring of all the case studies. Our inability to obtain detailed information about IEQ and energy consumption before the renovation precluded us from understanding the IEQ improvements and prevented us from calculating the financial benefits of the renovation. A lack of face-to-face interviews with occupants, associated with the Covid pandemic, as well as language barriers, limited our understanding of how occupants felt about their homes, and the reported IEQ issues and their solutions. These limitations highlight the difficulties of conducting a POE in retrofitted residential buildings, and the barriers to obtaining pre-retrofit data and access to a larger study sample. However, the online survey used in this study showed that digital data collection methods could be beneficial in gathering data in existing residential buildings and overcoming some barriers such as pandemic lockdowns. This study shows the need for further research on how to effectively retrofit buildings and how to conduct POE in (retrofitted) residential buildings, where small samples and participants potentially require different POE methods than those developed for larger public buildings (e.g. schools, libraries, offices). Nevertheless, even with a limited sample and limited season-specific data, this study highlighted the value of POE to understand the actual performance of retrofitted apartments and occupant satisfaction; the difficulty and limitations in conducting such studies, as well as highlighting the need for better pre–post retrofit quality processes and fixing of issues when they occur.
Supplemental Material
Download PDF (551 KB)Acknowledgements
This research was a part of an internship at CasaClima institution in Bolzano, Italy and the first author would also like to show his gratitude to all people working there, with special thanks to Ulrich Santa, Egon Untertrifaller, Ilaria Maria Brauer, Gebhard Platter and Francesco Nicolosi from Libera Università di Bolzano. I am grateful to the case study occupants, without whom this research would not have been possible. This study was supported by Tampere University and the RESCUE -Real Estate and Sustainable Crisis management in Urban Environments- Academy of Finland funded project (number 339711).
Disclosure statement
No potential conflict of interest was reported by the author(s).
Additional information
Funding
Notes
1 From over 2100 to 3000 Degree days and heating period between 15 October and 15 April.
2 The CasaClima software is a free software developed by CasaClima to calculate the energy efficiency of buildings according to the requirements of the European Directives 2010/31/EU of the Council of 19 May 2010 on the energy performance of buildings and 2012/27/EU of the European Parliament and of the Council of 25 October 2012 on energy efficiency.
References
- Adekunle, T. O., & Nikolopoulou, M. (2016). Thermal comfort, summertime temperatures and overheating in prefabricated timber housing. Building and Environment, 103, 21–35. https://doi.org/10.1016/j.buildenv.2016.04.001
- Adekunle, T. O., & Nikolopoulou, M. (2020). Post-occupancy evaluation on people’s perception of comfort, adaptation and seasonal performance of sustainable housing: A case study of three prefabricated structural timber housing developments. Intelligent Buildings International, 12(2), 71–99. https://doi.org/10.1080/17508975.2018.1493677
- Altan, H., Refaee, M., Han, L., & Noguchi, M. (2013). Measured home environment and energy consumption compared to accepted standards. Open House International, 38(3), 64–72. https://doi.org/10.1108/OHI-03-2013-B0009
- Altomonte, S., Schiavon, S., Kent, M. G., & Brager, G. (2019). Indoor environmental quality and occupant satisfaction in green-certified buildings. Building Research & Information, 47(3), 255–274. https://doi.org/10.1080/09613218.2018.1383715
- Altomonte, S., Allen, J., Bluyssen, P. M., Brager, G., Heschong, L., Loder, A., Schiavon, S., Veitch, J. A., Wang, L., & Wargocki, P. (2020). Ten questions concerning well-being in the built environment. Building and Environment, 180. https://doi.org/10.1016/j.buildenv.2020.106949
- Amasuomo, T. T., & Amasuomo, J. O. (2016). Perceived thermal discomfort and stress behaviours affecting students’ learning in lecture theatres in the humid tropics. Buildings, 6(2), 1–17. https://doi.org/10.3390/buildings6020018
- Ascione, F., Bianco, N., De Masi, R. F., Mastellone, M., Mauro, G. M., & Vanoli, G. P. (2020). The role of the occupant behavior in affecting the feasibility of energy refurbishment of residential buildings: Typical effective retrofits compromised by typical wrong habits. Energy and Buildings, 223(2020), 110217. https://doi.org/10.1016/j.enbuild.2020.110217
- ASHRAE. (2010). ANSI/ASHRAE standard 55-2010: Thermal environmetnal conditions for human occupancy. International Journal of Refrigeration, 40. https://linkinghub.elsevier.com/retrieve/pii/0140700779901142
- ASHRAE. (2017). ANSI/ASHRAE standard 55-2017 : Thermal environmental conditions for human occupancy. ASHRAE Inc., 2017, 66. https://www.techstreet.com/ashrae/standards/ashrae-55-2017?product_id=1994974#jumps
- ASHRAE. (2017). ANSI/ASHRAE Standard 55-2017 : Thermal Environmental Conditions for Human Occupancy. ASHRAE Inc., 2017, 62. https://www.techstreet.com/ashrae/standards/ashrae-55-2017?product_id=1994974#jumps
- Aste, N., Adhikari, R. S., Buzzetti, M., Del Pero, C., Huerto-Cardenas, H. E., Leonforte, F., & Miglioli, A. (2020). nZEB: Bridging the gap between design forecast and actual performance data. Energy and Built Environment, October. https://doi.org/10.1016/j.enbenv.2020.10.001
- Attia, S. (2020). Spatial and behavioral thermal adaptation in net zero energy buildings : An exploratory investigation. Sustainability, September. https://doi.org/10.3390/su12197961
- Basili, R., Colasuonno, L., Hugony, F., Pagliaro, F., Marani, M., Matera, M., Zanghirella, F., Martino, A., Murano, G., Nidasio, R., & Panvini, A. (2020). Rapporto annuale 2020, certificazione energetica degli edifici. https://www.enea.it/it/seguici/events/rapportoape_2020/ENEA-CTI
- Baughman, A. V., & Arens, E. A. (1996). Indoor humidity and human health – Part I: Literature review of health effects of humidity-influenced indoor pollutants. ASHRAE Transactions, 102(1), 193–211.
- Belussi, L., Barozzi, B., Bellazzi, A., Danza, L., Devitofrancesco, A., Fanciulli, C., Ghellere, M., Guazzi, G., Meroni, I., Salamone, F., Scamoni, F., & Scrosati, C. (2019). A review of performance of zero energy buildings and energy efficiency solutions. Journal of Building Engineering, 25(December 2018), 100772. https://doi.org/10.1016/j.jobe.2019.100772
- Berge, M., & Mathisen, H. M. (2016). Perceived and measured indoor climate conditions in high-performance residential buildings. Energy and Buildings, 127, 1057–1073. https://doi.org/10.1016/j.enbuild.2016.06.061
- Boriani, A., Cariani, W., & Romani, R. (2020). Guida pratica alla ristrutturazione e riqualificazione energetica degli edifici per Amministratori di Condominio. https://www.enea.it/it/seguici/pubblicazioni/edizioni-enea/2020/guida-pratica-per-gli-amministratori-di-condominio
- British Standards Institution (BSI). (2015). Briefing for design and construction-Part 1: Code of practice for facilities management (Buildings infrastructure). BSI Standards Publication.
- Casaclima. (2022). Classi CasaClima. https://www.agenziacasaclima.it/it/certificazione-edifici/classi-casaclima-1409.html
- CasaClima. (n.d.). CasaClima. Retrieved December 12, 2021, from https://www.agenziacasaclima.it/en/welcome-1.html
- Cheung, T., Schiavon, S., Parkinson, T., Li, P., & Brager, G. (2019). Analysis of the accuracy on PMV – PPD model using the ASHRAE Global Thermal Comfort Database II. Building and Environment, 153(December 2018), 205–217. https://doi.org/10.1016/j.buildenv.2019.01.055
- CIBSE. (2015). Guide A: Environmental design (CIBSE Guide A: Environmental Design). Chartered Institution of Building Services Engineers. https://www.cibse.org/knowledge/knowledge-items/detail?id=a0q20000008I79JAAS
- Coggins, A. M., Wemken, N., Mishra, A. K., Sharkey, M., Horgan, L., Cowie, H., Bourdin, E., & McIntyre, B. (2022). Indoor air quality, thermal comfort and ventilation in deep energy retrofitted Irish dwellings. Building and Environment, 219(April), 109236. https://doi.org/10.1016/j.buildenv.2022.109236
- Costanzo, E., Martino, A., Varalda, G. M., Antinucci, M., & Federici, A. (2018). EPBD implementation in Italy- Status in December 2016. www.ciriesco.it/it
- Cuerda, E., Guerra-Santin, O., Sendra, J. J., & Neila, F. J. (2020). Understanding the performance gap in energy retrofitting: Measured input data for adjusting building simulation models. Energy and Buildings, 209, 109688. https://doi.org/10.1016/j.enbuild.2019.109688
- Dartevelle, O., van Moeseke, G., Mlecnik, E., & Altomonte, S. (2021). Long-term evaluation of residential summer thermal comfort: Measured vs. perceived thermal conditions in nZEB houses in Wallonia. Building and Environment, 190, 107531. https://doi.org/10.1016/j.buildenv.2020.107531
- DATAQ. (2021). DATAQ. https://www.dataq.com/products/lascar/el-usb/el-usb-2-lcd-data-logger.html
- Dawe, M. (2019). Field evaluation of occupant satisfaction and energy performance in eight LEED-certified buildings using radiant systems. 0–28.
- de Dear, R. J., & Brager, G. S. (1998). Developing an adaptive model of thermal comfort and preference. ASHRAE Transactions, 104(1), 1–18.
- de Dear, R., Xiong, J., Kim, J., & Cao, B. (2020). A review of adaptive thermal comfort research since 1998. Energy and Buildings, 214, 109893. https://doi.org/10.1016/j.enbuild.2020.109893
- Djamila, H., Ming, C. C., & Kumaresan, S. (2015). Investigation on hourly and monthly thermal comfort in the humid tropics of Malaysia. Buildings, 5(3), 1025–1036. https://doi.org/10.3390/buildings5031025
- Dolzani, C., Bancher, M., Brauer, I. M., & Klammsteiner, U. (2021). Casaclima R: A protocol for energy refurbishment supported by verification tools. IOP Conference Series: Earth and Environmental Science, 863(1). https://doi.org/10.1088/1755-1315/863/1/012038
- DPR nr. 74, 16 aprile 2013. (2013). Decreto del presidente della repubblica 16 aprile 2013, n. 62. https://www.cti2000.eu/app/download/8100476785/2013 - D.P.R. 16 aprile 2013, n. 74.zip?t=1476903339
- DW. (2021). EU agrees on tougher climate goals for 2030. https://www.dw.com/en/eu-agrees-on-tougher-climate-goals-for-2030/a-55901612#:~:text=European Commission President Ursula von,emissions by 55%25 by 2030.&text = EU leaders agreed on Friday,to 1990 levels by 2030
- EC. (2020). Energy efficiency in buildings. Energy Efficiency Research, February. https://doi.org/10.1016/b978-0-12-822989-7.00016-0
- EC. (2021). Directive of the European Parliament and of the Council on Energy Efficiency (recast). 0203(July), 1–23. https://eur-lex.europa.eu/legal-content/EN/TXT/PDF/?uri=CELEX:52021PC0558&from=EN
- Episcope. (2014). Inclusion of new buildings in residential building typologies: Steps towards NZEBs exemplified for different European countries (Issue 1). http://episcope.eu/fileadmin/episcope/public/docs/reports/EPISCOPE_SR1_NewBuildingsInTypologies.pdf
- Europe, I. central. (2018). Report on NZEB initiatives from the central Europe region. https://www.interreg-central.eu/Content.Node/DT111.pdf
- European Parliament, C. of the E. U. (2018). Directive (EU) 2018/844 of the European parliament and of the council of 30 May 2018 amending directive 2010/31/EU on the energy performance of buildings and Directive. https://doi.org/10.2016/0381/COD
- Eurostat. (2020). Housing in Europe, Statistics visulasied-2020 edition. In Housing in Europe. https://doi.org/10.2785/713237
- Eurostat. (2021). Energy consumption in households. https://ec.europa.eu/eurostat/statistics-explained/index.php?title = Energy_consumption_in_households
- eurostat. (2022). Energy prices on the rise in the euro area in 2021. https://ec.europa.eu/eurostat/web/products-eurostat-news/-/edn-20220210-2
- Fabbri, K. (2015). Indoor thermal comfort perception. In Indoor thermal comfort perception. Springer International. https://doi.org/10.1007/978-3-319-18651-1
- Fabbri, K., & Tronchin, L. (2011). Thermal comfort and EPB in residential building: A commented case study in Ravenna, Italy. Proceedings of Building Simulation 2011: 12th Conference of International Building Performance Simulation Association, 1154–1160.
- Fanger, P. O. (1970). Thermal comfort. Analysis and applications in environmental engineering. Thermal Comfort. Analysis and Applications in Environmental Engineering, 244. https://www.cabdirect.org/cabdirect/abstract/19501100562
- Fanger, P. O., & Others. (1970). Thermal comfort. Analysis and applications in environmental engineering. Thermal Comfort. Analysis and Applications in Environmental Engineering.
- Guerra Santin, O. (2013). Occupant behaviour in energy efficient dwellings: Evidence of a rebound effect. Journal of Housing and the Built Environment, 28(2), 311–327. https://doi.org/10.1007/s10901-012-9297-2
- Guerra-Santin, O., Romero Herrera, N., Cuerda, E., & Keyson, D. (2016). Mixed methods approach to determine occupants’ behaviour – analysis of two case studies. Energy and Buildings, 130, 546–566. https://doi.org/10.1016/j.enbuild.2016.08.084
- GUM. (2008). Evaluation of measurement data – guide to the expression of uncertainty in measurement. International Organization for Standardization Geneva ISBN, 50(September), 134. http://www.bipm.org/en/publications/guides/gum.html
- Gupta, R., & Kapsali, M. (2016). Empirical assessment of indoor air quality and overheating in low-carbon social housing dwellings in England, UK. Advances in Building Energy Research, 10(1), 46–68. https://doi.org/10.1080/17512549.2015.1014843
- Harvie-Clark, J., Conlan, N., Wei, W., & Siddall, M. (2019). How loud is too loud? noise from domestic mechanical ventilation systems. International Journal of Ventilation, 18(4), 303–312. https://doi.org/10.1080/14733315.2019.1615217
- Heinzerling, D., Schiavon, S., Webster, T., & Arens, E. (2013). Indoor environmental quality assessment models: A literature review and a proposed weighting and classification scheme. Building and Environment, 70, 210–222. https://doi.org/10.1016/j.buildenv.2013.08.027
- Hong, T., Yan, D., D’Oca, S., & Chen, C. f. (2017). Ten questions concerning occupant behavior in buildings: The big picture. Building and Environment, 114, 518–530. https://doi.org/10.1016/j.buildenv.2016.12.006
- Humphreys, M. A., Fergus Nicol, J., & Raja, I. A. (2007). Field studies of indoor thermal comfort and the progress of the adaptive approach. Advances in Building Energy Research, 1(1), 55–88. https://doi.org/10.1080/17512549.2007.9687269
- Iorio, G., & Federici, A. (2021). Energy efficiency trends and policies in Italy. November 2012, 1–37. https://www.odyssee-mure.eu/publications/national-reports/energy-efficiency-italy.pdf
- ISO 7726. (2001). Ergonomics of the thermal environment – instruments for measuring physical quantities. In Bs En Iso 7726:2001 (Issue 1).
- Jones, L. (2022). Five ways the Ukraine war could push up prices. BBC. https://www.bbc.com/news/business-60509453
- Jones, R. V., Fuertes, A., & Lomas, K. J. (2015). The socio-economic, dwelling and appliance related factors affecting electricity consumption in domestic buildings. Renewable and Sustainable Energy Reviews, 43, 901–917. https://doi.org/10.1016/j.rser.2014.11.084
- Jones, R. V., Goodhew, S., & De Wilde, P. (2016). Measured indoor temperatures, thermal comfort and overheating risk: Post-occupancy evaluation of low energy houses in the UK. Energy Procedia, 88, 714–720. https://doi.org/10.1016/j.egypro.2016.06.049
- Jowkar, M., Temeljotov-Salaj, A., Lindkvist, C. M., & Støre-Valen, M. (2022). Sustainable building renovation in residential buildings: Barriers and potential motivations in Norwegian culture. Construction Management and Economics, 40(3), 161–172. https://doi.org/10.1080/01446193.2022.2027485
- Kimpian, J. (2021). Energy, people, buildings : Making sustainasble architecture work (H. Hartman & S. Pelsmakers (eds.)) [Book]. Riba.
- Köppen. (1980). Köppen climate classification. Wikipedia. https://en.wikipedia.org/wiki/Köppen_climate_classification#Cfa:_Humid_subtropical_climates
- Leivo, V., & Rantala, J. (2008). Moisture behaviour of slab-on-ground structures in operating conditions: Steady-state analysis. Construction and Building Materials, 22(4), 526–531. https://doi.org/10.1016/j.conbuildmat.2006.11.008
- Li, P., Froese, T. M., & Brager, G. (2018). Post-occupancy evaluation: State-of-the-art analysis and state-of-the-practice review. Building and Environment, 133(December 2017), 187–202. https://doi.org/10.1016/j.buildenv.2018.02.024
- Littlewood, J. R., & Smallwood, I. (2017). One year temperature and heat pump performance for a Micro-Community of low Carbon Dwellings, in Wales, UK. Energy Procedia, 111, 387–396. https://doi.org/10.1016/j.egypro.2017.03.200
- Lollini, R., Pasut, W., & Pistore, L. (2020). Regenerative technologies for the indoor environment. Inspirational guidelines for practitioners (Issue May). www.cost.eu/COST_Actions/ca/CA16114
- Love, J. A. (2014). Understanding the interactions between occupants, heating systems and building fabric in the context of energy efficient building fabric retrofit in social housing. [UCL (University College London)]. In Doctoral thesis (Issue June). https://discovery.ucl.ac.uk/id/eprint/1433401/
- Malama, A., & Sharples, S. (1997). Thermal performance of traditional and contemporary housing in the cool season of Zambia. Building and Environment, 32(1), 69–78. https://doi.org/10.1016/S0360-1323(96)00036-4
- Mansour, A., Bentley, R., Baker, E., Li, A., Martino, E., Clair, A., Daniel, L., Mishra, S. R., Howard, N. J., Phibbs, P., Jacobs, D. E., Beer, A., Blakely, T., & Howden-Chapman, P. (2022). Housing and health: An updated glossary. Journal of Epidemiology and Community Health, 76(9), 833–838. https://doi.org/10.1136/jech-2022-219085
- Mavrigiannaki, A., Gobakis, K., Kolokotsa, D., Kalaitzakis, K., Pisello, A. L., Piselli, C., Laskari, M., Saliari, M., Assimakopoulos, M.-N., Pignatta, G., Synnefa, A., & Santamouris, M. (2021). Zero energy concept at neighborhood level: A case study analysis. Solar Energy Advances, 1, 100002. https://doi.org/10.1016/j.seja.2021.100002
- Menezes, A. C., Cripps, A., Bouchlaghem, D., & Buswell, R. (2012). Predicted vs. Actual energy performance of non-domestic buildings: Using post-occupancy evaluation data to reduce the performance gap. Applied Energy, 97, 355–364. https://doi.org/10.1016/j.apenergy.2011.11.075
- Mlecnik, E. (2013). Improving passive house certification: Recommendations based on end-user experiences. Architectural Engineering and Design Management, 9(4), 250–264. https://doi.org/10.1080/17452007.2012.738044
- Moeller, S., & Bauer, A. (2022). Energy (in) efficient comfort practices : How building retrofits influence energy behaviours in multi-apartment buildings. Energy Policy, 168(July), 113123. https://doi.org/10.1016/j.enpol.2022.113123
- Mustaffa, W. N. F. W., Ani, A. I. C., Mustafa, N. K. F., Hakim, A., & Nordin, N. (2021). The 100 top cited studies Post Occupancy Evaluation (POE): Trend setting analysis using bibliometic citation approach. Turkish Journal of Physiotherapy and Rehabilitation, 32(3), 4757–4769.
- Nicol, F., Humphreys, M., & Roaf, S. (2012). Adaptive thermal comfort: Principles and practice. Routledge. https://doi.org/10.4324/9780203123010
- Nilakshini Wimalasena, N., Chang-Richards, A., I-Kai Wang, K., & Natasha Dirks, K. (2022). What makes a healthy home? A study in Auckland, New Zealand. https://doi.org/10.1080/09613218.2022.2043138
- Nordquist, B., & Fransson, V. (2015). Insufficient air supply rates in new build apartments with energy efficient ventilation : Including aspects of human perception and behaviour. Healthy Buildings Europe Conference. https://lup.lub.lu.se/search/publication/ec4d3375-2263-490b-b319-8abea1a20fd0
- Odyssee-Mure. (2021). Italy | Energy profile, March2021, Energy efficiency trends and policies (Issue March). https://www.odyssee-mure.eu/publications/efficiency-trends-policies-profiles/italy.html
- Partington, R. (2017). Better buildings : Learning from buildings in use.
- Ribino, P., Bonomolo, M., Lodato, C., & Vitale, G. (2021). A humanoid social robot based approach for indoor environment quality monitoring and well-being improvement. International Journal of Social Robotics, 13(2), 277–296. https://doi.org/10.1007/s12369-020-00638-9
- Ricciu, R., Galatioto, A., Besalduch, L. A., & Desogus, G. (2017). Uncertainty in the evaluation of the pmv index. The 12th Conference on Sustainable Development of Energy, Water and Environment Systems – SDEWES2017, 1–17. https://www.researchgate.net/publication/320452142_UNCERTAINTY_IN_THE_EVALUATION_OF_THE_PMV_INDEX/stats
- Schweiker, M., André, M., Al-Atrash, F., Al-Khatri, H., Alprianti, R. R., Alsaad, H., Amin, R., Ampatzi, E., Arsano, A. Y., Azar, E., Bannazadeh, B., Batagarawa, A., Becker, S., Buonocore, C., Cao, B., Choi, J. H., Chun, C., Daanen, H., Damiati, S. A., … Zomorodian, Z. S. (2020). Evaluating assumptions of scales for subjective assessment of thermal environments – Do laypersons perceive them the way, we researchers believe? Energy and Buildings, 211. https://doi.org/10.1016/j.enbuild.2020.109761
- Silva, M. F., Maas, S., de Souza, H. A., & Gomes, A. P. (2017). Post-occupancy evaluation of residential buildings in Luxembourg with centralized and decentralized ventilation systems, focusing on indoor air quality (IAQ). Assessment by questionnaires and physical measurements. Energy and Buildings, 148, 119–127. https://doi.org/10.1016/j.enbuild.2017.04.049
- Sodagar, B., & Starkey, D. (2016). The monitored performance of four social houses certified to the Code for Sustainable Homes Level 5. Energy and Buildings, 110, 245–256. https://doi.org/10.1016/j.enbuild.2015.11.016
- Sorrell, S., & Dimitropoulos, J. (2008). The rebound effect: Microeconomic definitions, limitations and extensions. Ecological Economics, 65(3), 636–649. https://doi.org/10.1016/j.ecolecon.2007.08.013
- Stazi, F., Naspi, F., & D’Orazio, M. (2017). A literature review on driving factors and contextual events influencing occupants’ behaviours in buildings. Building and Environment, 118, 40–66. https://doi.org/10.1016/j.buildenv.2017.03.021
- Sterling, E. M., Arundel, A., & Sterling, T. D. (1985). Criteria or human exposure to humidity in occupied buildings. ASHRAE Transactions, 91, 611–622.
- Stevenson, F. (2019). Housing fit for purpose : Performance, feedback and learning. RIBA Publishing.
- Šujanová, P., Rychtáriková, M., Mayor, T. S., & Hyder, A. (2019). A healthy, energy-efficient and comfortable indoor environment, a review. Energies, 12(8), 1–37. https://doi.org/10.3390/en12081414
- Taptiklis, P., Phipps, R., Jones, M., & Douwes, J. (2022). Associations of house characteristics with indoor dampness and measured moisture: Results from three New Zealand House Condition Surveys in 2005, 2010 and 2015. Building and Environment, 208(July 2021), 108508. https://doi.org/10.1016/j.buildenv.2021.108508
- Taylor, J. (1997). An introduction to error analysis: The study of uncertainties in physical measurements. Measurement Science and Technology. https://doi.org/10.1088/0957-0233/9/6/022
- Tinytag. (2022). Tinytag. https://www.geminidataloggers.com/data-loggers/tinytag-ultra-2/tgu-4500#:~:text=The TGU-4500 monitors temperatures,protection such a Stevenson Screen
- van Kamp, I., Bogers, R., & Jongeneel, R. (2011). Noise in relation to climate change; A first orientation. 40th International Congress and Exposition on Noise Control Engineering 2011, INTER-NOISE 2011, 4, 3751–3758.
- Vergerio, G., & Becchio, C. (2022). Pursuing occupants’ health and well-being in building management : Definition of new metrics based on indoor air parameters. Building and Environment, 223(July), 109447. https://doi.org/10.1016/j.buildenv.2022.109447
- Vidal, I. R., Otaegi, J., & Oregi, X. (2020). Thermal comfort in nzeb collective housing in Northern Spain. Sustainability (Switzerland), 12(22), 1–30. https://doi.org/10.3390/su12229630
- Wang, C., Wang, J., & Norbäck, D. (2022). A systematic review of associations between energy use, fuel poverty, energy efficiency improvements and health. International Journal of Environmental Research and Public Health, 19(12), 7393. https://doi.org/10.3390/ijerph19127393
- Yan, D., O’Brien, W., Hong, T., Feng, X., Burak Gunay, H., Tahmasebi, F., & Mahdavi, A. (2015). Occupant behavior modeling for building performance simulation: Current state and future challenges. Energy and Buildings, 107, 264–278. https://doi.org/10.1016/j.enbuild.2015.08.032
- Zhao, J., & Carter, K. (2015). Perceived comfort and adaptive process of passivhaus ‘Participants’. Energy Procedia, 83, 121–129. https://doi.org/10.1016/j.egypro.2015.12.202
- Zhao, Q., Lian, Z., & Lai, D. (2021). Thermal comfort models and their developments: A review. Energy and Built Environment, 2(1), 21–33. https://doi.org/10.1016/j.enbenv.2020.05.007