
 ?Mathematical formulae have been encoded as MathML and are displayed in this HTML version using MathJax in order to improve their display. Uncheck the box to turn MathJax off. This feature requires Javascript. Click on a formula to zoom.
ABSTRACT
Smart office concepts are gaining increasing attention in the built environment domain, as they promise efficient and effective workplaces that cater to user needs. While previous researchers have primarily focused on Internet of Things (IoT) technologies in the office environment and their impacts on office users, few studies have addressed the users’ preferences of smart office concepts. This study aims to fill this gap by investigating users’ preferences for four smart features: smart parking, smart workspace booking, smart temperature control and smart lighting, and exploring how different attributes of these smart features influence users’ preferences. The study conducted a stated choice experiment with 137 valid respondents and analysed the data using both Multinomial Logit (MNL) models and Latent Class (LC) models. The MNL model results indicate that users have varying preferences for different smart features and that there are significant interactive impacts between attribute levels and age, gender, working hours per week and attitudes towards technologies, highlighting the heterogeneity in users’ preferences. The LC model revealed two distinct user classes for each smart feature, which have significantly improved the overall model performance. This study guides the design and implementation of smart office concepts that cater to users’ needs and preferences.
Introduction
The physical work environment is an essential resource that has a significant impact on employee satisfaction, comfort, health and productivity (Clements-Croome, Citation2006; Hills & Levy, Citation2014; Rioux, Citation2017). Numerous studies have been conducted to explore the relationship between the physical work environment and office workers (Appel-Meulenbroek et al., Citation2019; Veitch et al., Citation2007). For example, to qualify these impacts, the Leesman Index (Citation2018) defines relevant characteristics of physical workspace features based on responses of 401,362 office users. Besides, several researchers have grouped the physical office environment characteristics according to their investigations (Appel-Meulenbroek et al., Citation2018; Appel-Meulenbroek et al., Citation2021; Mcvicar et al., Citation2013; Vischer, Citation2007). Various workspace design characteristics such as workspace types (Danielsson & Bodin, Citation2008), amount of workspace (Frontczak et al., Citation2011; Nag, Citation2019), dividers (De Been & Beijer, Citation2014; Goins et al., Citation2010; Nag, Citation2019), windows and views (Aries et al., Citation2010; Clements-Croome, Citation2006; Galasiu & Veitch, Citation2006; Giddings et al., Citation2013; Loftness et al., Citation2009; Smith & M, Citation2011; Veitch et al., Citation2005), ambient conditions (Clements-Croome, Citation2015), plants and greenery (Al Horr et al., Citation2016; De Been et al., Citation2016; Giddings et al., Citation2013) and personal control (Bluyssen et al., Citation2011; Candido et al., Citation2016; De Been et al., Citation2016; Frontczak & Wargocki, Citation2011; Giddings et al., Citation2013; Nag, Citation2019; Rioux, Citation2017) could impact on office users’ levels of satisfaction, comfort and productivity.
With improvements in physical design and Information and Communication Technology (ICT), office buildings have become more intelligent, responding to users’ ever-changing needs throughout their life cycle (Lin et al., Citation2022). Smart offices aim to improve employees’ experience, well-being and productivity by providing better work conditions through sensing, computation, communication and actuation capabilities (Barisic et al., Citation2020; Bati et al., Citation2017; Cicirelli et al., Citation2017). Studies have shown that a better match between working conditions and user preferences and expectations can positively affect user satisfaction and productivity (Kim et al., Citation2019; Oswald et al., Citation2015; Vischer, Citation2007). From the perspective of environmental psychology, studies have found that office users are less productive when their workplace does not fulfil their physiological and psychological needs (Guo et al., Citation2019; Oseland, Citation2009; Soriano et al., Citation2020). For instance, Oseland (Citation2009) discovered that buildings must account for basic individual and organizational needs to be effective. Meanwhile, studies from an ambient conditions perspective show that user perferences are vital for effective task performance such as thermal comfort (Čulić et al., Citation2021), visual comfort (Salamone et al., Citation2021) and acoustics quality (Salamone et al., Citation2021). Preferences and expectations vary among users, influenced by socio-demographic variables (De Been & Beijer, Citation2014) and work-related characteristics such as task types (Rothe et al., Citation2011), job positions (Brill & Weidemann, Citation2001), working hours per week (Frontczak & Wargocki, Citation2011).
However, research on user preferences and expectations in smart office environments remains limited, with most studies focusing on non-smart offices (Rothe et al., Citation2011, Citation2012) or other smart environments, such as smart homes (Jeong et al., Citation2010), smart hospitals (Moro Visconti & Morea, Citation2020) and small schools (Abdelnour-Nocera et al., Citation2015). Although sensor technologies have been used to predict user preferences (Alberdi et al., Citation2018 Frontczak & Wargocki, Citation2011), such data collection methods are insufficient in covering perspectives such as data sharing preferences, communication interface preferences and willingness to use technologies. While Tuzcuoğlu et al. (Citation2022) collected user data in a smart office building in the Netherlands and identified two main themes of user preferences, such studies remain few.
To bridge the research gap in the field, the paper delineates a research study aimed at investigating the smart features that align with the preference of office users in smart office environments. It aims to examine the influence of personal, socio-demographic, work-related, attitude-related and experience-related characteristics on user preferences for specific smart features using a stated choice experiment. The empirical case study was conducted in the Netherlands and the collected data were analysed using Multinomial Logit (MNL) models and Latent Class (LC) models to identify preferences for various attributes of smart features. In The findings of this study will provide insights into design an optimal smart office environment that caters to the needs and expectations of its users.
Methodology
Stated choice experiment design
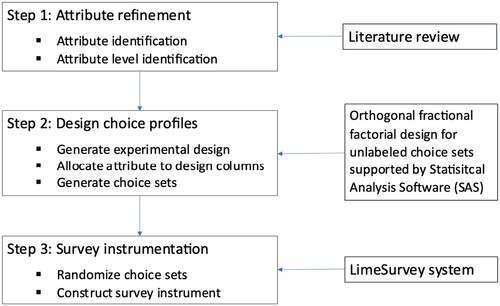
To assess the office users’ preferences for smart building features, this study employed a stated choice experiment (SCE) to explore the influence of different attributes on users’ preferences for smart feature alternatives. The SCE is a commonly used method to capture the participants’ preferences and trade-offs between various attributes, with previous research demonstrating its ability to predict and explain future market behaviour when respondents face new choices or hypothetical alternatives (Gu et al., Citation2019; Liu et al., Citation2021; Yang et al., Citation2021). Given that the smart office concept is a relatively new phenomenon and that different offices may implement varying smart technologies, the use of SCE is one of the most relevant approaches to quantify office users’ smart feature preferences. The SCE design consists of three main stages: selecting relevant attributes and definitions of levels, designing choice profiles, and constructing randomized choice sets into a survey as shown in .
Figure 1. Stated choice experiment design workflow.
Attributes and levels design
To design the stated choice experiment, five attributes are selected based on a literature review, which are control (Kwon et al., Citation2019; Schleich et al., Citation2017), information sharing (Tuzcuoğlu et al., Citation2022), communication (D’oca et al., Citation2018), knowledge acquisition and personal information sharing for resource efficiency ().
Table 1. Selected variables and levels for all smart features.
In a smart office, it is crucial for users to have control over the environment. Smart features can provide control in various ways, as demonstrated in previous studies (Cook et al., Citation2009; Reijula et al., Citation2011; Weijs-Perrée et al., Citation2019). To capture users’ preferences, two attribute levels related to control have been formulated in this study: basic decision support and automated decision support. The first level presents the user with an overview of the options, while the second level chooses the best alternative automatically for the user.
The second attribute is information sharing, which can enable smart features to better support users by knowing their preferences, calendar and work activities. The more information users share, the more targeted the smart feature can help and serve these users (Tuzcuoğlu et al., Citation2023). Therefore, three levels of information sharing have been designed, ranging from not sharing any information, sharing basic information, such as calendar or type of work activity, to sharing basic information plus personal preferences. It is assumed that the more information users share, the more targeted and effective the smart feature can be in helping and serving them.
The third attribute is communication, which is also essential for office users (D’oca et al., Citation2018). Three levels of communication have been provided, with the first level being no dashboard communication, the second level providing a dashboard showing the current state of smart features and the third level being the most advanced form of communication, providing tips and alerts from the system.
The fourth attribute is knowledge acquisition, which can help to better understand smart office usage patterns. To effectively control smart features, data from office users can be analysed. However, it is also important to consider how users feel about their data being analysed in smart office environments. Therefore, three levels of knowledge acquisition have been created. The first level involves no knowledge acquisition, where systems will not generate usage patterns. The second level generates aggregated usage patterns of the entire office environment. The third and most advanced level aims to find usage patterns of individual users.
The final attribute is personal information sharing, which can significantly improve the performance of office workers (Kim & Chung, Citation2019; Tuzcuoğlu et al., Citation2021; Tuzcuoğlu et al., Citation2022) but is also related to privacy concerns (Kokolakis, Citation2017; Williams et al., Citation2019). Three levels of willingness to share personal information have been designed. The first level involves not sharing any personal information, resulting in no additional efficiency gains. At the second level, users share some personal information, which leads to 15% increase in efficiency. The system utilizes the shared personal information to better meet the users’ needs. In the third level, users share sensitive information, which leads to a 35% increase in efficiency. The system uses the sensitive data to further enhance the user experience. It is assumed that the more personal sensitive information a user shares with the system, the greater the efficiency gains that the user will experience in the work environment with the support of smart features.
After designing the general attributes and levels, these attribute levels were tailored to four commonly discussed smart office features: smart parking, smart workspace booking, smart indoor temperature control and smart lighting control. To ensure that respondents could easily comprehend the attributes and levels of these smart features, the levels and detailed description of each level regarding the smart features were rephrased, as shown in the Appendix.
Creating choice sets
To create a full design that combines all five attributes and their respective levels, there would be 162 (2*34) potential combinations, which is too large for conducting a data collection. To reduce the number of choice profiles, an orthogonal fractional factorial design was applied with Statistical Analysis Software (SAS). This reduced the number of choice profiles to 18, while still ensuring that all levels of each attribute are included. Each choice set consisted of two randomly selected choice profiles out of the 18 profiles and the ‘none of these' option, which could be selected if the alternatives are equally appealing or irrelevant to the respondent. An example of a choice set is shown in .
Table 2. An example of the choice sets for smart workspace booking.
Survey design
The survey begins with a welcome message that introduces the subject of the survey, its objective and its structure. An introduction to smart office technologies follows, which presents some general information about smart features in smart offices. The survey was implemented online using the LimeSurvey system (LimeSurvey, Citationn.d.).
Prior to the Stated Choice Experiment, personal characteristics were collected. Previous studies have shown that age (Rothe et al., Citation2012), gender (Danielsson et al., Citation2015), education level (De Been & Beijer, Citation2014), working hours per week (De Been et al. (Citation2016)) and types of working activities (Budie et al., Citation2019) can influence the preferences of knowledge workers in office environments. Moreover, previous researchers have found that office user experience may impact on their preference and expectations (Tuzcuoğlu et al., Citation2021). Therefore, respondents were asked to provide information on these characteristics as well as their experience and familiarity with the four different smart office features.
Previous researchers have showed that one's attitude towards technology may influence their preferences for smart building technologies (Singh et al., Citation2018). To measure respondents’ attitude, three questions were used based on the Technology Readiness Segmentation (Parasuraman & Colby, Citation2015), which were rated on a 5-point Likert scale, ranging from ‘Strongly Disagree’ to ‘Strongly Agree’.
To ensure that respondents were well-informed, a short introduction video was included to explain the stated choice experiment. Additionally, the researchers provided an explanation for each choice profile to clarify the meaning of each attribute and to help respondents make informed decisions. To avoid respondent fatigue and ensure accurate response, two settings were applied in LimeSurvey. First, we ensured that each respondent was presented with a maximum of two smart features, which prevented respondents from having to fill out choice sets for all smart features. Furthermore, we limited the number of choice sets per respondent to 18 to reduce fatigue (Cherchi & Hensher, Citation2015). Second, we randomly presented the choice sets per smart feature to each respondent to avoid any bias in the choice order. The LimeSurvey system ensures that each choice profile was presented to respondents almost equally.
Before activating the survey online, it was tested with 10 office workers who were randomly selected in three rounds. Their feedbacks were used to eliminate any ambiguities and to shorten the survey. The survey has also been reviewed and approved by the Ethical Review Board of the university to ensure that it did not violate any privacy rights.
Multinominal logit model and latent class model
Discrete choice modelling is a widely recognized and frequently used method to understand preference for activities, services and products. It has been widely used in various research fields including marketing, energy, transportation and social sciences (Liu et al., Citation2020, Citation2021; Yang et al., Citation2021). It is based on utility theory and aims to comprehend the fundamental factors that drive an individual’s decision-making process. For a Multinominal Logit model, the utility equation can be defined as Equation (1). Where is the overall utility of alternative i for respondent q,
is the structural utility of alternative i for respondent q,
is the random utility component,
is the utility weight of attribute n and
is the score of alternative i on attribute n for respondent q.
(1)
(1) To estimate the impacts of socio-demographic variables
and attitude variables
on the utility for unlabelled choice experiments, in this study, we included their covariates as interaction terms with the attributes in the utility function. Thus, the utility function is expressed as Equation (2). The variables considered in this study are gender, work hours, age and attitudes towards technology. These variables were chosen based on previous research which has shown that they influence individual’s preference for smart office features.
(2)
(2)
The Latent Class model (LCM) is a statistical method that aims to identify unobserved subgroups within a population that share similar characteristics. It is commonly used to reveal different preference structures among individuals and identify heterogeneity in their preferences. The LCM assumes each class has a unique set of preferences that may vary in terms of the importance of different attributes or the direction and magnitude of the effects of those attributes on choice. To estimate the parameters, the LCM analyses individual response patterns on explicit indicators and assigns each individual to a class based on their probability of belong to that class. The model is estimated by maximizing the likelihood of the observed data given the underlying latent structure, and each class has a different vector of parameters (Heckman & Singer, Citation1984; Greene & Hensher, Citation2003). The probability of an individual choosing alternative j from a choice set J, conditional on belonging to class s, is expressed as Equation (3).
To investigate office workers’ preferences for smart office attributes and analyse the extent to which preferences differ for different latent classes, we assume that their preferences depend on the observed attribute levels and the latent heterogeneity which varies with variables such as work hours, personality, gender, age and experience with the four smart features.
(3)
(3) where
is the utility of alternative
for individual
in a choice set
given class
.
Further, statistical tests can be performed to identify the differences between various socio-demographic groups and work-related characteristics. Those characteristics with nominal/ordinal variables will be tested with a Chi-square test, and internal/ratio characteristics will be tested by an independent sample t-test. The results of these tests show whether there is a significant difference between these latent groups in certain perspectives.
Data collection and descriptive results
Between January and March 2022, the data collection was conducted in the Netherlands, with knowledge workers from three different types of organizations recruited via social media channels. These organizations included a municipality, a consulting company and university office workers. Prior to participating, respondents were informed about the data privacy issue and data processing in accordance with GDPR regulations. Their data was collected solely for the purpose of this study and would be removed afterwards. Out of 245 survey respondents, 76 unfinished surveys, 20 surveys completed within 5 min and 1 with straight-line answers were removed, leaving. 137 valid survey responses for analysis. The socio-demographic variables, work-, attitude- and experience-related variables which have been collected in the survey is presented in .
Table 3. Variables collected in the survey.
To assess the representativeness of our sample, we compared the socio-demographic variable and work-related variable distribution of our survey sample with the data from Statistics Netherlands data (CBSFootnote1), as shown in . While the gender distribution in our sample is similar to the national distribution, we observed some differences in age, education and work hours per week. The age group 25–34 is over-represented in our sample, while the age groups 15–24 and 55+ are under-represented. In terms of education, respondents with an academic education (54.1%) are overrepresented in our survey compared to the average Dutch office worker (32.2%), whereas those with vocational education or lower (9.5%) are underrepresented compared to the average Dutch office worker (36.3%). Additionally, we found that our sample over-represents full-time workers.
Table 4. Comparison of sample data with Statistics Netherlands data.
To gain insights into the working activities of office workers, we analysed how office workers allocate their working hours across individual concentrated work, formal communication work, informal communication work and other activities. The results show that 45% of working hours are spent on concentrated individual work (such as writing and reading), followed by formal communication – 31% (e.g. collaboration, scheduled appointments) and informal communication (14%).
We investigated office workers’ experience and attitude towards smart features. The majority of respondents reported heard of, but never used these features (around 52–56%), except for smart temperature control, which has been used by 36% of respondents. Smart parking was new to most participants, as only 15% of the participants used it before.
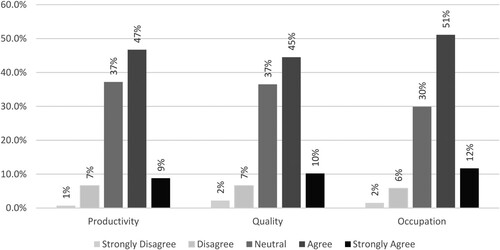
The attitude towards the smart features was also investigated through three statements that were found to be reliable with a Cronbach's Alpha (α) test (0.83) (Tavakol and Dennick, Citation2011). The results showed that the majority of respondents agreed that these smart features would contribute to their productivity (56%), improve the quality of their work (55%) and make them more efficient in their work (63%), as shown in . An Exploratory Factor Analysis (EFA) was conducted to merge these three attitude variables into one meaningful factor, and the results identified one factor that explained 92% of the variances. The loading factors for productivity, working quality, and efficiency in their work are 0.808, 0.816 and 0.778, respectively.
Figure 2. Distribution of attributes towards technology.
Results
Multinomial logit model (MNL) results
The study utilized a MNL model to estimate user preference for smart features. Effect coding was applied for categorical variables. Age categories were merged into <35, 35–55 and >55, and working hours per week were merged into full-time (35+ hours per week) and part-time (<35 h per week). The overall performance is estimated by McFadden’s adjusted Rho-squared which showed a lower than acceptable value (<0.2) due to preference heterogeneity, as shown in . Nonetheless, significant parameters were found to indicate respondents’ preferences. The results indicate that respondents prefer receiving suggestions rather than having the smart tool automatically book a workplace or adjust the temperature. They are willing to share information for smart parking and workplace booking, but not for temperature control. Results indicate that communication is important for smart workplace booking, while for temperature control, respondents prefer a dashboard with indoor temperature or an interactive dashboard with temperature and suggestions. Respondents do not prefer pattern analysis for parking data but prefer a certain level of pattern analysis for the other smart features. Respondents are willing to share basic personal data to gain 15% efficiency in workplace booking but not for other smart features.
Table 5. Results of MNL model.
For interaction variables, the MNL model reveals significant distinct interactive impacts for each smart feature, involving attribute levels and factors such as age, gender, work hours per week and attitude towards technology. For smart parking, full-time workers prefer to share their information to increase parking efficiency, while those with a positive attitude towards technology prefer to increase efficiency by sharing personal information. For smart workplace booking, gender and full time working have significant impacts. Males prefer not to share their working agenda or preference, while full-time workers prefer an automated booking system. Preferences for smart temperature control are affected by work hours per week, attitude towards technology and age. Full-time workers prefer not to share any information with smart temperature systems, while those with a positive attitude towards technology prefer to share information to increase resource efficiency. The 35–55 age group prefers a dashboard that communicates information about the system, while younger workers are less willing to share personal information. For smart lighting systems, male workers prefer to share work activity information but do not want it analysed. Full-time workers do not prefer a communication dashboard, but those with a positive attitude towards technology prefer a dashboard with lighting parameters. The 35–55 age group prefers suggestions and a dashboard for communication.
Latent class (LC) model results
The LC model results are presented in with all four models having good overall performance (McFadden’s adjusted Rho squared scores are between 0.24 and 0.27). For smart parking and smart workplace booking, two distinctive classes were identified. We named the two groups as the ‘Adapters', with a positive constant value, and the ‘Rejecters', with a negative constant value. Most respondents fall into the Adapter group for both features. For smart temperature and smart lighting, both groups have positive constant values, with one group having a higher constant value than the other. These two groups are classified as the ‘Confident Adapters' and the ‘Reluctant Adapters'. It is worth mentioning that only significant parameters are discussed in this section.
Table 6. Results of LC model.
For smart parking, the Adapter group prefers to share basic information with the system and is willing to share personal information if it improves parking efficiency. They also want a dashboard to view parking availability information. The Rejecter group is more willing to use the smart feature if it does not require personal data trading for resource efficiency.
For smart workspace booking, the Adapter group prefers a workspace decision support tool and is willing to share personal information if it increases 15% of the efficiency of finding a suitable workspace. They want a communication dashboard and willing to have their data used to understand individual usage patterns. The rejector class might be more willing to use the systems if these systems function as a decision support tool.
For smart temperature, The Confident Adapter class prefers not to share any personal information to increase thermal comfort but wants their data to be used to analyse personal temperature preferences. The Reluctant Adapters are more likely to use the systems if it provides suggestions to adjust the temperature and comes with a dashboard. They also prefer to share some basic work activity information.
For smart lighting, the Reluctant Adaptors might be convinced to use these systems if it comes with a dashboard that communicates the state of these systems. If the system does not increase the efficiency of the lighting, they are unwilling to participate.
Chi-square tests and independent t-tests were carried out to investigate whether there is any correlation between class distribution and socio-demographic, work-, experience-, and attitude-related variables. Nevertheless, the results indicated that there were no significant associations between these variables and the class distribution. It indicates that these variables do not play a significant role in determining whether respondents belong to one class or another.
Discussion and conclusion
The smart office concept is gaining attention; however, limited research has been conducted to understand the preferences of office workers in such environments. This study focused on types of control, willingness to share information, communication dashboard settings and information analysis to increase the quantitative understanding of how different factors may influence office users’ preferences.
The MNL results suggest that office workers have distinct preferences for different smart features, which is not a surprising given that each smart feature caters to specific needs or daily activities (Tuzcuoğlu et al., Citation2021). As a result, each smart feature should be examined individually. In general, office workers prefer receiving suggestions over automated control. Their willingness to share information varies depending on the type of smart features. While the privacy paradox has been previously explored, and revealed that if the benefits outweigh the risk, individuals are willing to ‘give up' their privacy (Kokolakis, Citation2017; Williams et al., Citation2019), it has not been examined in the context of the smart office concept. This study found that for smart parking or workplace booking, office workers are willing to share personal data if it results in increase efficiency. This can be explained as it directly benefits them with their daily activities or tasks (Kokolakis, Citation2017; Tuzcuoğlu et al., Citation2021). However, for smart lighting and temperature systems, they do not prefer to share any personal data.
Regarding communication, the study results align with previous research that indicates a preference for interactive dashboards to enable communication with smart features, particularly for smart temperature control (Liu et al., Citation2021). These findings are consistent with the observation that individual thermal control systems in modern office buildings are underutilized due to a variety of issues, as noted in prior research (Karjalainen & Koistinen, Citation2007). Our study highlights the need for a more effective user interface/dashboard to facilitate communication between office occupants and smart features, especially for temperature control. These findings suggest that enhancing the communication interface can help promote the adoption and effective use of smart features in office environments. Additionally, our results are consistent with previous research that suggests users prefer their data to be analysed by the system to gain knowledge of their usage patterns, except for smart parking, which is consistent with the findings of Mohandes et al. (Citation2018). The interactive impacts between attribute levels, socio-demographic variables and attitudes towards technologies identified in this study highlight the importance of considering the diverse needs and preferences of office users in the design and implementation of smart features. These findings contribute to the growing body of literature on user preferences and expectations for smart technologies in the workplace and have practical implications for building managers and designers. Considering limited significant parameters were identified for attributes and levels, we suspect high heterogeneity exists in their preference. Therefore, a latent class model was performed to investigate the heterogeneity of attributes and levels. The results have proved that separating respondents into two groups significantly improved the model performance.
The results of LC model indicate that office workers have different preferences for the four smart features studies. Specifically, for smart parking and workplace booking, there are two distinct preference groups – Adopters and Rejectors, with adopters more willing to share information and have advanced communication interfaces. On the other hand, for smart lighting and temperature systems, there are Confident Adopters and Reluctant Adopters, with the latter having stronger preferences. The results highlight the importance of designing smart features based on users’ preference, which contribute to their daily activities and needs.
Overall, the results provide valuable insights into the preferences of office workers regarding four smart features in the workplace. It sheds light on the heterogeneity of preferences and highlights the need for smart feature designs that are tailored to user’s needs. The results offer practical guidance for designers and policy makers to improve the adaptation and use of smart feature in workplace.. However, there are some limitations that need to be mentioned and require further research. Firstly, the survey was conducted primarily in knowledge-based organizations with highly educated, young full-time adults, which may have influenced the results. Therefore, generalization of the findings to the average Dutch office worker must be done with caution. Secondly, Chi-square tests and independent-sample t-tests were conducted to explore the relationship between preferences and socio-demographic variables, attitudes and experience-related characteristics. Unfortunately, no significant result has been found due to the small sample size. As such, future studies with a larger sample size are needed. Overall, future research should aim to address these issues to provide a more comprehensive understanding of office worker’s preference for smart features in the workplaces.
Disclosure statement
No potential conflict of interest was reported by the author(s).
Notes
References
- Abdelnour-Nocera, J., Oussena, S., & Burns, C. (2015). Human work interaction design of the Smart University. In J. Abdelnour Nocera, B. Barricelli, A. Lopes, P. Campos, & T. Clemmensen (Eds.), Human work interaction design. Work analysis and interaction design methods for pervasive and smart workplaces. HWID 2015 IFIP Advances in Information and Communication Technology (p. 468). Springer. https://doi.org/10.1007/978-3-319-27048-7
- Al Horr, Y., Arif, M., Kaushik, A., Mazroei, A., Katafygiotou, M., & Elsarrag, E. (2016). Occupant productivity and office indoor environment quality: A review of the literature. Building and Environment, 105(15), 369–389. https://doi.org/10.1016/j.buildenv.2016.06.001
- Alberdi, A., Weakley, A., Schmitter-Edgecombe, M., Cook, D. J., Aztiria, A., Basarab, A., & Barrenechea, M. (2018). Smart home-based prediction of multidomain symptoms related to Alzheimer's disease. IEEE Journal of Biomedical and Health Informatics, 22(6), 1720–1731. https://doi.org/10.1109/JBHI.2018.2798062
- Appel-Meulenbroek, R., Clippard, M., & Pfnür, A. (2018). The effectiveness of physical office environments for employee outcomes: An interdisciplinary perspective of research efforts. Journal of Corporate Real Estate, 20(1), 56–80. https://doi.org/10.1108/JCRE-04-2017-0012
- Appel-Meulenbroek, R., Le Blanc, P., & de Kort, Y. (2019). Person–environment fit: Optimizing the physical work environment. Organizational Behaviour and the Physical Environment, 251–267. Routledge Taylor & Francis Group. https://doi.org/10.4324/9781315167237-14
- Appel-Meulenbroek, R., Weijs-Perrée, M., Orel, M., Gauger, F., & Pfnür, A. (2021). User preferences for coworking spaces; a comparison between The Netherlands, Germany and the Czech Republic. Review of Managerial Science, 15(7), 2025–2048. https://doi.org/10.1007/s11846-020-00414-z
- Aries, M. B. C., Veitch, J. A., & Newsham, G. R. (2010). Windows, view, and office characteristics predict physical and psychological discomfort. Journal of Environmental Psychology, 30(4), 533–541. https://doi.org/10.1016/j.jenvp.2009.12.004
- Barišić, A., Amaral, V., & Challenger, M. (2020). Enhancing Occupants Comfort and Well-being through a Smart Office setup. In 43rd International Convention on Information, Communication and Electronic Technology (MIPRO), Opatija, Croatia (pp. 1825–1830).
- Bati, A. C., Coşkun, E., Gözüaçık, Ö., İlhan, G., Şahin, F. A., Uncuoğlu, U., Güngen, M. A., & Telli, A. (2017). Iot based smart office application for advanced indoor working environment and energy efficiency. In 2017 25th Signal Processing and Communications Applications Conference (SIU), Antalya, Turkey (pp. 1–4) IEEE. https://doi.org/10.1109/SIU.2017.7960664
- Bluyssen, P. M., Aries, M., & van Dommelen, P. (2011). Comfort of workers in office buildings: The European HOPE project. Building and Environment, 46(1), 280–288. https://doi.org/10.1016/j.buildenv.2010.07.024
- Brill, M., & Weidemann, S. (2001). Disproving widespread myths about workplace design. Kimball International.
- Budie, B., Appel-Meulenbroek, R., Kemperman, A., & Weijs-Perree, M. (2019). Employee satisfaction with the physical work environment: The importance of a need based approach. International Journal of Strategic Property Management, 23(1), 36–49. https://doi.org/10.3846/ijspm.2019.6372
- Candido, C., Candido, C., Zhang, J., Kim, J., de Dear, R., Thomas, L., Strapasson, P., & Joko, C. (2016). Impact of workspace layout on occupant satisfaction, perceived health and productivity. 9th Windsor Conference: Making comfort relevant, Windsor Great Park, UK.
- Cherchi, E., & Hensher, D. A. (2015). Workshop synthesis: Stated preference surveys and experimental design, an audit of the journey so far and future research perspectives. Transportation Research Procedia, 11, 154–164. https://doi.org/10.1016/j.trpro.2015.12.013
- Cicirelli, F., Fortino, G., Guerrieri, A., Spezzano, G., & Vinci, A. (2017). Metamodeling of smart environments: From design to implementation. Advanced Engineering Informatics, 33, 274–284. https://doi.org/10.1016/j.aei.2016.11.005
- Clements-Croome, D. (2006). Creating the productive workplace (2nd ed.). Oxford: Taylor and Francis.
- Clements-Croome, D. (2015). Creative and productive workplaces: A review. Intelligent Buildings International, 7(4), 164–183. https://doi.org/10.1080/17508975.2015.1019698
- Cook, D. J., Augusto, J. C., & Jakkula, V. R. (2009). Ambient intelligence: Technologies, applications, and opportunities. Pervasive and Mobile Computing, 5(4), 277–298. https://doi.org/10.1016/j.pmcj.2009.04.001
- Čulić, A., Šolić, P., Perković, T., & Čongradac, V. (2021). Smart monitoring technologies for personal thermal comfort: A review. Journal of Cleaner Production, 312, 127685. https://doi.org/10.1016/j.jclepro.2021.127685
- Danielsson, C. B., Bodin, L., Wulff, C., & Theorell, T. (2015). The relation between office type and workplace conflict: A gender and noise perspective. Journal of Environmental Psychology, 42, 161–171. https://doi.org/10.1016/j.jenvp.2015.04.004
- Danielsson, C. B. & Bodin, L. (2008). Office type in relation to health, well-being, and job satisfaction among employees. Environment and Behavior, 40(5), 636–668. https://doi.org/10.1177/0013916507307459
- De Been, I., & Beijer, M. (2014). The influence of office type on satisfaction and perceived productivity support. Journal of Facilities Management, 12(2), 6571. https://doi.org/10.1108/JFM-02-2013-0011
- De Been, I., Van Der Voordt, T., & Haynes, B. (2016). Productivity. In P.A. Jensen & T. van der Voordt (Eds.), Facilities management and corporate real estate management as value drivers (pp. 19). Routledge. https://doi.org/10.4324/9781315695150.
- D’oca, S., Ferrer, C., Pernetti, R., Gralka, A., & Sebastian, R. (2018). Technical, financial, and social barriers and challenges in deep building renovation: Integration of lessons learned from the H2020 cluster projects. Buildings, 8(12), 174. https://doi.org/10.3390/buildings8120174
- Frontczak, M. J., Schiavon, S., Goins, J., Arens, E., Zhang, H., & Wargocki, P. (2011). Quantitative relationships between occupant satisfaction and aspects of indoor environmental quality and building design. Indoor Air, 22(2), 119–131. https://doi.org/10.1111/j.1600-0668.2011.00745.x
- Frontczak, M., & Wargocki, P. (2011). Literature survey on how different factors influence human comfort in indoor environments. Building and Environment, 46(4), 922–937. https://doi.org/10.1016/j.buildenv.2010.10.021
- Galasiu, A. D., & Veitch, J. A. (2006). Occupant preferences and satisfaction with the luminous environment and control systems in daylit offices: A literature review. Energy and Buildings, 38(7), 728–742. https://doi.org/10.1016/j.enbuild.2006.03.001
- Giddings, B., Thomas, J., & Little, L. (2013). Evaluation of the workplace environment in the UK, and the impact on users’ levels of stimulation. Indoor and Built Environment, 22(6), 965–976. https://doi.org/10.1177/1420326X13476078
- Goins, J., Jellema, J., & Zhang, H. (2010). Architectural enclosure's effect on office worker performance: A comparison of the physical and symbolic attributes of workspace dividers. Building and Environment, 45(4), 944–948. https://doi.org/10.1016/j.buildenv.2009.09.015
- Greene, W. H., & Hensher, D. A. (2003). A latent class model for discrete choice analysis: contrasts with mixed logit. Transportation Research Part B: Methodological, 37(8), 681–698.
- Gu, G., Yang, D., Feng, T., & Timmermans, H. (2019). Influence of the adoption of new mobility tools on investments in home renewable energy equipment: Results of a stated choice experiment. Sustainable Cities and Society, 50, 101641. https://doi.org/10.1016/j.scs.2019.101641
- Guo, J., Weng, D., Zhang, Z., Jiang, H., Liu, Y., Wang, Y., & Duh, H. B. L. (2019). Mixed reality office system based on Maslow’s hierarchy of needs: Towards the long-term immersion in virtual environments. In 2019 IEEE International Symposium on Mixed and Augmented Reality (ISMAR) (pp. 224–235). IEEE.
- Heckman, J. J., & Singer, B. (1984). Econometric duration analysis. Journal of Econometrics, 24(1), 63–132.
- Hills, R., & Levy, D. (2014). Workspace design and fit-out: What knowledge workers value. Property Management, 32(5), 2326. https://doi.org/10.1108/PM-02-2014-0011
- Leesman. (2018). The Leesman index. www.leesmanindex.com/measure-employee-experience/
- Jeong, K., Salvendy, G., & Proctor, R. W. (2010). Smart home design and operation preferences of Americans and Koreans. Ergonomics, 53(5), 636–660. https://doi.org/10.1080/00140130903581623
- Karjalainen, S., & Koistinen, O. (2007). User problems with individual temperature control in offices. Building and Environment, 42(8), 2880–2887. https://doi.org/10.1016/j.buildenv.2006.10.031
- Kim, A. A., Wang, S., & Mccunn, L. J. (2019). Building value proposition for interactive lighting systems in the workplace: Combining energy and occupant perspectives. Journal of Building Engineering, 24, 100752. https://doi.org/10.1016/j.jobe.2019.100752
- Kim, J., & Chung, K. (2019). Prediction model of user physical activity using data characteristics-based long short-term memory recurrent neural networks. KSII Transactions on Internet and Information Systems, 13(4), 2060–2077. http://doi.org/10.3837/tiis.2019.04.018
- Kokolakis, S. (2017). Privacy attitudes and privacy behaviour: A review of current research on the privacy paradox phenomenon. Computers & Security, 64, 22–134. https://doi.org/10.1016/j.cose.2015.07.002
- Kwon, M., Remøy, H., & Van Den Dobbelsteen, A. (2019). User-focused office renovation: A review into user satisfaction and the potential for improvement. Property Management, 37(4), 470–489. https://doi.org/10.1108/PM-04-2018-0026
- Limesurvey: Project Team/Carstem Schmitz. (n.d.). LimeSurvey: An Open-Source Survey Tool. LimeSurvey Project, Hamburg, Germany. http://www.limesurvey.org
- Lin, S., Zhang, H., Li, J., Ye, C., & Hsieh, J. (2022). Evaluating smart office buildings from a sustainability perspective: A model of hybrid multi-attribute decision-making. Technology in Society, 68, 101824. https://doi.org/10.1016/j.techsoc.2021.101824
- Liu, X., Lee, S., Bilionis, I., Karava, P., Joe, J., & Sadeghi, S.A. (2021a). A user-interactive system for smart thermal environment control in office buildings. Applied Energy, 298, 117005. https://doi.org/10.1016/j.apenergy.2021.117005
- Liu, Y., Yang, D., Timmermans, H.J.P., & Vries, B. (2020). Analysis of the impact of street-scale built environment design near metro stations on pedestrian and cyclist road segment choice: A stated choice experiment. Journal of Transport Geography, 82, 102570. https://doi.org/10.1016/j.jtrangeo.2019.102570
- Loftness, V., Aziz, A., Choi, J., Kampschroer, K., Powell, K., Atkinson, M., & Heerwagen, J. (2009). The value of post-occupancy evaluation for building occupants and facility managers. Intelligent Buildings International, 1(4), 249–268. https://doi.org/10.3763/inbi.2009.SI04
- Mcvicar, A., Munn Giddings, C., & Seebohm, P. (2013). Workplace stress interventions using participatory action research designs. International Journal of Workplace Health Management, 6(1), 18–37. https://doi.org/10.1108/17538351311312303
- Mohandes, M., Deriche, M., Abuelma'atti, M.T. & Tasadduq, N. (2019). Preference-based smart parking system in a university campus. IET Intell. Transp. Syst., 13, 417–423. https://doi.org/10.1049/iet-its.2018.5207
- Moro Visconti, R., & Morea, D. (2020). Healthcare digitalization and pay-for-performance incentives in smart hospital project financing. International Journal of Environmental Research and Public Health, 17(7), 2318. https://doi.org/10.3390/ijerph17072318
- Nag, P. K. (2019). Spatial and behavioural attributes in office design. In Office buildings. Design science and innovation (pp. 29–49). Springer. https://doi.org/10.1007/978-981-13-2577-9_2
- Oseland, N. (2009). The impact of psychological needs on office design. Journal of Corporate Real Estate, 11(4), 3845. https://doi.org/10.1108/14630010911006738
- Oswald, A. J., Proto, E., & Sgroi, D. (2015). Happiness and productivity. Journal of Labor Economics, 33(4), 789–822. https://doi.org/10.1086/681096
- Parasuraman, A., & Colby, C. L. (2015). An updated and streamlined technology readiness index: TRI 2.0. Journal of Service Research, 18(1), 59–74. https://doi.org/10.1177/1094670514539730
- Reijula, J., Gröhn, M., Müller, K., & Reijula, K. (2011). Human well-being and flowing work in an intelligent work environment. Intelligent Buildings International, 3(4), 223–237. https://doi.org/10.1080/17508975.2011.608837
- Rioux, L. (2017). Comfort at work: An indicator of quality of life at work In G. Fleury–Bahi, E. Pol, & O. Navarro (Eds.), Handbook of environmental psychology and quality of life research (pp. 401–419). Springer. https://doi.org/10.1007/978-3-319-31416-7_22
- Rothe, P., Lindholm, A., Hyvönen, A., & Nenonen, S. (2011). User preferences of office occupiers: Investigating the differences. Journal of Corporate Real Estate, 13(2), 81–97. https://doi.org/10.1108/14630011111136803
- Rothe, P., Lindholm, A., Hyvönen, A., & Nenonen, S. (2012). Work environment preferences–does age make a difference? Facilities, 30(1/2), 78–95. https://doi.org/10.1108/02632771211194284
- Salamone, F., Belussi, L., Danza, L., & Meroni, I. (2021). A survey-based approach used to analyse the indoor satisfaction and productivity level of user in smart working during lock-down due to the COVID-19 pandemic. Journal of Physics.: Conference. Series, 2042(1), 012139. https://doi.org/10.1088/1742-6596/2042/1/012139
- Schleich, B., Anwer, N., Mathieu, L., & Wartzack, S. (2017). Shaping the digital twin for design and production engineering. CIRP Annals, 66(1), 141–144. https://doi.org/10.1016/j.cirp.2017.04.040
- Singh, D., Psychoula, I., Kropf, J., Hanke, S., & Holzinger, A. (2018). Users’ perceptions and attitudes towards smart home technologies. In M. Mokhtari, B. Abdulrazak, & H. Aloulou, (Eds.), Smart Homes and Health Telematics, Designing a Better Future: Urban Assisted Living. ICOST 2018. Lecture Notes in Computer Science (Vol. 10898). Springer. https://doi.org/10.1007/978-3-319-94523-1_18
- Smith, A., & M, P. I. T. T. (2011). Sustainable workplaces and building user comfort and satisfaction. Journal of Corporate Real Estate, 13(3), 144–156. https://doi.org/10.1108/14630011111170436
- Soriano, A., W. Kozusznik, M., Peiró, J. M., & Mateo, C. (2020). The role of employees’ work patterns and office type fit (and misfit) in the relationships between employee well-being and performance. Environment and Behavior, 52(2), 111–138. https://doi.org/10.1177/0013916518794260
- Tavakol M., & Dennick R. (2011). Making sense of cronbach's alpha. International Journal of Medical Education, 27(2), 53–55.
- Tuzcuoğlu, D., Yang, D., de Vries, B., Sungur, A., & Appel-Meulenbroek, R. (2021). The phases of user experience during relocation to a smart office building: A qualitative case study. Journal of Environmental Psychology, 74, 101578. https://doi.org/10.1016/j.jenvp.2021.101578
- Tuzcuoğlu, D., de Vries, B., Yang, D., & Sungur, A. (2023). What is a smart office environment? An exploratory study from a user perspective. Journal of Corporate Real Estate, 25(2), 118–138. https://doi.org/10.1108/JCRE-12-2021-0041
- Veitch, J. A., Geerts, J., Charles, K.E., & Newsham, G.R. (2005). Satisfaction with lighting in open-plan offices: COPE field findings. In Proceedings of Lux Europa, 10th European Lighting Conference, Berlin, Germany (pp. 414–417).
- Veitch, J. A., Charles, K.E., Farley, K.M.J., & Newsham, G.R. (2007). A model of satisfaction with open-plan office conditions: COPE field findings. Journal of Environmental Psychology, 27(3), 177–189. https://doi.org/10.1016/j.jenvp.2007.04.002
- Vischer, J. C. (2007). The effects of the physical environment on job performance: Towards a theoretical model of workspace stress. Stress and Health: Journal of the International Society for the Investigation of Stress, 23(3), 175–184. https://doi.org/10.1002/smi.1134
- Weijs-Perrée, M., van de Koevering, J., Appel-Meulenbroek, R., & Arentze, T. (2019). Analysing user preferences for co-working space characteristics. Building Research & Information, 47(5), 534–548. https://doi.org/10.1080/09613218.2018.1463750
- Williams, M., Nurse, J. R., & Creese, S. (2019). Smartwatch games: Encouraging privacy-protective behaviour in a longitudinal study. Computers in Human Behavior, 99, 38–54. https://doi.org/10.1016/j.chb.2019.04.026
- Yang, D., De Vries, B., & Van Der Schaft, L. (2021). The construction workers’ preference and acceptance of innovations in data provision: A stated choice experiment study in The Netherlands. Journal of Building Engineering, 35, 101970. https://doi.org/10.1016/j.jobe.2020.101970
Appendix
Table A1. Rephrased levels for four smart office features.