
 ?Mathematical formulae have been encoded as MathML and are displayed in this HTML version using MathJax in order to improve their display. Uncheck the box to turn MathJax off. This feature requires Javascript. Click on a formula to zoom.
ABSTRACT
Reaching sustainability targets requires a holistic understanding of the different dimensions of residential building stock development. This paper aims to provide a solid and transparent approach for modelling residential building stock development with a focus on the long-term need for repairs and renovations. The modelling approach is based on Dynamic Material Flow Analysis (MFA) and the model is constructed using comprehensive Finnish statistics. Still, it is widely applicable to different geographical locations and modifiable for various purposes. The main contributions to the previous literature are the incorporation of empirical building mortality analysis and rehabilitation degree model in the MFA modelling framework. The model is demonstrated by modelling the development of Finnish residential building stock from 2020 to 2050. The annual average need for renovation from 2020 to 2050 is 4.1 million residential square metres (1.8% percent of the entire housing stock), equalling to annual investments of some 7.8 billion euros. However, the results revealed notable geographical differences between municipality categories. The results also suggest that the proportion of renovations in the total construction market is increasing while the volume of new housing construction is decreasing. The modelled results are in line with the Finnish Long-Term Renovation Strategy 2020–2050.
Introduction
Buildings account for 40% of energy consumption in the European Union (EPBD, Citation2010). To address the climate concerns, the EU first set goals to reduce greenhouse gas emissions by 80% from 1990 levels by 2050 (European Commission, Citation2012), but these goals were later amended to aim to complete carbon neutrality by 2050 (European Climate Law, Citation2021). As the role of the building sector is critical for the mitigation of climate change, the Energy Performance of Buildings Directive (EPDB, Citation2010) was enforced to start the shift towards nearly Zero Energy Buildings (nZEB), but as the majority of buildings that will still remain in 2050 were already built before the implementation of the directive, also the existing stock had to be addressed. Therefore, the directive was later revised to include a requirement for a national long-term renovation strategy (EPBD, Citation2018). To genuinely reach sustainability targets, a proper model to create a holistic understanding of the different dimensions of residential building stock development is necessary. Through forecasts for new construction, mortality of buildings, and repair and renovation needs, an advanced building stock development model provides critical input, e.g. for energy demand and GHG emission analyses; thus, contributing to sustainable management of the built environment.
Even if the importance of understanding building stock dynamics and development is recognized, e.g. for sustainable management of the built environment (Aksözen, Hassler, Rivallain, et al., Citation2017), many policy-related sustainability studies still lean on relatively simple assumptions about the development of residential building stock (e.g. Mattinen et al., Citation2016; Mattinen & Heljo, Citation2016; Uihlein & Eder, Citation2010). The purpose of this paper is to provide an alternative approach to vague assumptions about the stock development by introducing a solid and transparent framework for modelling residential building stock development with a focus on the long-term need for repairs and renovations. The model is demonstrated through modelling the development of Finnish residential building stock spanning from 2020 to 2050.
To meet the objectives, the following research questions are addressed:
RQ1: How can we dynamically model the long-term development of the Finnish building stock with a focus on repair and renovation needs?
RQ2: How does the Finnish residential building stock develop in terms of new construction, mortality, and repairs and renovations in the study period from 2020 to 2050?
RQ3: Is the modeled need for repairs and renovations in line with the Finnish national Long-Term Renovation Strategy 2020–2050?
Background
Building stock models
In the previous literature, there are various attempts to deal with building stock dynamics, varying from the use of simple assumptions to more advanced modelling approaches. In sustainability-related studies, the building stock’s current state is usually defined based on approaches using constructed building archetypes (e.g. Swan & Ugursal, Citation2009) or sample buildings (e.g. Mata et al., Citation2014). Nägeli et al. (Citation2018) have also introduced an approach where synthetically created microdata is used to describe individual buildings instead of using aggregate average archetype buildings. Later, Nägeli et al. (Citation2022) have further developed the methodology to also allow modelling spatially distributed synthetic building stocks. Yet another approach by Nägeli et al. (Citation2020) is an agent-based modelling approach where a bottom-up building stock model is combined with agent-based modelling to allow individual decisions on building level. The previous body of literature on building stock dynamics also covers topics like reconstitution of building stock dynamics (Aksözen, Hassler, & Kohler, Citation2017), mortality of building stock (Aksözen, Hassler, Rivallain, et al., Citation2017), statistical analysis on demolished buildings (Huuhka & Lahdensivu, Citation2016), vacancy of residential buildings (Huuhka, Citation2016), and use of cadastral data to assess urban scale building energy loss (Martín-Consuegra et al., Citation2018). These studies are important contributions to better understanding building stock dynamics, but they do not directly offer tools for modelling long-term future development of building stocks.
Moreover, there are studies on forecasting construction demand, including approaches like multiple regression analysis (Bee-Hua, Citation1999), a panel vector error correction approach (Jiang & Liu, Citation2014), a combination of neural networks and genetic algorithms (Bee-Hua, Citation2000), grey forecasting (Tan et al., Citation2015), and Box–Jenkins model (Fan et al., Citation2010). Still, the limitation of these approaches is that they are at their best in short- or medium-term forecasts.
Interestingly, there is also a relatively large body of literature documenting national attempts to assess long-term housing needs in many countries. These include but are not limited to Finland (Lankinen, Citation1996; Vainio, Citation2020), Sweden (Boverket, Citation2018; Citation2016), Norway (Ruud et al., Citation2013), Denmark (Socialministeriet, Citation2006), England (Ministry of Housing, Communities & Local Government, Citation2019), the US (Landis, Citation2000), and Australia (Rowley et al., Citation2017). However, in these studies, the focus is rather on assessing housing need than modelling the holistic development of the building stock, which is the focus of this research.
In some of the most closely related studies, Dynamic Material Flow Analysis (MFA) has been used to model long-term development of residential building stock in the Netherlands (Müller, Citation2006), Norway (Bergsdal et al., Citation2007), and China (Hu, Bergsdal, et al., Citation2010; Hu, Pauliuk, et al., Citation2010; Hu, van der Voet, et al., Citation2010). Moreover, the modelling approach has been further developed to better suit for examining the need for repairs and renovations (Sartori et al., Citation2008, Citation2016). These have been applied to model the long-term stock development and need for repairs and renovations in 12 European countries (Sandberg et al., Citation2016; Sartori et al., Citation2016). Sandberg et al. (Citation2014) have also studied how the uncertainty of input parameters affects the modelling results, recognizing changes in population and lifetime of dwellings to be the most critical input parameters in terms of sensitivity. The most recent contribution is a paper from Kurvinen et al. (Citation2021), where they reported an approach to model development of the entire Finnish building stock leaning on MFA and incorporating an empirical building mortality modelling approach. Also, two recent studies from Huuhka (Citation2021) and Kolkwitz et al. (Citation2023) use material flow analysis to examine local building stocks in Finland but their focus is the past development in two specific case cities, as opposed to this study, where the focus is on modelling the long-term need for repairs and renovations in the entire residential building stock.
There is also a significant body of related recent literature where material flow analysis is used to model environmental impacts from building stocks. Those include but are not limited to modelling global material stocks and flows for residential and service sector buildings (Deetman et al., Citation2020), material flows and GHG emissions from housing stocks in US counties (Berrill & Hertwich, Citation2021), a bottom-up dynamic building stock model for residential energy transition in Netherlands (Yang et al., Citation2022), and development of bottom-up model to estimate dynamic carbon emission for city-scale buildings in Changsha (Yang et al., Citation2023), embodied greenhouse gas emissions in structural materials for the German residential building stock (Hingorani et al., Citation2023). As opposed to our research, these previous studies mostly use Weibull distribution to address demolition with the exception that Zhang et al. (Citation2022) have preferred using normal distribution instead, and Berrill and Hertwich (Citation2021) have incorporated vacancy-dependent loss rates to allow modelling building stock evolution in regions with low or negative population growth. In terms of renovations, these previous works rely on normal distribution or exclude renovation activities from the analysis with the exception that Yang et al. (Citation2022) use Dutch National Climate Agreement related neighbourhood based grouping for renovations, and Zhang et al. (Citation2022) base their approach on the proportion of buildings that are retrofitted at the end of life in a certain year.
Long-term renovation strategy 2020–2050 (LTRS)
According to the revised Energy Performance of Buildings Directive, all EU countries must establish a long-term renovation strategy to support the renovation of the national building stock into a highly energy efficient and decarbonized building stock by 2050 (EPBD, Citation2018). In their working document (SWD/2022/375), the European Commission has analyzed the national long-term renovation strategies and considered the Spanish LTRS (De Santiago, Citation2015; Ministry of Transport Mobility and Urban Agenda, Citation2020) as the best. Considering the Finnish LTRS, further details of the investment needs and a more detailed analysis of wider benefits of building renovation were assessed as potential areas of improvement.
In the Finnish national Long-Term Renovation Strategy 2020–2050 (Ministry of Environment, Citation2020), three primary means of improving the sustainability of Finnish building stock were identified. Those include (1) building loss and improvement of energy efficiency, (2) improvement of energy efficiency in connection with renovations and maintenance, and (3) abandoning fossil energy sources in energy production. The modelling approach used in this paper addresses the renovation strategy primary means (1) and (2), while (3) is outside the scope of this paper.
In the renovation strategy, it is recognized that in the interest of conserving natural resources and ensuring cost-effectiveness, investments in energy efficiency improvements should be combined with renovations that occur based on other compelling reasons. However, the energy efficiency of all buildings in active use can be improved by means of careful maintenance and building automation. Importantly, these principles are in line with the empirically based renovation packages and cycles that are implemented in the modelling procedure.
Further, it is observed that based on the regional population projections, underutilization of the building stock is becoming more common in many locations in Finland. Therefore, removing all vacant buildings from the building stock would be profitable. Still, it is estimated that 70% of the 2020 building stock will remain in 2050. The underutilization aspect is addressed in the modelling procedure by differentiating between functional obsolescence based and market based renovation need.
Materials
Input data from Statistics Finland
The input data for the modelling procedure is acquired from Statistics Finland. To assess need for housing, the official population projection from Statistics Finland (OSF, Citation2022a) is used as an input for the model. As the municipality level projection was only available until 2040, it was supplemented with a forecast for years 2041–2050, which was created using exponential smoothing (ETS). The state of the Finnish residential building stock in 2020, that is, the beginning of the modelling period, is constructed based on official statistics of dwellings and housing conditions (OSF, Citation2022b). The same data allows calculating and estimating future trends for floor area per person –ratio, which is another component of assessing the housing need. The critical variables for the modelling are location (municipality), housing type (single-family house, row house, or block-of-flat), residential floor area, number of residents, and whether the housing unit is permanently occupied.
Geographical heterogeneity and municipality categories
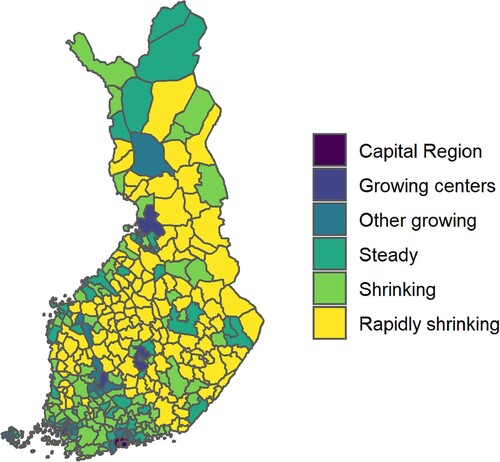
To allow geographical heterogeneity simultaneously with understandable representation of the results, Finnish municipalities were divided into six categories according to the latest population projection from Statistics Finland (OSF, Citation2022a). The categories include capital region, growing major municipalities, other growing municipalities, steady municipalities, shrinking municipalities, and rapidly shrinking municipalities.
The category of growing major municipalities includes larger cities where the population growth is projected to be over 5 percent in the period of 2021–2040. Those include Tampere, Turku, Jyväskylä, and Oulu. Other growing municipalities consist of middle or smaller sized municipalities with a projected population growth of over 5 percent until 2040. The category of steady municipalities includes municipalities where the population growth is projected to be between −5 and 5 percent in the coming twenty-year period. In shrinking cities, the population is projected to decrease from 5 to 10 percent and, in rapidly shrinking cities, over 10 percent until 2040. ()
Figure 1. Division into municipality categories based on the latest official population projection by Statistics Finland (OSF, Citation2022a).
Constitution of Finnish residential building stock
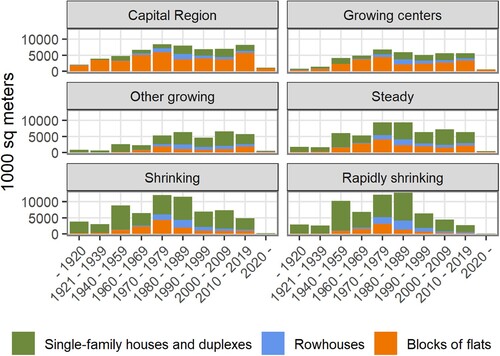
reveals that the constitution of Finnish residential building stock in 2020 differs between municipality categories. Interestingly, blocks of flats have the major proportion of floor area only in Capital Region and Growing centres while single-family houses and duplexes dominate in other municipality categories. Further, the age distribution of Finnish residential building stock seems to vary between building types. Single-family houses and duplexes have been built in all decades, but a major proportion of mid-rise blocks of flats were built in 1960s and 1970s because of industrialization and resulting rapid migration from rural areas to cities. New rowhouses were delivered to the housing market particularly in 1970s and 1980s.
Figure 2. Constitution of the Finnish residential building stock by municipality categories in 2020 (OSF, Citation2022b).
Method
Description of the modelling framework
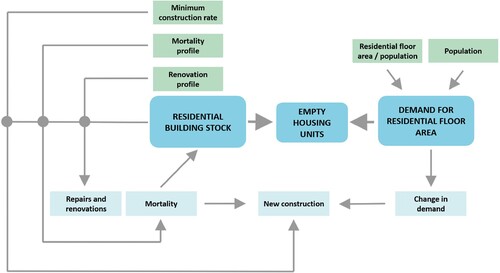
The used modelling framework is based on Dynamic Material Flow Analysis (MFA) and is built upon the approach from Sartori et al. (Citation2016). Their approach is amended by incorporating the building mortality approach from Kurvinen et al. (Citation2021) and the building rehabilitation model from Saari (Citation1998) into the modelling framework. An illustration of the dynamic modelling strategy is presented in . In the model, residential floor area per resident –ratio and population amount are drivers for demand for residential floor area, which creates demand for new construction. Mortality profile provides the probability for loss of a residential building each year since the completion, which affects the existing building stock through mortality of buildings. In this context, mortality is considered a broader concept than merely physical demolition of buildings. Mortality also potentially increases the need for new construction as lost buildings must be replaced with new construction if there is local demand. Still, the minimum new construction rate is set to be 0.2% of the local residential building stock size. The repairs and renovations in the existing residential building stock are defined in the renovation profile, which provides probability for a building to be in need of specific repairs or renovations in relation to their age. Finally, the empty housing units exist when the size of the local stock is greater than the local demand for residential floor area ().
Figure 3. Illustration of the dynamic modelling framework.
Modelling procedure
To understand the modelling procedure, it is important to notice that so called convolution operator from Sartori et al. (Citation2016) is used below in Equation (4) and Equation (7). In Equation (1), convolution is a mathematical operator between two functions f and g, describing how much these functions overlap when one function is shifted over another. Convolution between f and g is denoted as f*g and the whole equation is formally defined as follows:
(1)
(1) Now, the modelling procedure may be shortly described through Equations (2)–(7) as follows. Modelling is performed per each year and notation (t) refers to respective years in the modelling procedure.
(2)
(2)
Equation 2: The state of residential building stock in the beginning of the first year of the modelling procedure is the starting point for the modelling procedure. To define the municipal residential building stock size in floor area (), ‘permanently occupied floor area’ is first divided by ‘number of residents living within the municipal borders’. Next, leaning on empirical observations from previous years, projections of municipal residential floor area per resident ratios are estimated until the year of 2050.
is calculated by taking inverses of the projected floor space parameters, i.e. ‘population within the municipal borders’ divided by ‘persons per permanently occupied residential floor area’. Then, these parameters are input into the model. Finally, residential building stock size in floor area (
) is computed by dividing ‘population
’ by ‘persons per floor area (
)’.
(3)
(3) Equation 3: Changes in the residential building stock size in year t are dependent on new housing construction
ja mortality of the existing residential building stock
. New construction is determined based on the change in demand for residential floor area. Mortality of residential floor area is replaced by new construction based on the market demand. Still, the annual minimum rate of new construction is 0.2% of the local housing stock.
(4)
(4)
Equation 4: The basic version of Equation (4) equals to Sartori et al. (Citation2016). Mortality of residential floor area in year t is a convolution of mortality function
and new construction
. Moreover, mortality of residential buildings that existed already before the beginning of the study period is accounted for in the initial value
.
In this research, the distribution-based mortality function is replaced with the approach from Kurvinen et al. (Citation2021), where empirical observations from previous years are used to iterate a mortality matrix, which depicts mortality probability of residential buildings at specific ages. For a simplified analysis, also Eq. (4) may be applied.
(5)
(5) Equation 5: Based on the year of construction, lifetime profile (
) provides probability for a residential building to be further in use each year since completion. More precisely, lifetime profile is constructed of complements to 1 of mortality probability matrix (mortality profile) values.
(6)
(6)
Equation 6: The basic version of Equation (6) equals to Sartori et al. (Citation2016). Repairs and renovations may occur several times during the lifetime, whereas mortality only occurs once. Renovation profile () is constructed based on cyclical repetitions (
) of renovation function (
), which are weighed in relation to lifetime profile that has been shifted with
years (
). The shift is performed to ensure that the model does not target renovations to buildings, which will not soon be in use anymore. The lifetime after a renovation is at minimum expected to be as long as the renovation cycle, i.e.
equals to the length of the renovation cycle.
In this research, the renovation function is replaced with evidence-based renovation cycles that are computationally defined. This approach is based on rehabilitation degree model from Saari (Citation1998). For a simplified analysis, also equation (6) may be applied.
(7)
(7) Equation 7: The volume of repairs and renovations in year t (
) is a convolution of renovation profile and new construction in the previous years of the study period. Moreover, repairs and renovations of the residential buildings that existed already before the beginning of the study period are accounted for in the initial value
.
Differentiating between obsolescence and market demand based renovation need
As the risk for underutilization of the residential building stock is increasing in many Finnish municipalities (Ministry of Environment, Citation2020; ), it is important to differentiate between different types of renovation needs. In this paper, obsolescence-based renovation need refers to repairs and renovations, which should be performed because of technical or functional obsolescence. When such renovation needs occur in locations where the residential building stock is underutilized or is in the risk of soon becoming underutilized, these obsolescence-based renovation needs may not be fully feasible in market terms. To address this, market demand based renovation need is used to refer to that proportion of obsolescence-based renovation need, which may also be considered feasible when the local demand for residential floor area is taken into account.
The concept of a natural vacancy rate should provide a good reference point for defining which share of the renovation need is market demand based. It is widely accepted that housing markets have their natural vacancy rates, which seem to differ between areas and points of time (e.g. Wheaton, Citation1990). Thus, fluctuation around the natural vacancy rate reflects changes in supply and demand in the local housing market. For example, Rosen and Smith (Citation1983) reported that natural vacancy rates vary between 5 and 15 percent in the US housing markets. In Finland, the level of natural vacancy rates resulting from the housing market rigidities alone has been estimated to be some 5 percent of the housing stock (Laakso & Loikkanen, Citation2004; Paavilainen, Citation2020). Therefore, notably higher vacancy rates in the Finnish context potentially refer to dysfunction in the housing market, which may be attributable to drastically falling demand or excessively high volumes of new housing construction (Paavilainen, Citation2020). In this research, the market demand based need for repairs and renovations is linked to the estimated natural vacancy rate so that only renovations on residential units within the 5 percent vacancy threshold are considered market demand based.
Results
Mortality profile
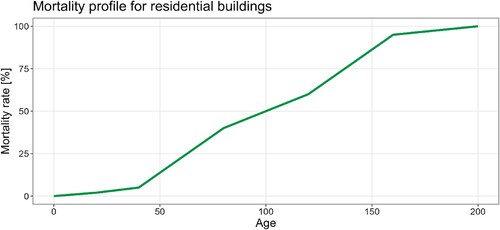
The mortality profile is a central input for the model. As there are different types of mortality, including (A) demolition, (B) alterations to purpose of use, and (C) merger of spaces, it is important to explain what mortality of building stock means in the context of this paper. As the model operates with floor areas, the types of mortality that are included are limited to types A and B. This is simply because of data limitations, as demolition of buildings and switching to another purpose of use are visible in statistics while merger of spaces is not. Still, types A and B cannot be separated from each other as only the total changes are reported in the official statistics.
To predict the mortality of the existing residential building stock, mortality functions were constructed based on the official statistics from Statistics Finland. The collected data account for the size of the stock for different types of buildings by year built at different cross-sectional years (1950, 1960, 1970, 1980, 1990, 2000, 2010, 2018), allowing for the construction of separate mortality functions for each completion decade. Finally, these separate functions, describing the mortality rates of buildings from their respective decades at different cross sections of time, were merged into an integrated mortality profile for all residential buildings. The mortality profile that is used in the modelling procedure is presented in .
Figure 4. Empirically based mortality profile for residential buildings.
Renovation profile
As statistics on repairs and renovations are insufficient to provide a comprehensive view of the current state of the residential building stock, the starting point for the analysis cannot lean on these data. Instead, this was addressed by using computationally defined empirical repair and renovation packages. These packages were included in the MFA model as repair and renovation profiles, while statistics on repairs and renovations were used when validating the modelling approach.
Construction of repair and renovation packages leans on empirical knowledge of lifetimes of different technical building systems and structural components, and on the rehabilitation degree that corresponds to replacing these items (). Rehabilitation degree describes the cost of renovation in relation to new construction cost of similar building and spaces (Saari, Citation1998). To calculate the costs for repair and renovation packages, TAKUTM Target Costing software was used (Rowley et al., Citation2018). Then, if rehabilitation degree is 50%, the renovation cost is half of the target cost of constructing a new building. Thus, rehabilitation degree provides an intuitive measure to clarify the magnitude of the renovation project in relation to a totally new building.
Table 1. Rehabilitation degrees for different repair and renovation packages (BoF = block of flat ja SH = single-family house), repair age and description of the package.
The repair and renovation packages were separately calculated for residential blocks of flats and single-family houses. The single-family house packages were also applied to rowhouses, as their spatial structure is similar. Therefore, one rowhouse can be considered to comprise of several concatenated housing units, which spatial structure equals to small single-family houses. The major differences between repair and renovation packages for blocks of flats and single-family houses are that there are no shared spaces in single-family houses and the proportion of building envelope in relation to floor area is greater in single-family houses than in blocks of flats. As a result, rehabilitation degrees are different depending on the building type.
In addition to rehabilitation degree that depicts the magnitude of renovations, another central dimension in the modelling procedure is the length of renovation cycles. Those indicate at what age the renovations are typically performed. In the base scenario, a light facelift repair is performed in 25-year cycles, a regular renovation in 50-year cycles, and a heavy renovation in 100-year cycles. Here, the more thorough renovations also include the lighter repairs. Moreover, it is recognized that in real world the repair and renovation cycles do not strictly follow the cycles, and this has been included in the modelling procedure through renovation cycle deviation parameters.
The repair and renovation packages are directly linked to improvement of energy efficiency in connection with renovations and maintenance, which is mentioned as one of the three primary means of improving building stock sustainability in the Finnish Long-Term Renovation Strategy 2020–2050 (LTRS) (Ministry of Environment, Citation2020). The packages include all other measures that are listed in the LTRS but decarbonization through switching to a more sustainable heating system is excluded. A detailed description of the energy efficiency measures included in the packages is provided in . The repair and renovation packages and cycles reflect the idea that energy efficiency improvements should be realized in connection with other repair and renovation actions to allow ecological efficiency and cost-effectiveness, which is recognized as an important trigger point in the Finnish LTRS.
Renovation costs
Renovation costs vary with location and these locational price differences have been considered for each renovation package by using HAAHTELA Tender Price Index (Haahtela, Citation2022). It is a price index for building construction that describes the development of tender prices in various index regions. In this research, the Finnish municipalities are divided into six categories and the following HAAHTELA Tender Price Index values are used for them:
(i) capital region (index value: 110)
(ii) growing major municipalities and (iii) other growing municipalities (index value: 104)
(iv)steady municipalities and (v) shrinking municipalities (index value: 92)
(vi) rapidly shrinking municipalities (index value: 87)
In , the average costs of each renovation package are presented per living floor area for different building types (BoF = block of flat ja SH = single-family house) and municipality categories. The costs are reported according to the tender price level in January 2021 including VAT 24%, and the share of new construction cost equals to the rehabilitation degree of each package.
Table 2. Average costs of renovation packages [€/sqm] for different building types (BoF = block of flat ja SH = single-family house) and municipality categories.
Dynamic evolution of residential building stock 2020–2050
The modelled dynamic evolution of the entire Finnish building stock spanning from 2020 to 2050 is presented in and . The flows including new construction, mortality, and renovation (obsolescence based need for repairs and renovations) are depicted in while the changes in the stock size and constitution are shown in . In , building types are differentiated so that solid lines denote blocks of flats and dash-dotted lines indicate low-rise buildings including single-family and duplex houses, and rowhouses. New construction of both blocks of flats and low-rise buildings has a decreasing trend in the modelling period while the volume of renovations is trending upwards. In terms of blocks of flats, annually renovated floor area overtakes annual new construction around 2035. In terms of residential low-rise buildings, the annual volume of renovations is notably higher than the volume of new construction during the entire modelling period. New construction of blocks of flats is faster than the mortality during the entire modelling period, resulting in growing stock of blocks of flats, even if the growth pace is decreasing towards the end of the modelling period. Mortality of residential low-rise buildings is higher than new construction volumes for almost the entire modelling period, resulting in decreasing stock of low-rise buildings. Based on the modelling, some 75 percent of the residential building stock in 2020 is still remaining in 2050, and approximately two thirds of the new construction have replaced mortality of old buildings. To allow better understanding of the stock development in terms of geographical heterogeneity, the results are also presented by municipality categories in and .
Figure 5. Dynamic evolution of the residential building stock, 2020–2050.
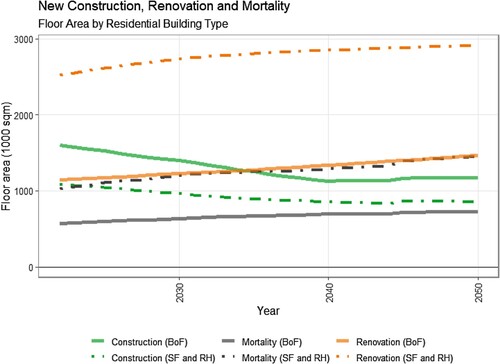
Figure 6. Cumulative development of the residential building stock, 2020–2050.
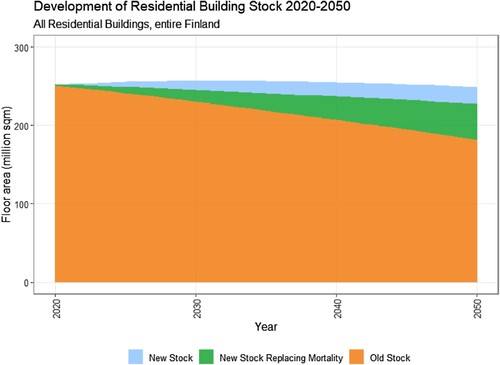
Figure 7. Dynamic evolution of the residential building stock by municipality categories, 2020–2050.
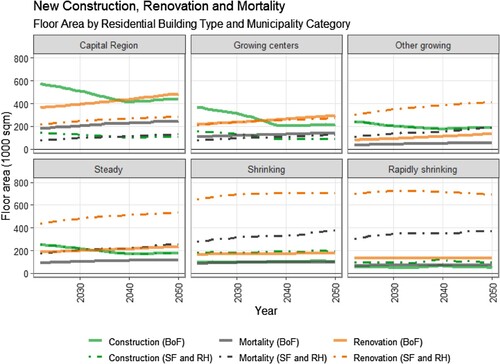
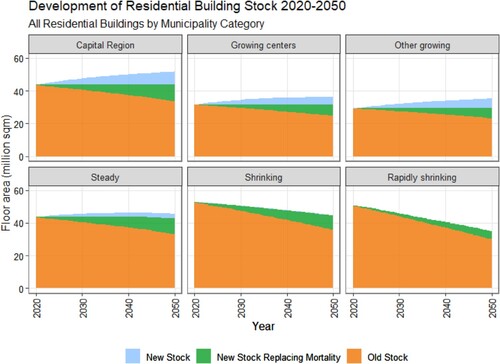
Figure 8. Cumulative development of the residential building stock by municipality categories, 2020–2050.
reveals differences in the new construction, mortality, renovation flows by municipality categories. In Capital Region the highest volumes of activities are related to blocks of flats, which is also the case in growing centres. In these two municipality categories, it also takes longer before renovation volumes takeover the volumes of new construction. In Capital Region this happens some years before 2040 and in the category of growing centres around 2035. In all the other municipality categories, where the residential low-rise buildings dominate, also the renovation need for renovation activities of single family and duplex houses, and rowhouses create the greatest flows. In shrinking and rapidly shrinking municipality categories, the mortality of old buildings outstrips the volumes of new construction. Still, some new construction occurs in all municipality categories.
shows the geographical differences in the stock changes, revealing that the total size of residential building stock is increasing in Capital Region, growing centres, and other growing centres. In the municipalities with steady population amount, the stock size remains about the same through the modelling period while notable decreases in the stock size occur in shrinking and rapidly shrinking municipalities, where the mortality of old buildings is not fully replaced with new construction.
Annual cost of obsolescence based need for repairs and renovations
In , annual average need for obsolescence based repairs and renovations is presented in monetary terms. The highest volume of repairs and renovations occurs is shrinking and rapidly shrinking regions. Each of these two categories represent approximately one fifth of the annual repairs and renovations in the Finnish housing stock. The average need for repairs and renovations in the capital region is about one sixth of the repair and renovation need in the entire stock, annually. Growing centres and other growing regions both represent approximately 12% of repair and renovation need. The lowest volume of repairs and renovations is in regions with steady population amount that represent approximately 8% of the need.
Figure 9. Average annual obsolescence based need for repairs and renovations per different residential building types and municipality categories.
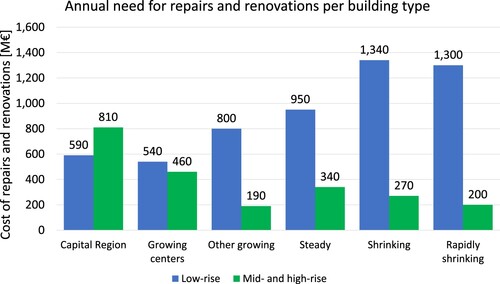
When scrutinizing the modelling results in terms of residential building types (), it is observed that the capital region is the only municipality category where need for repairs and renovations is notably higher in mid- and high-rise buildings than in low-rise buildings as is the case in all the other municipality categories. In growing centres, the proportions of repairs and renovations in low-rise buildings and mid-rise buildings are close to each other while, in other municipality categories, the share of repairs and renovations in low-rise buildings is notably higher than the share of high-rise buildings. The most important factor behind the results is the different distribution of different residential building types within different municipality categories.
Market demand based or not?
As defined in this research, market demand based need for repairs and renovations equals to functional obsolescence based need in capital region, growing centres, and in other growing regions. At the same time, demand based need for repairs and renovations is lower than obsolescence based need in steady, shrinking, and rapidly shrinking regions ().
Figure 10. Functional obsolescence based and market demand based need for repairs and renovations. The rasterized part of the column is the difference between obsolescence based and market demand based need.
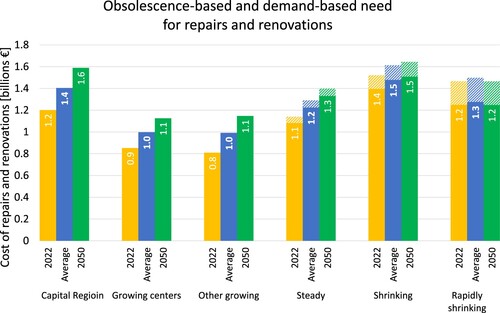
In regions with steady population amount, the demand based need for repairs and renovations is 95% of the obsolescence based need. In shrinking regions and in rapidly shrinking regions the proportions are 92% and 85%, respectively. The total volume of demand based repair and renovation need is the greatest in shrinking regions (1.5 billion euros annually). Nex greatest volume is in the capital region (1.4 billion euros annually) as in rapidly shrinking regions the market demand for residential buildings is notably lower than the functional obsolescence based need for repairs and renovations. It is also good to notice that the market based need for repairs and renovations notably increases in the capital region during the modelling period. The increase is clearly faster than in shrinking regions, which results in that, at the end of the modelling period, the greatest volume of repairs and renovations is in capital region. Third greatest volume of market based need for repairs and renovations is in rapidly shrinking regions (1.3 billion euros annually). However, during the modelling period, the market based need in steady regions grows higher (1.2 billion euros annually) than in rapidly shrinking regions. The smallest volume of market based need is in growing centres and in other growing regions (approximately one billion euros annually). Apart from rapidly shrinking regions, in all other municipality types there is an upward trend in the volume of market demand based need for repairs and renovations.
Validation of the modelling approach
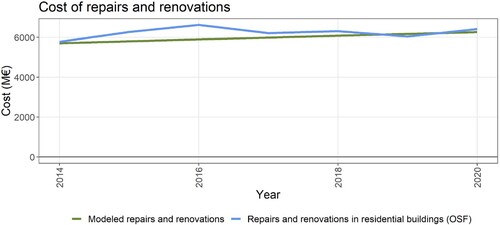
To validate the modelling approach, the need for repairs and renovations was modelled in a past period from 2014 to 2020. Then, the modelling results were compared to the official statistics for the same period (OSF, Citation2020). The time frame from 2014 to 2020 was selected for the comparison as there are no major changes in the compilation of the statistics in this period. The comparison is demonstrated in , showing that the modelled results are of the same order as the numbers in annual statistics that follow the costs of repairs and renovations in residential buildings. This confirms that the used modelling approach provides appropriate results when the modelling attributes are accurate enough.
Figure 11. Modelled market demand based need for repairs and renovations (green line), and repairs and renovations from the Official Statistics of Finland (Citation2020) (blue line).
At the same time, it is critical to remember that both the modelling procedure and compilation of statistics involve numerous uncertainties and minor differences that may result in biases. Those include but are not limited to that (i) the actual costs may be different to those selected for the modelling, (ii) the volume of actual repairs and renovations may be different to the modelled need for repairs and renovations that is dependent on the population projection, (iii) do-it-yourself repairs and renovations are not included in the statistics, (iv) people answering queries that are used for compilation of the statistics may have different understandings of what is included in different cost items, (v) those who are more active in repairs and renovation may also be more active in answering queries (bias is possible even if statistics involve a calculation based correction for this), (vi) there may be regional differences in answering the queries (bias is possible even if statistics involve a calculation based correction for this), and (vii) minor annual repairs (performed by professionals) are included in the statistics but excluded from the modelling.
Discussion
The purpose of this paper is to provide an alternative approach to vague assumptions about the residential building stock development with a focus on the long-term need for repairs and renovations. To address the first research question (RQ1) about how we can dynamically model the long-term development of the Finnish building stock with a focus on repair and renovation needs, a transparent framework for modelling development of residential building stock is introduced. The modelling methodology is based on Dynamic Material Flow Analysis (MFA). The modelling framework is built upon the previously reported work from Sartori et al. (Citation2016), which is complemented by the empirically based building mortality approach from Kurvinen et al. (Citation2021) and the building rehabilitation model from Saari (Citation1998). Our contribution through these amendments allows a context-tailored modelling approach where the history and characteristics of local housing stocks are taken into consideration as opposed to previous literature with a more straightforward creation of distribution based mortality and renovation profiles. Another distinct advantage of the incorporated building rehabilitation model is that it also allows expressing the repairs and renovations in monetary terms. As the modelling framework is developed using Finnish statistics, updating the analysis should be relatively effortless when new data becomes available. This also allows wide applicability to other geographical locations where adequate statistical data are available.
To answer the second research question (RQ2) about how the Finnish residential building stock will develop in terms of new construction, mortality, and repairs and renovations in the study period from 2020 to 2050, the use of the modelling framework is demonstrated by modelling the development of Finnish residential building stock spanning from 2020 to 2050. Even if the Finnish building stock and energy renovations have been examined in various previous studies, to our knowledge, this is the first journal contribution to present dynamic modelling of the Finnish building stock development, including new construction, mortality of buildings, and need for repairs and renovations. For conciseness, the focus of this article is in the base modelling scenario, and a detailed description of the sensitivity analysisFootnote1 will be presented in a follow-up paper.
The average annual obsolescence based need of repairs and renovations is 4.1 million square metres of residential floor area, equalling to 1.8% percent of the entire housing stock, which is notably higher than the average realized European retrofit rate of 0.2% (Ibañez Iralde et al., Citation2021). Instead, our modelled renovation rate is of same magnitude, even though slightly higher than what Sartori et al. (Citation2016) have modelled for Norway and Sandberg et al. (Citation2016) for 11 European countries (Finland is not included). They also observed that only minor increases in renovation rates are expected, which is also reinforced by our results. Moreover, our modelling also confirms findings from Sandberg et al. (Citation2014), suggesting that renovation rates of 2.5–3% are not reached through natural renovation cycles. In monetary terms, the modelled annual need for repairs and renovations is 7.8 billion euros. Resulting from the aging housing stock, the need increases through modelling period. Some 70% of the obsolescence-based need for repairs and renovations occurs in low-rise buildings (row houses and single-family homes), and the proportion of repairs and renovations in mid- and high-rise buildings is greater only in the capital region.
On average, the annual mortality of residential buildings is 1.9 million residential square metres (0.8% of the existing residential building stock). The average mortality rate is slightly higher than what Sandberg et al. (Citation2016) have reported for Norway (0.5–0.6%) but well within the variation of the 11 European countries they have studied (0.2–1.2%). The modelled annual mortality of buildings equals to about half of the residential floor area that is annually in need for repairs and renovations. As a result of the aging building stock, there is an upward trend in mortality of residential buildings. The annual volume of new housing construction is, on average, 2.2 million residential square metres (1.0% of the residential building stock). Sandberg et al. (Citation2016) report in their study the construction rate in Norway to be 1.2–1.5%, while rates in all 11 studied countries vary from 0.3% to 2.0%. In our study, the annual new construction is about one half of the annual obsolescence-based need for repairs and renovations. As opposed to renovations and mortality of buildings, the annual volume of new construction has a downward trend in the modelling period. Therefore, the total size of the housing stock hardly increases but rather starts decreasing towards the end of the modelling period. At the same time, repairs and renovations form yet increasing share of the construction market. New housing construction still occurs also in regions where population amount is decreasing to address changing needs in the housing markets.
Finally, to address the third research question (RQ3) concerning if the modelled need for repairs and renovations in line with the Finnish national Long-Term Renovation Strategy 2020–2050 (LTRS) (Ministry of Environment, Citation2020), the modelling results are discussed in relation to the national strategy. Implementing the empirically based renovation packages and cycles allow considering various renovation measures and setting the modelling results in perspective relative to the Finnish LTRS. The introduced modelling approach addresses two of three primary means of improving sustainability that are recognized in the Finnish LTRS. Those include (1) building loss and improvement of energy efficiency, (2) improvement of energy efficiency in connection with renovations and maintenance while the third mean (3) abandoning fossil energy sources in energy production is outside the scope of this research. In the LTRS, it is emphasized that investments in energy efficiency improvements should be combined with renovations that occur based on other compelling reasons. This principle is in line with the empirically based renovation packages and cycles that are the basis for the renovation profile that is implemented in the modelling procedure. Also, the cost efficient energy efficiency measures listed in the LTRS are mostly included in the renovation packages. Further, it is recognized in the LTRS that underutilization of the building stock is becoming more common in many locations in Finland. Therefore, the LTRS suggests removing all vacant buildings from the building stock to be profitable. Still, it is estimated that 70% of the 2020 building stock will remain in 2050 while our modelling results suggest that 75% is remaining. However, in the modelling procedure, the underutilization aspect is in addition to mortality also addressed by differentiating between obsolescence based and market based renovation need, and in the entire Finnish housing stock some 95% percent of obsolescence based need for repairs and renovations is considered market demand based. As this is reduced from the original estimate of 75%, the final approximation is very well in line with the Finnish LTRS. In terms of market demand based need for repairs and renovations, geographical heterogeneity is notable. In growing municipalities, there is a market demand for the entire existing housing stock (excluding the annual mortality of residential buildings), while in regions with steady population amount, shrinking regions, and in rapidly shrinking regions the proportions of market demand based repairs and renovations are 95%, 92%, and 85%, respectively. In general, our modelling results suggest that the Finnish residential building stock is on the way towards 2050 emission goals.
The available statistics on repairs and renovations provided an important reference line for validation of the modelling results. The comparison between the modelling results using history data and the statistics supported the view that the modelling approach is well suited for modelling the long-term need for residential repairs and renovations. Still, it is critical to understand that modelled results are always simplified approximations. Even if the presented modelling attributes have an empirical basis, the future development may be unexpected and different. As it is known, new construction, mortality, and repair and renovations activities are many times dependent on the decisions of private people and companies. Particularly, in terms of repairs and renovations, this may have resulted in accumulation of backlog of undone works from years before the beginning of the modelling period. And, it is good to notice that such potential previous backlog is not included in the modelling results.
Lastly, as the focus has been on modelling development of residential building stock, the modelling results should not be directly generalized to other building types, such as office, commercial, and industrial. For example, Kurvinen et al. (Citation2021) have reported that mortality of other building types is faster than mortality of residential buildings, which should also be linked with renovation strategies and new construction activities of these other building types. Therefore, more research on development dynamics of other building types is necessary before valid conclusions may be drawn.
Conclusion
This paper aims to provide a solid and transparent approach for modelling residential building stock development with a focus on the long-term need for repairs and renovations. The modelling methodology is based on Dynamic Material Flow Analysis (MFA). Our main contribution is the incorporation of the empirically based mortality model and building rehabilitation model in the MFA modelling framework. The use of the modelling framework is demonstrated by modelling the development of Finnish residential building stock spanning from 2020 to 2050. The average annual obsolescence-based need of repairs and renovations is 4.1 million square metres of residential floor area, equalling to 1.8% percent of the entire housing stock. In monetary terms, this means 7.8 billion euros annually.
In the LTRS, it is emphasized that investments in energy efficiency improvements should be combined with renovations that occur based on other compelling reasons. This principle is in line with the empirically based renovation packages and cycles. Also, the cost efficient energy efficiency measures listed in the LTRS are mostly included in the renovation packages. Further, it is recognized in the LTRS that underutilization of the building stock is becoming more common in many locations in Finland, and it is estimated that 70% of the 2020 building stock will remain in 2050.
Based on the results, it is concluded that:
The model is widely applicable to other geographic locations where adequate data is available.
As opposed to renovations and mortality of buildings, the annual volume of new construction has a downward trend in the modelling period, and the total size of the residential building stock slightly starts decreasing towards the end of the modelling period.
The share of repairs and renovations increases in the construction market.
In the entire Finnish residential building stock, some 95% of obsolescence based need for repairs and renovations is considered market demand based, but the share notably varies between regions.
The modelling results are in line with the LTRS, supporting the view that the Finnish residential building stock is on the way towards 2050 emission goals.
For future work, it would be useful to incorporate a population projection model into the modelling framework. This would allow a more detailed analysis within the cities if the official population projection could be distributed from municipality level to residential neighbourhoods. Also, including non-residential buildings into the model should serve the objective of sustainable management of the built environment. Further, a possibility to report the modelled flow measures also in numbers of housing units would be an informative addition to the model.
Acknowledgements
The authors would like to thank the funders for a fruitful collaboration. The main author would also like to thank the Tampere Institute for Advanced Study for creating exceptional circumstances for scientific research.
Disclosure statement
No potential conflict of interest was reported by the author(s).
Additional information
Funding
Notes
1 In addition to the base modeling scenario, the sensitivity of the results was modeled in relation to (i) faster and more slowly smoothing growth trends of floor area per person, (ii) faster and slower mortality rates of residential buildings, and (iii) faster repair and renovation cycles. The smoothing pace of floor area growth trend had the greatest impact on the volume of new housing construction while the impact on the obsolescence-based need for repairs and renovations and on mortality was relatively small. However, floor area per person ratio directly affects housing demand and, therefore, it has greater impact on the financial feasibility of repairs and renovations, particularly in shrinking regions. Also, faster and slower mortality rates mostly affect the volumes of mortality and new housing construction as the impact on the obsolescence-based repairs and renovations is relatively small. Instead, impact on the market demand based share of needed repairs and renovations is notable, particularly in shrinking regions. As opposed to other sensitivity checks, faster repair and renovation cycles had a direct impact on the volume of needed repairs and renovations while only had a minor impact on the mortality and the volume of new housing construction. For conciseness, the focus of this paper is on the modeling approach and the base modeling scenario. A deeper analysis of the sensitivity checks will be presented in a separate paper.
References
- Aksözen, M., Hassler, U., & Kohler, N. (2017). Reconstitution of the dynamics of an urban building stock. Building Research & Information, 45(3), 239–258. https://doi.org/10.1080/09613218.2016.1152040
- Aksözen, M., Hassler, U., Rivallain, M., & Kohler, N. (2017). Mortality analysis of an urban building stock. Building Research & Information, 45(3), 259–277. https://doi.org/10.1080/09613218.2016.1152531
- Bee-Hua, G. (1999). An evaluation of the accuracy of the multiple regression approach in forecasting sectoral construction demand in Singapore. Construction Management and Economics, 17(2), 231–241. https://doi.org/10.1080/014461999371736
- Bee-Hua, G. (2000). Evaluating the performance of combining neural networks and genetic algorithms to forecast construction demand: The case of the Singapore residential sector. Construction Management and Economics, 18(2), 209–217. https://doi.org/10.1080/014461900370834
- Bergsdal, H., Brattebø, H., Bohne, R. A., & Müller, D. B. (2007). Dynamic material flow analysis for Norway’s dwelling stock. Building Research & Information, 35(5), 557–570. https://doi.org/10.1080/09613210701287588
- Berrill, P., & Hertwich, E. G. (2021). Material flows and GHG emissions from housing stock evolution in US counties, 2020–60. Buildings and Cities, 2(1), 599–617. https://doi.org/10.5334/bc.126
- Boverket. (2016). En metod för bedömning av bostadsbyggnadsbehovet (2016:32). https://www.boverket.se/sv/om-boverket/publicerat-av-boverket/publikationer/2016/en-metod-for-bedomning-av-bostadsbyggnadsbehovet/
- Boverket. (2018). Behov av nya bostäder 2018-2025 (2018:24). https://www.boverket.se/sv/om-boverket/publicerat-av-boverket/publikationer/2018/behov-av-nya-bostader-2018-2025/
- De Santiago, E. (2015). Long-term strategy for buildings’ energy renovation in the housing sector in Spain pursuant to article 4 of Directive 2012/27/UE. Conference Paper in Conference: 11th Ecocity World Summit, Abu Dhabi – UAE.
- Deetman, S., Marinova, S., van der Voet, E., van Vuuren, D. P., Edelenbosch, O., & Heijungs, R. (2020). Modelling global material stocks and flows for residential and service sector buildings towards 2050. Journal of Cleaner Production, 245, 118658. https://doi.org/10.1016/j.jclepro.2019.118658
- EPBD. (2010). Directive 2010/31/EU on the energy performance of buildings (EU. Official Journal of the European Union), 19.5.2010.
- EPBD. (2018). Directive 2018/844/EU Amending Directive of the European parliament and the council on the energy performance of buildings (EU. Official Journal of the European Union), 19.6.2018.
- European Climate Law. (2021). Regulation (EU) 2021/1119 of the European Parliament and of the Council of 30 June 2021 establishing the framework for achieving climate neutrality and amending Regulations (EC) No 401/2009 and (EU) 2018/1999 (‘European Climate Law’).
- European Commission. (2012). The roadmap for transforming the EU into a competitive, low-carbon economy by 2050.
- Fan, R. Y. C., Ng, S. T., & Wong, J. M. W. (2010). Reliability of the Box–Jenkins model for forecasting construction demand covering times of economic austerity. Construction Management and Economics, 28(3), 241–254. https://doi.org/10.1080/01446190903369899
- Haahtela. (2022). HAAHTELA tender price index [WWW] Retrieved February 24, 2022, from https://www.haahtela.fi/fi/haahtela-tarjoushintaindeksi/
- Hingorani, R., Dittrich, N., Köhler, J., & Müller, D. B. (2023). Embodied greenhouse gas emissions in structural materials for the German residential building stock — Quantification and mitigation scenarios. Building and Environment, 245, 110830. https://doi.org/10.1016/j.buildenv.2023.110830
- Hu, M., Bergsdal, H., Van der Voet, E., Huppes, G., & Müller, D. B. (2010). Dynamics of urban and rural housing stocks in China, Building Research & Information, 38(3), 301–317.
- Hu, M., Pauliuk, S., Wang, T., Huppes, G., van der Voet, E., & Müller, D. B. (2010). Iron and steel in Chinese residential buildings: A dynamic analysis. Resources, Conservation and Recycling, 54(9), 591–600. https://doi.org/10.1016/j.resconrec.2009.10.016
- Hu, M., van der Voet, E., & Huppes, G. (2010). Dynamic material flow analysis for strategic construction and demolition waste management in Beijing. Journal of Industrial Ecology, 14(3), 440–456. https://doi.org/10.1111/j.1530-9290.2010.00245.x
- Huuhka, S. (2016). Vacant residential buildings as potential reserves: A geographical and statistical study. Building Research & Information, 44(8), 816–839. https://doi.org/10.1080/09613218.2016.1107316
- Huuhka, S., & Kolkwitz, M. (2021). Stocks and flows of buildings: Analysis of existing, demolished, and constructed buildings in Tampere, Finland, 2000–2018. Journal of Industrial Ecology, 25(4), 948–960. https://doi.org/10.1111/jiec.13107
- Huuhka, S., & Lahdensivu, J. (2016). Statistical and geographical study on demolished buildings. Building Research & Information, 44(1), 73–96. https://doi.org/10.1080/09613218.2014.980101
- Ibañez Iralde, N. S., Pascual, J., & Salom, J. (2021). Energy retrofit of residential building clusters. A literature review of crossover recommended measures, policies instruments and allocated funds in Spain. Energy and Buildings, 252, 111409. https://doi.org/10.1016/j.enbuild.2021.111409
- Jiang, H., & Liu, C. (2014). A panel vector error correction approach to forecasting demand in regional construction markets. Construction Management and Economics, 32(12), 1205–1221. https://doi.org/10.1080/01446193.2014.977800
- Kolkwitz, M., Luotonen, E., & Huuhka, S. (2023). How changes in urban morphology translate into urban metabolisms of building stocks: A framework for spatiotemporal material flow analysis and a case study. Environment and Planning B: Urban Analytics and City Science, 50(6), 1559–1576. https://doi.org/10.1177/23998083221140892
- Kurvinen, A., Saari, A., Heljo, J., & Nippala, E. (2021). Modeling building stock development. Sustainability, 13(2), 723. https://doi.org/10.3390/su13020723
- Laakso, S., & Loikkanen, H. A. (2004). Kaupunkitalous: Johdatus kaupungistumiseen, kaupunkien maankäyttöön sekä yritysten ja kotitalouksien sijoittumiseen. Gaudeamus.
- Landis, J. D. (2000). Raising the roof: California housing development projections and constraints, 1997–2020. https://escholarship.org/uc/item/1391n947
- Lankinen, M. (1996). Asuntorakentamisen ennakointi (Vol. 43). Oy Edita Ab.
- Martín-Consuegra, F., de Frutos, F., Oteiza, I., & Agustín, H. A. (2018). Use of cadastral data to assess urban scale building energy loss. Application to a deprived quarter in Madrid. Energy and Buildings, 171, 50–63. https://doi.org/10.1016/j.enbuild.2018.04.007
- Mata, É, Sasic Kalagasidis, A., & Johnsson, F. (2014). Building-stock aggregation through archetype buildings: France, Germany, Spain and the UK. Building and Environment, 81, 270–282. https://doi.org/10.1016/j.buildenv.2014.06.013
- Mattinen, M., & Heljo, J. (2016). Modeling of Finnish building sector energy consumption and greenhouse gas emissions – Specification of POLIREM policy scenario model. Reports of the Finnish Environment Institute 26/2016.
- Mattinen, M., Heljo, J., & Savolahti, M. (2016). Rakennusten energiankulutuksen perusskenaario Suomessa 2015–2050. Suomen Ympäristökeskuksen, raportteja 35/2016.
- Ministry of Environment. (2020). Long-term renovation strategy 2020–2050, Finland. Report according to Article 2a of Directive (2010/31/EU) on the energy performance of buildings, as amended by Directive 2018/844/EU.
- Ministry of Housing, Communities & Local Government. (2019, July 22). Housing and economic needs assessment. GOV.UK. https://www.gov.uk/guidance/housing-and-economic-development-needs-assessments
- Ministry of Transport Mobility and Urban Agenda. (2020). ERESEE 2020 Long-term strategy for energy rehabilitation in the building sector in Spain, 2020.
- Müller, D. B. (2006). Stock dynamics for forecasting material flows—case study for housing in the Netherlands. Ecological Economics, 59(1), 142–156. https://doi.org/10.1016/j.ecolecon.2005.09.025
- Nägeli, C., Camarasa, C., Jakob, M., Catenazzi, G., & Ostermeyer, Y. (2018). Synthetic building stocks as a way to assess the energy demand and greenhouse gas emissions of national building stocks. Energy and Buildings, 173, 443–460. https://doi.org/10.1016/j.enbuild.2018.05.055
- Nägeli, C., Jakob, M., Catenazzi, G., & Ostermeyer, Y. (2020). Towards agent-based building stock modeling: Bottom-up modeling of long-term stock dynamics affecting the energy and climate impact of building stocks. Energy and Buildings, 211, 109763. https://doi.org/10.1016/j.enbuild.2020.109763
- Nägeli, C., Thuvander, L., Wallbaum, H., Cachia, R., Stortecky, S., & Hainoun, A. (2022). Methodologies for synthetic spatial building stock modelling: Data-availability-adapted approaches for the spatial analysis of building stock energy demand. Energies, 15(18), 6738. https://doi.org/10.3390/en15186738
- Official Statistics of Finland, OSF. (2020). Renovation building [e-publication]. ISSN = 1799-2974. Helsinki: Statistics Finland. Retrieved March 9, 2022, from http://www.stat.fi/til/kora/2020/index_en.html
- Official Statistics of Finland, OSF. (2022a). Population projection [e-publication]. ISSN = 1798-5137. Helsinki: Statistics Finland. Retrieved March 20, 2022, from http://www.stat.fi/til/vaenn/index_en.html
- Official Statistics of Finland, OSF. (2022b). Dwellings and housing conditions [e-publication]. ISSN = 1798-6745. Helsinki: Statistics Finland. Retrieved March 20, 2022, from http://www.stat.fi/til/asas/index_en.html
- Paavilainen, P. (2020). Tyhjillään olevien asuntojen määrä kasvanut merkittävästi 2000-luvulla – mistä tässä on kyse? Tieto & Trendit. Retrieved October 9, 2021, from https://www.stat.fi/tietotrendit/artikkelit/2020/tyhjillaan-olevien-asuntojen-maara-kasvanut-merkittavasti-2000-luvulla-mista-tassa-on-kyse/
- Ratu KI-6033. (2018). Rakennushankkeen kustannustenhallinta. Talonrakennusteollisuus ry ja Rakennustietosäätiö. 117 s.
- Rosen, K. T., & Smith, L. B. (1983). The price-adjustment process for rental housing and the natural vacancy rate. The American Economic Review, 73(4), 779–786.
- Rowley, S., Leishman, C., Baker, E., Bentley, R., & Lester, L. (2017, August 2). Modelling housing need in Australia to 2025 (Australia) [text]. AHURI final report; Australian Housing and Urban Research Institute Limited. https://www.ahuri.edu.au/research/final-reports/287
- Ruud, M. E., Barlindhaug, R., & Nørve, S. (2013). Fremtidige boligbehov (2013:25; NIBR-Rapport). Norsk Institutt for by- og Regionforskning. https://explore.openaire.eu//search/publication?articleId=nora_uio__no::f14f0fb93703ed2aca21edce00d25308
- Saari, A. (1998). The viability of rehabilitated apartment buildings: A feasibility study method for building rehabilitation projects developed by action research. In Department of civil and environmental engineering, construction economics and management (doctoral dissertation) (p. 224). Helsinki University of Technology.
- Sandberg, N. H., Sartori, I., & Brattebø, H. (2014). Sensitivity analysis in long-term dynamic building stock modeling—Exploring the importance of uncertainty of input parameters in Norwegian segmented dwelling stock model. Energy and Buildings, 85, 136–144. https://doi.org/10.1016/j.enbuild.2014.09.028
- Sandberg, N., Sartori, I., Heidrich, O., Dawson, R., Dascalaki, E., Dimitriou, S., Vimmr, T., Fil-ippidou, F., Stegnar, G., Zavrl, M., & Brattebø, H. (2016). Dynamic building stock modelling: Application to 11 European countries to support the energy efficiency and retrofit ambitions of the EU. Energy and Buildings, 132, 26–38. https://doi.org/10.1016/j.enbuild.2016.05.100
- Sartori, I., Bergsdal, H., Müller, D. B., & Brattebø, H. (2008). Towards modelling of construction, renovation and demolition activities: Norway’s dwelling stock, 1900–2100. Building Research & Information, 36(5), 412–425. https://doi.org/10.1080/09613210802184312
- Sartori, I., Sandberg, N. H., & Brattebø, H. (2016). Dynamic building stock modelling: General algorithm and exemplification for Norway. Energy and Buildings, 132, 13–25. https://doi.org/10.1016/j.enbuild.2016.05.098
- Socialministeriet. (2006). Den almene boligsektors fremtid. Rapport fra arbejdsgruppen vedrørende fremtidsperspektiver for en mere selvbærende almen sektor.
- Swan, L. G., & Ugursal, V. I. (2009). Modeling of end-use energy consumption in the residential sector: A review of modeling techniques. Renewable and Sustainable Energy Reviews, 13(8), 1819–1835. https://doi.org/10.1016/j.rser.2008.09.033
- SWD/2022/375. Commission Staff Working Document. Analysis of the national long-term renovation strategies. Brussels, 30.11.2022.
- Tan, Y., Langston, C., Wu, M., & Ochoa, J. J. (2015). Grey forecasting of construction demand in Hong Kong over the next ten years. International Journal of Construction Management, 15(3), 219–228. https://doi.org/10.1080/15623599.2015.1066570
- Uihlein, A., & Eder, P. (2010). Policy options towards an energy efficient residential building stock in the EU-27. Energy and Buildings, 42(6), 791–798. https://doi.org/10.1016/j.enbuild.2009.11.016
- Vainio, T. (2020). Asuntotuotantotarve 2020-2040. VTT Technical Research Centre of Finland. https://doi.org/10.32040/2242-122X.2020.T377
- Wheaton, W. C. (1990). Vacancy, search, and prices in a housing market matching model. Journal of Political Economy, 98(6), 1270–1292. https://doi.org/10.1086/261734
- Yang, J., Deng, Z., Guo, S., & Chen, Y. (2023). Development of bottom-up model to estimate dynamic carbon emission for city-scale buildings. Applied Energy, 331, 120410. https://doi.org/10.1016/j.apenergy.2022.120410
- Yang, X., Hu, M., Tukker, A., Zhang, C., Huo, T., & Steubing, B. (2022). A bottom-up dynamic building stock model for residential energy transition: A case study for the Netherlands. Applied Energy, 306, 118060. https://doi.org/10.1016/j.apenergy.2021.118060
- Zhang, Y., Hu, S., Guo, F., Mastrucci, A., Zhang, S., Yang, Z., & Yan, D. (2022). Assessing the potential of decarbonizing China’s building construction by 2060 and synergy with industry sector. Journal of Cleaner Production, 359, 132086. https://doi.org/10.1016/j.jclepro.2022.132086