
Abstract
In recent years, increasing attention to the utilisation of Front-Of-Pack Labels (FOPLs) as a tool to prompt individuals towards healthier food choices has been observed both in regulatory bodies and academic research. However, few theoretical models have been used to understand their role in consumer decision-making, as well as the antecedents that induce individuals to accept the information provided by the label, and to benchmark FOPL performance in different markets.
Through a sequence of two studies conducted in Italy, France and the UK on 2812 primary grocery shoppers, we developed a new theoretical framework, the Front-Of-Pack Acceptance Model, applicable both in contexts in which FOPL are present, and in which they should be introduced. Our findings suggest a structural link between the usefulness and ease of use of the labels and the way consumers form their attitudes and intentions towards buying healthier products.
Introduction
The World Health Organisation (WHO) and other governmental bodies are dedicating more and more attention to the problems of obesity and overweight. They have been defined as forming ‘the epidemic of the twenty-first century’ and have grown to high proportions (World Health Organization Citation2000), with over 4 million people dying, both in the traditional perimeter of high-income countries and in the urban settings of low/middle income ones, directly as a consequence of such disease or indirectly of other chronic diseases and health complications.
Consequently, obesity and overweight have been widely addressed in recent academic literature across different fields, demonstrating the relevance of the topic from multiple angles. This subject has also been the focus of a broad series of initiatives from governments, institutions and the private sector; among others, in December 2020 the European Commission began an Impact Assessment aimed at involving citizens and stakeholders in the debate (EU Commission Citation2020). The document poses an accent on the importance of Front-of-Pack labelling (hereinafter, also indicated as FOP or FOPL) in the context of defeating this epidemic and activate a process to develop a proposal for a harmonised, mandatory FOPL, accompanying the ‘Farm-to-Fork’ strategy (Eu Commission Citation2020). The boundaries of the alternatives under analysis include a subset of FOPL in use or under development in the EU: the project adopts a taxonomy which clusters FOPL under the two major categories (EU Commission Citation2020; European Parliaments and the Council Citation2020). These are (a) ‘Nutrient-Specific Labels’ and (b) ‘Summary Labels’. The first category – ‘Nutrient-Specific Labels’ – is then segmented into: (a1) ‘Numerical FOP’, with those such as Reference Intake (RI) and NutrInform Battery (NI), and (a2) ‘Colour coded’, as Multiple Traffic Light (MTL). The second category – ‘Summary Labels’ – is divided into (b1) ‘Endorsement logos’, containing, for example, labels like Keyhole, health logos and Healthy Choices, and (b2) ‘Graded indicators’, with Nutri-Score.
FOPL categories are associated with different approaches to the same problem, educating customers to a healthier behaviour when purchasing food. One way to reach this goal could be guiding them towards the purchase of specific food units, regardless of the frequency and dosage of the specific food intake and consumer’s health status (‘Summary Labels’). Another option could be empowering them with appropriate, relevant and clear information (‘Nutrient-Specific labels’) that customers are able to combine to generate their personal-specific healthy diet.
Several studies (Ducrot et al. Citation2015a, Citation2015b; Fialon et al., Citation2020; Julia et al., Citation2015a, Citation2015b; Ares et al. Citation2018; Finkelstein et al. Citation2018; Andreeva et al. Citation2020; et al. 2020; De Temmerman et al. Citation2021; Dréano-Trécant et al. Citation2020; Egnell et al. Citation2018a, Citation2018b, Citation2019, Citation2020, Citation2021; Mazzù et al. Citation2020, Citation2021a) utilised the conceptual framework developed by Grunert and Wills (Citation2007), which articulates the process in different phases (search, exposure, perception, understanding and liking, and usage), leading however to non-univoque results in showing any greater effectiveness of one FOPL on another in all circumstances. In this perspective, the need for a new framework to understand the acceptance of FOPLs is a paramount. This paper aims then at contributing to the current discussion by identifying a conceptual framework that could analyse the decision-making process, integrating elements of attitude formation and purchase intention, while helping the discussion on how to solve the conceptual trade-off posed by previously widely used frameworks on subjective and objective understanding. To this end, we discuss a new acceptance model of FOPLs drawing on Davis’ TAM (Citation1989, Citation1993).
The article is organised in three sections. First, we introduce the core elements of the TAM-based theoretical model, identifying how it can be adapted to FOP decision making process, and establishing the scales to be used in the test. We then illustrate the research methodology to construct and validate the FOP Acceptance Model (FOPAM) conceptual framework, showing statistical analyses and the main results. Finally, we discuss the main implications, highlighting the limitations of our work and hypothesising new research avenues.
Conceptual framework and extant literature
A widely utilised conceptual framework in extant research is the one developed by Grunert and Wills (Citation2007), which differentiates the phase of understanding in two different streams: subjective and objective. Objective understanding refers to responding to an information stimulus in a way that agrees with the meaning intended by the sender. Subjective understanding, on the other hand, is the lens through which consumers look at the information; they analyse the label and create a meaning and generate a belief in themselves about the level of understanding they have about the communication. This serves as the basis of their opinion, and merges into an informed decision. The outcome is that no uniform trait of ‘superiority’ exists of one label over the others along all variables (Mazzù et al. Citation2021b) with ‘summary labels’ registering the highest performance on ‘objective understanding’ (Ducrot et al. Citation2015a, Citation2015b; Julia and Hercberg Citation2017; Talati et al. Citation2019a; Andreeva et al. Citation2020; Egnell et al. Citation2018a, Citation2018b, Citation2019, Citation2020; Galan et al. Citation2020) and ‘Nutrient-Specific labels’ on ‘subjective understanding’. The reason behind these differences in performance might be that the first kind of label fits more with the concept of directing customers to attaching a ‘more healthy’ versus ‘less healthy’ meaning to a food-unit. The second one, on the other hand, can be seen to empower customers to utilising ‘data-driven’ information, for their best use, according to varying consumption situations and occasions at single customer level (Mazzù et al. Citation2021a, Citation2021b). The differentiation, and complementarity, among objective and subjective understanding raises the need to identify a theoretical model which can either evaluate the trade-offs between subjective and objective understanding or replace it with a different perspective and a new set of measurements. While direct or indirect effects on the ability to distinguish healthy versus non-healthy foods on purchase intention and choice have been widely covered (Ducrot et al. Citation2016; Talati et al. Citation2017), the real impact and effectiveness of FOPLs’ utilisation at retail level still seems under scrutiny, highlighting unclear evidences relative to behaviour change (Crockett Citation2018) and inconsistent results for consumption, while in any case encouraging healthier food purchase (Croker et al. Citation2020). More in general, the effects of FOPLs were mostly driven by one specific category, with high variance in nutrition quality, being more insensitive in categories, in which foods do not differ as much in terms of nutrition quality (Dubois et al. Citation2021).
In the current context of informed customers (Grunert and Wills Citation2007), a relevant part of the choice happens at store level (Sobal and Bisogni Citation2009; Jacquier et al. Citation2012). In general, food purchase can be seen as a complex action, also thanks to complicate and over-informative nutrition labels (Grunert and Wills Citation2007), where the attitude and the intention-to-buy of the product mix different search, experience, credence elements (Caswell and Padberg Citation1992). Food labels might then play a fundamental role to complete the process before purchase (Caswell and Padberg Citation1992), helping customers in his/her final decision. FOPL can then be seen as a Decision Support System (DSS) available to customers when making a Food Purchase. DSS are defined as any system that makes a contribution to support a decision (Sprague Citation1980). A relevant stream of extant research in the field of technology and innovation has been focussing on user acceptance of technology, deep-diving customers’ relationship with system usage (Igbaria Citation1994; Szajna Citation1996; Igbaria and Tan Citation1997) and the perception of how a system can improve own performance on some specific ends (Mun et al. Citation2006; Ahearne et al. 2013). Among others (Leonard-Barton and Deschamps Citation1988; Compeau and Higgins Citation1995b; Goodhue Citation1995; Goodhue and Thompson Citation1999), emerges the technology acceptance model (TAM) (Davis Citation1989, Citation1993; Davis and Venkatesh Citation2004). It leverages the principles from Theory of Reasoned Action and Attitude Formation paradigms (Fishbein and Ajzen Citation1975), putting in causal relation the design features of a system with its ‘perceived usefulness’ (PU) and ‘perceived ease of use’ (PEOU), as antecedents to customers’ attitude towards using the system, purchase/usage intention, and especially to the dependent variable of usage behaviour (Davis Citation1993), all done employing statistically estimated weights and not self-stated weights. In the framework, Perceived usefulness is defined as ‘the degree to which an individual believes that using a particular system would enhance his or her job performance’ (Davis Citation1989, Citation1993); Perceived ease of use is ‘the degree to which an individual believes that using a particular system would be free of physical and mental effort’ (Davis Citation1989, Citation1993). Finally, the attitude towards using the system is ‘the degree of evaluative affect that an individual associates with using the target system in his or her job performance’ (Davis Citation1993). The element of PU can be seen as having the strongest effect on the dependent variable. It also has a significant mediating effect on attitude, while PEOU has a direct effect on it. (Davis Citation1993; King and He Citation2006). PEOU operates almost entirely indirectly through perceived usefulness, in its impact on behavioural intention (BI) and usage. The basic framework of the TAM has evolved overtime, exploring additional mediating and moderating variables as, among other, subjective norms (Schepers and Wetzels Citation2007), voluntary versus forced use (Dulcic et al. Citation2012). The model has progressively been extended upon and made more sophisticated, by introducing social influence with TAM 2 (Venkatesh and Davis Citation2000). It has then converged into a Unified Theory of User Acceptance and Use of Technology (UTAUT), where the antecedents to BI and to the dependent variable of user behaviour are performance expectancy, effort expectancy, social influence, facilitating conditions, with age, gender, experience and voluntariness of use as moderating factors (Venkatesh et al. Citation2003). TAM 3 (Venkatesh and Bala Citation2008), has added pre- and post-interventions, while UTAUT 2 (Venkatesh et al. Citation2012), incorporates three additional constructs versus UTAUT 1 – hedonic motivation, price value and habits – improving the variance explained in BI (Chang et al. Citation2012). A meta-analysis (King and He Citation2006) on 88 studies on TAM showed a relevant increase of attention and four streams of evolution: (a) including other antecedents such as prior usage or experience (Venkatesh and Morris Citation2000; Oh et al. Citation2003), self-efficacy (Venkatesh and Davis Citation1996) or user involvement (Jackson et al. Citation1997); (b) factors that improve TAM’s predictive power e.g. subjective norms (Hardgrave and Johnson Citation2003), expectations (Venkatesh et al. Citation2003), integrating task-technology fit model (Dishaw and Strong Citation1999), measures of ‘negative utility’, potential losses and risk factors (Featherman and Pavlou Citation2003) including the trust variable on (Gefen Citation2004; Pavlou and Gefen Citation2004) dividing between recurrent and prospect customers (Gefen and Straub Citation2004); (c) including moderating and contextual factors as gender, Hofstede’s cultural factors (Huang et al. Citation2003), perceived characteristics of innovating (Plouffe Citation2001); (d) consequence measures consequence measures such as attitude (Davis Citation1989), perceptual and self-report use versus actual use (Horton et al. Citation2001), intrinsic motivation factors as playfulness (Moon and Kim Citation2001), and actual use (Szajna Citation1996; Davis and Venkatesh Citation2004).
In terms of broader applications, a large amount of researchers worked on TAM, either modifying it, extending it, or applying in a different context (Marangunić and Granić Citation2015). In a meta-analysis, it has been clarified that ‘the parsimony of the TAM combined with its predictive power make it easy to apply to different situation’ (Venkatesh Citation2000). The TAM has then already been widely utilised in contexts beyond technology, such as acceptance of new policies (Pierce et al. Citation2014), certification of non-profit organisations (Slatten Citation2012), adoption of tax schemes (Wu and Chen Citation2005), food traceability (Kim and Woo Citation2016) online food purchasing (Nguyen et al. Citation2019). TAM has also been applied in the Fashion industry, with specific aim to understand how consumers perceive and use sustainability labels in a similar way to the utilisation of new informational sources for their decision making (Caswell and Padberg Citation1992; Ma et al. Citation2017). In this context, far from the FOPL solipsism, it is relevant to understand whether FOPLs are useful and easy to use systems considered by consumers when buying their products able to increase food healthier choices.
Research objectives
This paper aims at contributing to the extant literature by introducing the ‘Front-of-Pack Acceptance Model’ (FOPAM), a new theoretical model derived from TAM and applied to Food Purchase decision making and healthy dietary requirements. The framework aims at modelling consumers’ trade-offs in comprehension and decision-making, in FOPL-mediated contexts. The validity of the FOPAM model is tested on three labels: the Italian NutrInform Battery, the Multiple-Traffic-Light and Nutri-Score. A series of two sub-sequential and inter-linked studies have been conducted with a preliminary phase of scale development, in order to first develop valid scales and constructs relevant to food info-processing, and then to assess labels through a structural model for food decision-making.
In line with the methodological approach developed by Davis (Citation1989), the preliminary phase aimed at defining the set of items that will form appropriate scales and the reliability of all items, and checked for the validity of scales. Then, studies 1 and 2 defined the basic FOPAM, in different environments of FOPL presence in the market, while exploring the robustness of the findings showcased preliminarily using the scales in a greater sample of primary grocery shopper and evaluating the validity and the fit of the TAM theoretical model (Davis Citation1993) applied to food-shopping contexts.
In our empirical tests, measurements have been carried out through online experiments on 2812 purchase responsibles.
Methods and materials
Stimuli
In the sequence of studies, we selected the combination of field-country/FOPL-stimulus that best fulfilled the following three elements: (a) ‘tenure’ of FOPL presence in the market in order to enhance the likelihood that consumers were already exposed to the label and knowledgeable on how to use it, (b) labels underlying different approaches according to the EU taxonomy, and (c) the relevance of the specific FOP in extant academic literature.
Accordingly, we selected the MTL, representative of the UK market, (2) the French Nutri-Score, for all studies and (3) the Italian NutrInform Battery (for the preliminary phase and the study 2).
MTL and Nutri-Score are two FOPLs that already have a history of usage in their respective countries: MTL has been introduced in UK in 2013, while Nutri-Score in France in 2017. This enhances the likelihood that French and English consumers were already aware and exposed to the label. Furthermore, according to extant definition of the EU Commission (Citation2020), the Nutri-Score belongs to Summary labels while MTL to Nutrient-Specific labels, thus corresponding to two different poles of the actual classification. Also, the Nutri-Score and MTL have been analysed in several studies which confirmed their effectiveness in supporting the consumers’ decision-making process (Ares et al. Citation2018; Egnell et al. Citation2018a, Citation2018b; Finkelstein et al. Citation2018; Talati et al. Citation2019b; Dréano-Trécant et al. Citation2020). Moreover, Nutri-Score is currently among the most adopted labels in Europe, as it is presently applied in France, Belgium and Germany and intended to be adopted also in Netherlands, Spain and Luxembourg (European Parliaments and the Council Citation2020).
In addition, in the preliminary phase and in study 2, we tested the proposed FOPAM in a country where no FOP labelling systems has been previously adopted, adding the NutrInform Battery, a new non-directive label that still has few evidences from studies performed in EU countries.
Study population and data collection
Study population has been composed by 349 respondents recruited in two preliminary studies, 1523 for study 1 and 940 for study 2, for a cumulative number of 2812 consumers for the research ().
Specifically, the preliminary phase was formed by a convenience sample of 61 Italian MBA students for the early stage, rewarded with extra-points on their final grade, and a subsequent sample of 150 French and 138 UK respondents for the advanced confirmatory phase. We selected a convenience sample of Italian MBA students in the introductory phase to assess the main associations deriving from PU and PEOU, while isolating other external effects deriving from previous exposures to the labels. Since the main objective of this step was the definition of the real meanings associated to the items, previous exposures to FOPL could have had a moderation impact on the overall assessment of the items. Conversely, in the subsequent phase, whereby the main objective was the understanding of the main associations of PU and PEOU when applied to FOPL, we selected a French and UK sample, where FOPL are already present in the respective markets. To this end, we confirmed the validity of both constructs when applied to FOPL in two countries where FOPL are widely used.
In study 1, two large samples of 820 primary grocery shoppers in the UK and 703 purchase responsible in France have been collected. Respondents have been filtered according to their role in purchases. Primary grocery shoppers were included regardless of the traditional gender roles within the household, as highlighted by several authors (Bhatti and Srivastava Citation2003; Richbell and Kite Citation2007). According to the recent paradigm shift in purchases, the presence of both male, female and non-binary shoppers is on the rise irrespective to the traditional perspectives (Otnes and McGrath Citation2001; Richbell and Kite Citation2007). The filter also ensured a higher confidence that the interactions are associated with purchase-related tasks (Shim et al. Citation1999) and to a common and accessible system – when introduced in the reference country – such as a FOPL. Those who were not responsible for purchases were withdrawn from the study. It resulted in 800 participants in UK and 673 in France.
In study 2, we collected a sample of 940 Italian Primary Grocery Shopper divided into three subgroups: (1) a group exposed to the NutrInform Battery (n = 319), (2) 318 individuals of the sample which were asked to evaluate MTL, and (3) one to Nutri-Score (n = 303).
All responses were collected through Prolific, a recently established international web panel provider, which combines high recruitment standards and proper response rate with reliability and high replicability of studies (Palan and Schitter Citation2018). Each questionnaire was also translated by mother-tongue professionals in each country’s language, in order to reduce errors during the measurement.
The sample size for both studies 1 and 2 has been computed in accordance with Kline (Citation2015), who defined the required ratio to estimate a parameter as equal to 20 (observations):1(parameter) or at least 10:1. Accordingly, with 32 parameters, 16 residuals and 17 for the estimation of the latent variables, we defined a minimum of 640 respondents per manipulation in study 1 and 320 in study 2, according to the ratio 10:1 since three manipulations have been tested. In the first study, we increased the required number to at least 800 to account for the removal of potential non-primary grocery shoppers respondents.
Research design
In the early stage of the preliminary phase, to ensure a full comprehension and exposure to FOPLs in advance to the study, we lectured the 61 Italian students in three different sessions with labels’ relevant concepts, the state-of-the-art and FOPL-specific characteristics. In the first session, we explained the role/relevance of FOPLs, their purposes and functions, according to institutional definitions provided by the European Commission (Citation2020), the Italian Economic Development Ministry (Citation2021), the UK Health Minister (Citation2019) and the French Health Ministry (Citation2021). The second session was carried out 15 days later, to reinforce the understanding of the concept and to ensure that respondents fully understood all the information and were primed with FOPL usage concepts. In the last session, before administering the survey, three introductory pages about FOP were provided. Participants were then tasked with composing a healthy meal by considering information derived from a set of FOPLs applied to specific products. Specifically, respondents were asked to simulate an online food selection using FOPLs, on a base of five product categories, that would be served to them and their family, for a brunch. Each product category was composed of a conventional product (the first one mentioned in the following list) and a ‘light’ version (the second one mentioned) of the same product, for a total of 10 food products: sauces (tomato and ricotta and tomato and basil), yogurt (fruit yogurt and zero fat fruit yogurt), crackers (classic and corn), biscuits (classic and without sugar) and processed meat (salami and cooked ham). The rationale for the inclusion of two different alternatives in each product category was related to the difference in product composition, and consequently in its representation in terms of FOPLs. These two different representations allowed consumers to better understand how each type of FOPL work.
Those who did not use FOPLs to compose the basket were removed from the study. This resulted in 47 participants, who run two subsequent tasks, i.e. prioritisation and categorisation of items related to PEOU and PU. Prioritisation task has the objective to rank items according to how well the meaning of each statement matches the given definition of items (Sherif and Sherif Citation1967), with specific PEOU and PU (Davis Citation1989). For the prioritisation task, respondents were primed with the definition of PEOU and PU, and were then asked to rank items from most relevant to less relevant in accordance with the given meaning of PEOU and PU. The categorisation task has the objective to allocate items into clusters so that the statements within a category were, in their subjective and personal view, most similar in meaning to each other, and dissimilar to those in other clusters (Sherif and Sherif Citation1967; Davis Citation1989). The same respondents were asked to create between 3 and 5 clusters utilising PU and PEUO items, combining the most homogeneous and dividing the most dissimilar, without being provided with cluster labels. This generated a categorisation that mirrors spontaneous associations in respondents’ mind (Davis Citation1989). All respondents had 30 min to complete the survey.
Consequently, in the advanced stage of the preliminary phase, we tested the prioritised and clustered items obtained from the previous step, according to the two French and UK consumer categories already exposed to Nutri-Score and MTL. This allowed to verify whether different ratings associated to the constructs are highlighted according to existing FOPLs.
As in the previous step, to ensure subject familiarity with the FOP being rated, we asked again whether they ever used the FOP. Those who answered had lower than daily/weekly the FOP in their purchase were exposed to an additional task concerning the creation of a personal basket while using the information reported on FOP. Afterwards, participants who did not use FOPLs to accomplish the task were removed from the study. Similarly, FOPLs low-frequency users where exposed to the same task and then asked whether they used the FOP to compose their basket, if not they were removed from the study. Heavy users of FOPLs and those who passed the test were exposed to the assessment of items obtained in the previous stage. Items of ease of use and usefulness were evaluated by respondents after being exposed to Nutri-Score and MTL. Respondents were asked to rate the extent to which they agree with each statement through a 7-point Likert scale (from ‘Strongly Disagree’ to ‘Strongly Agree’).
In the study 1, respondents were asked to assess items resulted from the preliminary phase according to Nutri-Score and MTL. In each country, respondents were exposed to their own label, namely the Nutri-Score in France and MTL in UK. The two labels were not associated to any mock product as in previous studies (Arrúa et al. Citation2017; Ares et al. Citation2018a; Egnell et al. Citation2018b; Mazzù et al. Citation2020). Consequently, PU, PEOU, attitude towards the using (ATT) and BI items were assessed to the test validity in food-mediated context of acceptance models.
Conversely, in the study 2, we assessed the validity of the FOPAM in Italy, a country where no FOP labelling systems has been adopted. Accordingly, we tested the acceptance of three different labels, the NutrInform Battery, a Nutrient-Specific Numerical Label, the MTL, a Nutrient-Specific Colour-coded Label and the Nutri-Score, while assessing the effectiveness of PEOU, PU and attitude as explanatory variables of consumers’ intentions. After reading the descriptions of the three labels derived from the respective institutional websites, NutrInform Battery (Italian Economic Development Ministry Citation2021), Nutri-Score (French Health Ministry Citation2021) and MTL (UK Health Minister Citation2019), participants were asked to answer to the set of items deriving from the preliminary phase but, in contraposition to study 1, this happened in a country without previous exposure to FOPLs.
Statistical analysis
In the first part of the preliminary study, a Python script was employed to obtain pairwise combinations of the individual answers present in the same cluster, valorising the relevance of spontaneous association in each participants’ mind, without constraints of pre-defined labelling. Response clusters containing only one item n are outputted as n n and translated to network loops. We created combinations, as the ‘is related to’ relationship is bijective. The resulting .csv file was loaded into Gephi – a software for network visualisation and analysis (Bastian et al. Citation2009) to represent this information with a graph. Based on the weighted edge summary exported by Gephi, and the pairwise response combinations made in Python, a weighted-edges graph has been created by using R and R-studio (R Core Team Citation2017) . In order to determine clusters, the modularity measure is employed. Modularity quantifies how many edges lie within groups in our network relative to the number of such edges expected on the basis of chance, and ranges from [−1/2,1]. A good division of nodes into communities is one that maximises such a measure. Once the dendrograms have been generated, it has to be cut at a height to generate communities (Langfelder and Horvath Citation2008). Traditionally, this cut is performed at the highest branches, in order to obtain the most representative clusters (Forina et al. Citation2002). We thus cut dendrogram at the same height to obtain the same number of clusters for both constructs. Consequently, all items in the clusters were prioritised according to a scoring model which considered the times an item has been ranked in a position and normalised for the number of responses. Items were then ranked based on the normalised score.
In the second part of the preliminary study, we followed three steps to define a limited set of valid and reliable scales based on a response set of consumers already exposed to FOPLs. At the beginning, (1) we tested for scale reliability, then (2), for the reliable items from step 1, we proceeded to explore, through a principal component analysis (PCA), the main components/factors they belong to, and (3) we concluded with a confirmatory factor analysis (CFA) to define the validity of each construct and of the scales utilised to measure. Negative worded items were reversed in order to avoid measurement errors and potential issues in defining scales’ reliability and validity. Specifically, in step 1, we proceeded by measuring through Cronbach’s alpha (Cronbach Citation1951) the overall reliability of the PU and PEOU scales for the two countries separately. Alpha is used to test the internal consistency of a scale, which describes the extent to which all the items in a scale measure the same concept or construct, and, hence, it is connected to the inter-relatedness of the items within the test. Afterwards, in step 2, we run a sequence of analyses, starting from the factorial validity of each scale, to check whether the PU and PEOU items form distinct constructs. A PCA using varimax rotation was performed on the entire set of PU and PEOU items. In a subsequent stage, a PCA has been carried out to find existing sub-dimensions involving the items of PU and PEOU. PCA in multivariate data analysis is used to reduce the number of dimensions, while retaining as much of the data variation as possible. Instead of investigating thousands of original variables, the first few components containing the majority of the data's variation are explored (Bro and Smilde Citation2014). In exploratory factor analyses, where more than one factor is extracted, rotation seeking ‘simple structure’ (i.e. maximising the correlation between each of the original variables and one of the latent variables) is commonly deployed (Johnston Citation2014). At the end of the study, in step 3, a CFA was performed to further assess the discriminant and convergent validity of both constructs, while controlling for their effects. CFA is used to test a hypothesis, inquiring whether an expected pattern corresponds to a predetermined simple structure (Johnston Citation2014). Convergent validity refers to the extent to which the same trait is measured by different items, whereas discriminant validity is defined as the extent to which traits are distinct (Carmines and Zeller Citation1979). It helps to identify items able to measure the considered variable and to discriminate with others.
In study 1, we repeated the reliability and validity tests of the constructs, through Cronbach’s alpha and a CFA. Consequently, a structural equation model with the four-latent variables PEOU, PU, ATT has been created. Structural equation modelling (SEM) allows to analyse multivariate data and resulted to be appropriate for theory testing. This embeds observed variables and latent construct allowing to test the associated validity and the hypothesised relationships among them (Bagozzi Citation1980). The test model was specified on the basis of the research model (Davis Citation1993) assuming relationships among PU, PEOU, attitude and BI as latent variables. We then evaluated the fit of the structural model.
In study 2, an initial confirmatory factor analysis allowed us to repeat the assessment of the validity of items in this new study as well, and then we proceeded to evaluate the indices of the goodness of fit of the structural model. At the end of our study, a multi-group analysis has been carried out to evaluate the invariance across the three groups exposed to the three different labels.
All data obtained from participants has been analysed using IBM SPSS Statistics (version 26, SPSS Inc., Chicago, IL) for reliability tests, and IBM SPSS AMOS (version 26) for the confirmatory factor analysis and structural equation models.
Table 1. Sample size and characteristics per study.
Table 2. Set of items deriving from the early stage of the preliminary phase.
Constructs and measures
An initial set of items was selected using the scales adopted in five studies regarding technology (Davis Citation1989, Citation1993; Venkatesh et al. Citation2003) and food (Kim and Woo Citation2016; Ma et al. Citation2017). Twenty-five items for PU and 21 items for PEOU were worded in reference to the specific application of accomplishing food shopping in FOP mediated settings. Similarly, three items were selected for ‘Attitude toward using the label’ and four for ‘Behavioural Intention’. Once the items were defined, we found many overlaps and redundancies due to their associations with the same construct or adaption from Davis’ study (Citation1989). We deduplicated extant items obtaining 18 for PU and 15 for PEOU. Subsequently, mirroring Davis’s approach (Citation1989), we asked to the 61 Italian MBA students, rewarded with extra-points on their final grade, to prioritise and categorise the entire set of deduplicated items. Afterwards, two confirmatory questions were asked to assess the usage of the FOP during the task: (1) ‘Did you utilize the Front-of-pack labels to compose your brunch basket?’; (2) ‘Was the usage of a Front-of-pack labels useful to decide which product to choose?’. Those who did not use FOPLs to compose the basket were removed from the study. This resulted in 47 participants who run two subsequent tasks, i.e. prioritisation and categorisation of items related to PEOU and PU. The results of prioritisation and categorisation tasks were utilised in a sequential and combined way to derive items to be tested in the following study. As a result, we obtained three main clusters for both scales, as shown in , with PU comprising 14 items and PEOU 12 items.
Table 2a. Convergent validity of the reduced set of items.
Table 2b. Discriminant validity of the reduced set of items.
Table 2c. Final set of items in Study 2.
In addition, four items for PU and three for PEOU were removed because they were not strongly associated to other items and were not relevant for respondents in the prioritisation task. Contrarily, the item ‘Food purchase would be difficult to perform without food FOP’ has been maintained according to its higher score in the prioritisation task.
Such scales were then confirmed in a subsequent field of two samples of primary grocery shoppers recruited in France and UK, and asked to rate the items of ease of use and usefulness, obtained in the previous phase, after being exposed respectively to Nutri-Score and MTL. The response set allowed to further assess the reliability, convergent, discriminant and factorial validity of both items and scales through the assessment of Cronbach’s alpha and a subsequent exploratory (EFA) and CFA. According to the results of the analysis, we removed invalid items for PUFootnote1 and PEOU which did not achieve the minimum cut-off of reliability and factorial validity (Fornell and Larcker Citation1981). Consequently, drawing on items deriving from the previous phase, we worked on the scales of PU and PEOU with a sequence of tests which allowed to reach higher and construct validity. Considering these results, a defined set of four items for PU and three for PEOU have been achieved and introduced in studies 1 and 2.
Results
Study 1
The aim of study 1 was twofold: (1) validate the effectiveness of the scales tested in the preliminary phase in a larger sample exposed to FOPLs, confirming that PU and PEOU are prominent constructs to form attitudes and BI also in FOP-mediated contexts, and (2) develop and introduce the FOPAM (), adapting TAM to food contexts. We developed a theoretical model specific for Food contexts involving FOPLs. As defined in the literature review, FOPLs are intended as non-technology media able to inform consumers and support decisions. More in general, TAM has been applied to labels to test both (a) the acceptance of information systems (Garaus et al. Citation2016; Kim and Woo Citation2016; Han et al. Citation2020), linked to technology media, and (b) the acceptance of labels as a communication system, linked to non-technology media; thus, TAM could be applied to labels to test the label both as it can be seen both as technology and non-technology, e.g. a communication system. Furthermore, FOP can be viewed as DSS.
The CFA suggested a high model fit in both UK and France samples. Specifically, in UK results highlighted a: χ2 = 229.651, p = 0.000; GFI = 0.953; CFI = 0.981; NFI = 0.977; SRMR = 0.028; RMSEA = 0.069 (Hu and Bentler Citation1999), while in France: χ2 = 130.197, p = 0.000; GFI = 0.969; CFI = 0.989; NFI = 0.982; SRMR = 0.0214; RMSEA = 0.051. As shown in , all items are reliable and valid for both samples. All factor loadings exceeding the suggested cut-off of 0.70 (Fornell and Larcker Citation1981). Similarly, the convergent validity suggests that all loadings are measuring the construct properly (λ > 0.70 and SMC > 0.50) whilst, as suggested in the discriminant validity (average variance extracted > squared multiple correlations), are distinctive among them.
Table 3a. Model assessment – convergent validity.
Table 3b. Model assessment – discriminant validity.
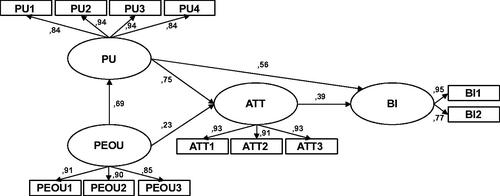
Similarly, the fit of the structural model was good: χ2 = 308.673, p = 0.000; GFI = 0.937; CFI = 0.973; NFI = 0.969; SRMR = 0.0623; RMSEA = 0.080 (Hu and Bentler Citation1999). Afterwards, we proceeded by examining the relationships among latent constructs and their significance. Specifically, we found that all relationships were significant. In accordance with Davis (Citation1989), PEOU significantly predicted PU (β = 0.689, p < 0.001) and attitude towards usage (β = 0.230, p < 0.001). PU significantly affects attitude towards usage (β = 0.746, p < 0.001) which in turn affects BI (β = 0.386, p < 0.001). Furthermore, attitude significantly mediates the relationship between PU and BI (β = 0.287, p < 0.001) which resulted in a partial mediation considering the significance of PU as a predictor of BI (β = 0.560, p < 0.001).
Figure 1. Basic FOPAM model.
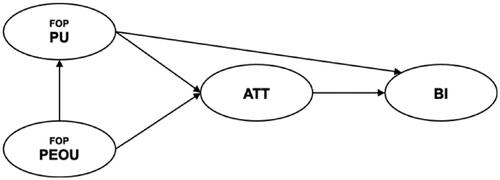
In this case, the direct effect is greater than the indirect effect. Comparable results were obtained with the French sample. The tested model reports a higher fit with the sample data, resulting in acceptable levels for all relevant indicators. χ2 = 137.312, p = 0.000; GFI = 0.968; CFI = 0.988; NFI = 0.981; SRMR = 0.0623; RMSEA = 0.0234 (Hu and Benter 1998). All relationships, as in the previous model, are statistically significant. PEOU positively affects PU (β = 0.522, p < 0.001). Whilst attitude towards the usage is significantly predicted by PU (β = 0.653, p < 0.001) and PEOU (β = 0.305, p < 0.001). Also, attitude significantly predicts BI (β = 0.396, p < 0.001) which is directly affected by PU (β = 0.564, p < 0.001). Furthermore, attitude is a relevant mediator of the relationship between PU and BI (β = 0.259, UL = 0.625 LL = 0.188, p < 0.001) indicating a partial mediation considering that the direct effect is greater than the indirect effect. All the above result in a validated basic FOPAM model, which connects PU and PEOU to attitude formation and BI ().
Figure 2. Structural model – basic FOPAM.
Study 2
The CFA, in line with previous studies, showed an acceptable fit of the sample data to the model and a high reliability and validity of the constructs. It indicates that the measurements are discriminating properly among themselves and converge within the assumed construct. For the NutrInform Battery’s group, the CFA reported a: χ2 = 109.207, p = 0.000; GFI = 0.945; CFI = 0.985; NFI = 0.974 SRMR = 0.0260; RMSEA = 0.063. All items showed a high level of reliability and validity with factor loadings exceeding the suggested cut-off of 0.70 (Fornell and Larcker Citation1981). As regards the MTL-related model, the CFA reported an χ2 = 102.822, p = 0.000; GFI = 0.951; CFI = 0.988; NFI = 0.977; SRMR = 0.0210; RMSEA = 0.060 suggesting a high-acceptable fit (Hu and Bentler Citation1999). Concerning the subgroup exposed to Nutri-Score, the results obtained are χ2 = 151.077, p = 0.000; GFI = 0.923 CFI = 0.977; NFI = 0.966; SRMR = 0.0220; RMSEA = 0.084 which suggest an acceptable fit of the model to the sample data (Hu and Bentler Citation1999). Convergent validity suggests that all loadings are measuring the construct properly (λ > 0.70 and SMC > 0.50) whilst, as per the discriminant validity, are distinctive among them, as average variance extracted (AVE) is higher than squared multiple correlations (SMC) ().
Table 4a. Model assessment – convergent validity.
Table 4b. Model assessment – discriminant validity.
The test of the structural model based on the subgroup exposed to NutrInform Battery showed the following results: χ2 = 111.021, p = 0.000; GFI = 0.944; CFI = 0.985; NFI = 0.973; SRMR = 0.0271; RMSEA = 0.063. As in the previous studies, PEOU significantly predicts PU (β = 0.723, p < 0.001) and attitude (β = 0.287, p < 0.001) which in turn positively affects BI (β = 0.547, p < 0.001). BI is also predicted by PU (β = 0.363, p < 0.001).
As regards the MTL subgroup, the structural model specified on the basis of the proposed research model in study 4 showed all acceptable indices: χ2 = 105.042, p = 0.000; GFI = 0.949; CFI = 0.987; NFI = 0.976; SRMR = 0.0226; RMSEA = 0.060 (Fornell and Larcker Citation1981) indicating a high fit with the sample variance–covariance matrix. Subsequently, we found all relationships to be significant. PEOU significantly predicts PU (β = 0.697, p < 0.001) and attitude towards using FOP (β = 0.324, p < 0.001). Similarly, PU significantly affects attitude towards using FOP (β = 0.624, p < 0.001) which in turn affects BI (β = 0.267, p < 0.01). Also, a positive effect of PU towards BI (β = 0.267, p < 0.001) has been found.
Similarly, results obtained for the subgroup exposed to Nutri-Score highlighted all acceptable indicators, as follows: χ2 = 150.903, p = 0.000; GFI = 0.923; CFI = 0.977; NFI = 0.966; SRMR = 0.0225; RMSEA = 0.083. Afterwards, relationships among latent variables have been assessed. PEOU is a significant explanatory variable of PU (β = 0.650, p < 0.001) and attitude (β = 0.184, p < 0.001). In turn, usefulness positively affects attitude (β = 0.770, p < 0.001) and BI (β = 0.291, p < 0.001). Also, in line with the previous subgroup, attitude is a relevant antecedent of BI (β = 0.675, p < 0.001).
Measurement invariance
The results for measurement invariances across the three FOPLs are highlighted in . The invariance test showed that the configural invariance model across FOPs demonstrated acceptable model fit. In the configural model, all parameters are estimated for the calibration and validation groups simultaneously; that is, no parameters are constrained equally across groups (Byrne Citation2013), i.e. all parameters are freely estimated without imposing any constraints. This multigroup model yielded a χ2 value of 474.073 with 210 degrees of freedom and serves as the baseline referent against which all subsequent models are compared. In the second model tested (measurement weights), all the factor loadings of the indicator variables were constrained equal across groups, hypothesising no variance in the way constructs are formed. In the following models (structural weights, covariances and residuals) all beta, covariances and residuals were constrained equal across groups, hypothesising no variance in the way relationships between constructs are formed. Observing the fact that the ΔCFI across all models never exceeded the cut-off of 0.01, according to Cheung and Rensvold (Citation2002), we conclude that the model is completely and totally invariant across the three groups. In summary, this conclusion advises that all factor loadings, structural paths, factor covariances, factor residual variances, and measurement error variances are operating equivalently across calibration and validation samples.
Table 5. Model comparisons.
General discussion
The sequence of our studies aimed at contributing to the FOPL debate with a new approach focussing on consumer acceptance of labelling systems and their usefulness and ease of use in directing towards healthier choices. In this vein, we evolved a model previously tested on technology artefacts and non-technology media. However, several authors posited the relevance of labelling systems in influencing consumers in their purchases, both at point-of-sales level and other contexts, highlighting a series of information about the micronutrients, classifiable as credence attributes of products difficult to evaluate even after their consumption. Accordingly, labelling systems play a prominent role in informing the consumer decision-making process, while enriching the existing information base of buyers. Such perspectives involve the need to clearly understand not only what kind of FOPL is more informative, but also which FOPs overthrow acceptance barriers and guide consumers towards a real usage aimed at promoting healthier behaviours.
The FOPAM would contribute to the current debate by proposing an alternative and complementary framework to the previously widely used ones, such as the one from Grunert and Wills on subjective and objective understanding. Existing models have been instrumental to activate the discussion at EU level, and to highlight the ranking of FOPL in supporting different types of objectives towards healthier food choices; however, these models do not provide an incontrovertible position to support policy-making decisions.
The model clarifies that usefulness and ease of use of FOPLs might be relevant predictors in food shopping when respondents should form their attitudes and intentions towards the product that must be purchased. While we focussed on the validity of constructs and their relationships in FOPL-mediated contexts, further research could explore different outcomes – for example, whether the proposed model is still valid in other countries not yet exposed to FOPLs. In the study 2, the model has been tested in a country where no labels have been adopted, confirming the robustness of the model in the context of food labels. The evidences suggest positive BIs demonstrated by consumers when FOPLs are perceived as useful and easy to use. Such results indicate a general approach through which individuals form their intention towards food purchases, regardless of the label to whom they were exposed. However, a subsequent comparison between the variance of the three subgroups (exposed to MTL, NS and NI) did not show significant differences among terms, factor loadings, residuals, the magnitude of the effects and covariances. This indicates a model founded on a set of items able to discriminate among them and respectively converge within constructs and able to describe significant relationships which lead individuals to form their intention, regardless the FOPL viewed. The model is thus valid irrespective of the FOP utilised. Furthermore, other researchers could deeply explore whether the mediating role of Trust towards the label is effective also in settings where FOPLs are algorithm-based: previous studies demonstrated that trust formation could be mitigated according to the task that must be accomplished. For example, the diagnosis of an illness is preferred when carried out by a medical doctor rather than an algorithm. Similarly, in contexts where consumers should use FOPLs to increase the likelihood of building healthy diets, the trust towards the algorithmic-based FOP could reduce their effectiveness in promoting healthy consumption. In addition, it is more and more important to consider the fact that some customers object to relevant algorithms while adopting others, as a function of their understanding of moral trade-offs (Dietvorst and Bartels Citation2020). Thus, further studies could both focus on the role of trust towards algorithmic-based FOP and the differences that result when various labels are compared. Additionally, it might also be interesting to test whether relevant differences in terms of usefulness, ease of use occur when comparing different FOPLs. From another perspective, scholars could assess the role of typical past TAM moderators such as the actual use versus perceptual use or the level of experience of the users (Venkatesh Citation2000; King and He Citation2006), the type of users and type of usage (King and He Citation2006).
Conclusion
In sum, we have provided initial evidence suggesting that the effectiveness of FOPLs in affecting attitudes and BIs towards food purchase is predicted by their usefulness and ease of use. This implies that labelling systems support buying decisions and contribute to the definition of healthier choices when they are perceived as useful and easy to use. Evidences are aligned both for interpretative and summary labels, without taking into consideration the magnitude of the effects for the two categories and for countries with different degree of adoption of FOP in their respective market.
Acknowledgements
The authors thank Irene Finocchi, Full Professor of Computer Science at Luiss Guido Carli, for her valuable suggestion on the utilization of clustering techniques utilized in the Preliminary Studies.
Disclosure statement
The authors declare no conflict of interest.
Notes
1 PU_10 Using Front of Pack labels saves me time; PU_11 Food Front-of-Pack label enables me to accomplish food purchase more quickly; PU_12 Using Food Front-of-Pack label reduces the time I spend on unproductive food purchase activities.
References
- Andreeva VA, Egnell M, Handjieva-Darlenska T, Talati Z, Touvier M, Galan P, Hercberg S, Pettigrew S, Julia C. 2020. Bulgarian consumers' objective understanding of front-of-package nutrition labels: a comparative, randomized study . Arch Public Health. 78(1):35–39.
- Ares G, Aschemann-Witzel J, Curutchet MR, Antúnez L, Machín L, Vidal L, Giménez A. 2018. Product reformulation in the context of nutritional warning labels: exploration of consumer preferences towards food concepts in three food categories. Food Res Int. 107:669–674.
- Arrúa A, Curutchet MR, Rey N, Barreto P, Golovchenko N, Sellanes A, Velazco G, Winokur M, Giménez A, Ares G. 2017. Impact of front-of-pack nutrition information and label design on children's choice of two snack foods: Comparison of warnings and the traffic-light system. Appetite. 116:139–146. doi:https://doi.org/10.1016/j.appet.2017.04.012.28428151
- Bagozzi RP. 1980. The nature and causes of self-esteem, performance, and satisfaction in the sales force: a structural equation approach. J Bus. 53(3):315.
- Bastian M, Heymann S, Jacomy M. 2009. Gephi: an open source software for exploring and manipulating networks. BT – International AAAI Conference on Weblogs and Social. International AAAI Conference on Weblogs and Social Media. 3(1):361–362. www.aaai.org.
- Bhatti S, Srivastava R. 2003. Participation of working women in decision-making process as consumer. Int J Cons Stud. 27(3):228–228.
- Bro R, Smilde AK. 2014. Principal component analysis. Anal Methods . 6(9):2812–2831.
- Byrne BM. 2013. Structural equation modeling with Mplus: basic concepts, applications, and programming. London: Routledge.
- Carmines EG, Zeller RA. 1979. Reliability and validity assessment. New York, NY: Sage Publications.
- Caswell JA, Padberg DI. 1992. Toward a more comprehensive theory of food labels. Am J Agric Econ. 74(2):460–468.
- Chang CC, Yan CF, Tseng JS. 2012. Perceived convenience in an extended technology acceptance model: mobile technology and English learning for college students. AJET. 28(5):809–826.
- Cheung GW, Rensvold RB. 2002. Evaluating goodness-of-fit indexes for testing measurement invariance. Struct Equ Modeling. 9(2):233–255.
- Compeau DR, Higgins CA. 1995b. Computer self-efficacy: development of a measure and initial test. MIS Quarterly. 19(2):189–211.
- Crockett RA, King SE, Marteau TM, Prevost AT, Bignardi G, Roberts NW, Stubbs B, Hollands GJ, Jebb SA. 2018. Nutritional labelling for healthier food or non-alcoholic drink purchasing and consumption. Cochrane Database Syst Rev. 2:CD009315.
- Croker H, Packer J, Russell SJ, Stansfield C, Viner RM. 2020. Front of pack nutritional labelling schemes: a systematic review and meta-analysis of recent evidence relating to objectively measured consumption and purchasing. J Hum Nutr Diet. 33(4):518–537.
- Cronbach LJ. 1951. Coefficient alpha and the internal structure of tests. Psychometrika. 16(3):297–334.
- Davis FD. 1989. Perceived usefulness, perceived ease of use, and user acceptance of information technology. MIS Quarterly: Manag Inf Syst. 13(3):319–339.
- Davis FD. 1993. User acceptance of information technology: system characteristics, user perceptions and behavioral impacts. Int J Man-Mach Stud. 38(3):475–487.
- Davis FD, Venkatesh V. 2004. Toward preprototype user acceptance testing of new information systems: implications for software project management. IEEE Trans Eng Manage. 51(1):31–46.
- De Temmerman J, Heeremans E, Slabbinck H, Vermeir I. 2021. The impact of the Nutri-Score nutrition label on perceived healthiness and purchase intentions. Appetite. 157:104995.
- Dietvorst BJ, Bartels DM. 2020. Consumers object to algorithms making morally relevant decisions because of algorithms’ consequentialist decision strategies (December 22, 2020). Available at SSRN: https://ssrn.com/abstract=3753670 or https://doi.org/http://dx.doi.org/10.2139/ssrn.3753670.
- Dishaw MT, Strong DM. 1999. Extending the technology acceptance model with task–technology fit constructs. Inf Manage. 36(1):9–21.
- Dréano-Trécant L, Egnell M, Hercberg S, Galan P, Soudon J, Fialon M, Touvier M, Kesse-Guyot E, Julia C. 2020. Performance of the front-of-pack nutrition label Nutri-Score to discriminate the nutritional quality of foods products: a comparative study across 8 European Countries. Nutrients. 12(5):1303.
- Dubois P, Albuquerque P, Allais O, Bonnet C, Bertail P, Combris P, Lahlou S, Rigal N, Ruffieux B, Chandon P. 2021. Effects of front-of-pack labels on the nutritional quality of supermarket food purchases: evidence from a large-scale randomized controlled trial. J Acad Mark Sci. 49(1):119–138.
- Ducrot P, Méjean C, Julia C, Kesse-Guyot E, Touvier M, Fezeu L, Hercberg S, Péneau S. 2015a. Effectiveness of front-of-pack nutrition labels in French adults: results from the NutriNet-Sante cohort study. PLoS One. 10(10):e0140898.
- Ducrot P, Méjean C, Julia C, Kesse-Guyot E, Touvier M, Fezeu LK, Hercberg S, Péneau S. 2015b. Objective under- standing of front-of-package nutrition labels among nutritionally at-risk individuals. Nutrients. 7(8):7106–7125.
- Ducrot P, Julia C, Méjean C, Kesse-Guyot E, Touvier M, Fezeu LK, Hercberg S, Péneau S. 2016. Impact of different front-of-pack nutrition labels on consumer purchasing intentions: a randomized controlled trial. Am J Prev Med. 50(5):627–636.
- Dulcic Z, Pavlic D, Silic I. 2012. Evaluating the intended use of Decision Support System (DSS) by applying Technology Acceptance Model (TAM) in business organizations in Croatia. Procedia – Soc Behav Sci. 58:1565–1575.
- Egnell M, Ducrot P, Touvier M, Allés B, Hercberg S, Kesse- Guyot E, Julia C. 2018a. Objective understanding of Nutri-Score Front-Of-Package nutrition label according to individual characteristics of subjects: comparisons with other format labels. PLoS One. 13(8):e0202095.
- Egnell M, Talati Z, Hercberg S, Pettigrew S, Julia C. 2018b. Objective understanding of front-of-package nutrition labels: an international comparative experimental study across 12 countries. Nutrients. 10:1542.
- Egnell M, Talati Z, Galan P, Andreeva VA, Vandevijvere S, Gombaud M, Dréano-Trécant L, Hercberg S, Pettigrew S, Julia C. 2020. Objective understanding of the Nutri-score front-of-pack label by European consumers and its effect on food choices: an online experimental study. Int J Behav Nutr Phys Act. 17(1):146–113.
- Egnell M, Talati Z, Pettigrew S, Galan P, Hercberg S, Julia C. 2019. Vergleich von Front-of-Pack-Kennzeichnungen zur Aufklärung deutscher VerbraucherInnen über den Nährwert von Lebensmitteln: Farbkodierte Kennzeichnungen übertreffen alle anderen Systeme. Ernahrungs Umschau. 66(5):76–84. https://doi.org/https://doi.org/10.4455/eu.2019.020.
- European Commission. 2020. Inception Impact Assessment: Proposal for a revision of Regulation (EU) No 1169/2011 on the provision of food information to consumers. Retrieved at: https://www.essna.com/wp-content/uploads/2021/01/Inception-Impact-Assessment-FIC-F2F.pdf.
- European Parliaments and the Council. 2020. Farm to Fork Strategy | Food Safety. https://ec.europa.eu/food/farm2fork_en.
- Featherman MS, Pavlou PA. 2003. Predicting e-services adoption: a perceived risk facets perspective. Int J Hum Comput Stud. 59(4):451–474.
- Fialon M, Egnell M, Talati Z, Galan P, Dréano-Trécant L, Touvier M, Pettigrew S, Hercberg S, Julia C. 2020. Effectiveness of Different Front-of-Pack Nutrition Labels among Italian Consumers: Results from an Online Randomized Controlled Trial. Nutrients. 12(8):2307 doi:https://doi.org/10.3390/nu12082307.
- Finkelstein EA, Li W, Melo G, Strombotne K, Zhen C. 2018. Identifying the effect of shelf nutrition labels on consumer purchases: Results of a natural experiment and consumer survey. Am J Clin Nutr. 107(4):647–651.
- Fishbein M, Ajzen I. 1975. Beliefs, attitude, intention, and behavior. Reading (MA): Addison-Wesley.
- Forina M, Armanino C, Raggio V. 2002. Clustering with dendrograms on interpretation variables. Anal Chim Acta. 454(1):13–19.
- Fornell C, Larcker DF. 1981. Structural equation models with unobservable variables and measurement error: algebra and statistics. J Mark Res. 18(3):382–388.
- French Health Ministry. 2021. Nutri-Score. retrieved at: https://www.santepubliquefrance.fr/determinants-de-sante/nutrition-et-activite-physique/articles/nutri-score.
- Galan P, Egnell M, Salas-Salvadó J, Babio N, Pettigrew S, Hercberg S, Julia C. 2020. Understanding of different front-of-package labels by the Spanish population: results of a comparative study. Endocrinol Diabetes Nutr (Engl Ed). 67(2):122–129.
- Garaus M, Wolfsteiner E, Wagner U. 2016. Shoppers’ acceptance and perceptions of electronic shelf labels. J Bus Res. 69(9):3687–3692.
- Gefen D. 2004. What makes an ERP implementation relationship worthwhile: linking trust mechanisms and ERP usefulness. J Manage Inf Syst. 21(1):263–288.
- Gefen D, Straub DW. 2004. Consumer trust in B2C e-Commerce and the importance of social presence: experiments in e-Products and e-Services. Omega. 32(6):407–424.
- Goodhue DL. 1995. Understanding user evaluations of information systems. Manage Sci . 41(12):1827–1818.
- Goodhue DL, Thompson RL. 1999. Task-technology fit and individual performance Study. MIS Quarterly. 23(2):145–236. MIS Quarterly. 1995;19(2). 213.
- Grunert KG, Wills JM. 2007. A review of European research on consumer response to nutrition information on food labels. J Public Health. 15(5):385–399.
- Han J, Moon H, Oh Y, Chang JY, Ham S. 2020. Impacts of menu information quality and nutrition information quality on technology acceptance characteristics and behaviors toward fast food restaurants' kiosk. Nutr Res Pract. 14(2):167–174.
- Hardgrave BC, Johnson RA. 2003. Toward an information systems development acceptance model: the case of object-oriented systems development. IEEE Trans Eng Manage. 50(3):322–336.
- Horton RP, Buck T, Waterson PE, Clegg CW. 2001. Explaining intranet use with the technology acceptance model. J Inf Technol. 16(4):237–249.
- Hu LT, Bentler PM. 1999. Cutoff criteria for fit indexes in covariance structure analysis: conventional criteria versus new alternatives. Struct Equ Modeling. 6(1):1–55.
- Huang L, Lu MT, Wong BK. 2003. The impact of power distance on email acceptance: evidence from the PRC. Comput Inf. 44(1):93–101.
- Igbaria M, Schiffman SJ, Wieckowski TJ. 1994. The respective roles of perceived usefulness and perceived fun in the acceptance of microcomputer technology. Behav Inf Technol. 13(6):349–361.
- Igbaria M, Tan M. 1997. The consequences of information technology acceptance on subsequent individual performance. Inform Manage. 32(3):113–121.
- Italian Economic Development Ministry. 2021. NutrInform Battery. Retrieved at: https://www.nutrinformbattery.it.
- Jackson CM, Chow S, Leitch RA. 1997. Toward an understanding of the behavioral intention to use an information system. Decision Sci. 28(2):357–389.
- Jacquier C, Bonthoux F, Baciu M, Ruffieux B. 2012. Improving the effectiveness of nutritional information policies: assessment of unconscious pleasure mechanisms involved in food-choice decisions. Nutr Rev. 70(2):118–131.
- Johnston R. 2014. Confirmatory Factor Analysis (CFA). In: Encyclopedia of quality of life and well-being research. The Netherlands: Springer; p. 1194–1195. https://doi.org/https://doi.org/10.1007/978-94-007-0753-5_524
- Julia C, Ducrot P, Péneau S, Deschamps V, Méjean C, Fézeu L, Touvier M, HErcberg S, Kesse-Guyot E. 2015a. Discriminating nutritional quality of foods using the 5-color nutrition label in the French food market: consistency with nutritional recommendations. Nutr J. 14:100.
- Julia C, Hercberg S. 2017. Nutri-Score: evidence of the effectiveness of the French front-of-pack nutrition label. Ernahrungs Umschau. 64:181–187.
- Julia C, Kesse-Guyot E, Ducrot P, Péneau S, Touvier M, Méjean C, Hercberg S. 2015b. Performance of a five category front-of-pack labelling system – the 5-colour nutrition label – to differentiate nutritional quality of breakfast cereals in France . BMC Public Health. 15(1):179–179.
- Kim YG, Woo E. 2016. Consumer acceptance of a quick response (QR) code for the food traceability system: application of an extended technology acceptance model (TAM). Food Res Int. 85:266–272.
- King WR, He J. 2006. A meta-analysis of the technology acceptance model. Inf Manage. 43(6):740–755.
- Kline RB. 2015. Principles and practice of structural equation modeling. London: Guilford Publications.
- Langfelder P, Horvath S. 2008. WGCNA: an R package for weighted correlation network analysis. BMC Bioinf. 9(1):1–13.
- Leonard-Barton D, Deschamps I. 1988. Managerial influence in the implementation of new technology. Manage Sci. 34(10):1252–1265.
- Ma YJ, Gam HJ, Banning J. 2017. Perceived ease of use and usefulness of sustainability labels on apparel products: application of the technology acceptance model. Fash Text. 4(1):1–20.
- Marangunić N, Granić A. 2015. Technology acceptance model: a literature review from 1986 to 2013. Univ Access Inf Soc. 14(1):81–95.
- Mazzù MF, Romani S, Baccelloni A, Simonetti E. 2021b. Search of superiority: exploring the effectiveness gap of front-of-pack nutritional labels. An assessment of consumer’s decision-making process toward healthier food choices. J Food Sci Nutr. 7:103.
- Mazzù MF, Romani S, Baccelloni A, Gambicorti A. 2021a. A cross-country experimental study on consumers' subjective understanding and liking on front-of-pack nutrition labels . Int J Food Sci Nutr. 72(6):833–815.
- Mazzù MF, Romani S, Gambicorti A. 2020. Effects on consumers' subjective understanding of a new front-of-pack nutritional label: a study on Italian consumers. Int J Food Sci Nutr. 72(3):357–366.
- Moon JW, Kim YG. 2001. Extending the TAM for a World-Wide-Web context. Inf Manage. 38(4):217–230.
- Mun YY, Jackson JD, Park JS, Probst JC. 2006. Understanding information technology acceptance by individual professionals: toward an integrative view. Inf Manage. 43(3):350–363.
- Nguyen TTH, Nguyen N, Nguyen TBL, Phan TTH, Bui LP, Moon HC. 2019. Investigating consumer attitude and intention towards online food purchasing in an emerging economy: an extended TAM approach. Foods. 8(11):576.
- Oh S, Ahn J, Kim B. 2003. Adoption of broadband Internet in Korea: the role of experience in building attitudes. J Inf Technol. 18(4):267–280.
- Otnes C, McGrath MA. 2001. Perceptions and realities of male shopping behavior. J Retailing. 77(1):111–137.
- Palan S, Schitter C. 2018. Prolific.ac—a subject pool for online experiments. J Behav Exp Finance. 17:22–27.
- Pavlou PA, Gefen D. 2004. Building effective online marketplaces with institution-based trust. Inf Syst Res. 15(1):37–59.
- Peters-Texeira A, Badrie N. 2005. Consumers’ perception of food packaging in Trinidad, West Indies and its related impact on food choices. Int J Cons Stud. 29(6):508–514.
- Pierce TP, Willy C, Roncace R, Bischoff J. 2014. Extending the technology acceptance model: Policy Acceptance Model (PAM). AJHS. 5(2):129–144.
- Plouffe CR, Vandenbosch M, Hulland J. 2001. Intermediating technologies and multi‐group adoption: a comparison of consumer and merchant adoption intentions toward a new electronic payment system. J Prod Innov Manag: Int Publ Prod Dev Manag Assoc. 18(2):65–81.
- R Core Team. 2017. R: A language and environment for statistical computing. R Foundation for Statistical Computing, Vienna, Austria. URL https://www.R-project.org/.
- Richbell S, Kite V. 2007. Night shoppers in the “open 24 hours” supermarket: a profile. Intl J Retail Distrib Mgt. 35(1):54–68.
- Schepers J, Wetzels M. 2007. A meta-analysis of the technology acceptance model: investigating subjective norm and moderation effects. Inf Manage. 44(1):90–103.
- Sherif CW, Sherif M. 1967. Attitude, ego-involvement, and change. New York: Wiley.
- Shim S, Gehrt KC, Holikova S. 1999. Shopping orientation-based segmentation of U.S. grocery shoppers. J Food Prod Mark. 5(2):1–19.
- Slatten LAD. 2012. Something old and something new: using the technology acceptance model to evaluate nonprofit certification. Int J Org Theory Behav. 15(3):423–449.
- Sobal J, Bisogni CA. 2009. Constructing food choice decisions. Ann Behav Med. 38(S1): S37–S46.
- Sprague RH Jr. 1980. A framework for the development of decision support systems. MIS Quarterly. 4(4):1–26.
- Szajna B. 1996. Empirical evaluation of the revised technology acceptance model. Manage Sci. 42(1):85–92.
- Talati Z, Egnell M, Hercberg S, Julia C, Pettigrew S. 2019a. Consumers’ perceptions of five front-of-package nutrition labels: an experimental study across 12 countries. Nutrients. 11(8):1934.
- Talati Z, Egnell M, Hercberg S, Julia C, Pettigrew S. 2019b. Food choice under five front-of-package nutrition label conditions: an experimental study across 12 countries. Am J Public Health. 109(12):1770–1775.
- Talati Z, Pettigrew S, Ball K, Hughes C, Kelly B, Neal B, Dixon H. 2017. The relative ability of different front-of-pack labels to assist consumers discriminate between healthy, moderately healthy, and unhealthy foods. Food Qual Prefer. 59:109–113.
- UK Health Minister. 2019. Guide to creating a front of pack (FoP) nutrition label for pre-packed products sold through retail outlets (2019). Retrieved at: https://www.food.gov.uk/sites/default/files/media/document/fop-guidance_0.pdf.
- Venkatesh V, Thong JYL, Xu X. 2012. Consumer Acceptance and Use of Information Technology: Extending the Unified Theory of Acceptance and Use of Technology. MIS Quarterly. 36(1):157 doi:https://doi.org/10.2307/41410412.
- Venkatesh V. 2000. Determinants of perceived ease of use: integrating control, intrinsic motivation, and emotion into the technology acceptance model. Inf Syst Res. 11(4):342–365.
- Venkatesh V, Bala H. 2008. Technology acceptance model 3 and a research agenda on interventions. Decis Sci. 39(2):273–315.
- Venkatesh V, Davis FD. 1996. A model of the antecedents of perceived ease of use: development and test. Decis Sci. 27(3):451–481.
- Venkatesh V, Davis FD. 2000. A theoretical extension of the technology acceptance model: four longitudinal field studies. Manage Sci. 46(2):186–204.
- Venkatesh V, Morris MG. 2000. Why don’t men ever stop to ask for directions? Gender, social influence, and their role in technology acceptance and usage behavior. MIS Quarterly: Manage Inf Syst. 24(1):115–136.
- Venkatesh V, Morris MG, Davis GB, Davis FD. 2003. User acceptance of information technology: toward a unified view. MIS Quarterly: Manage Inf Syst. 27(3):425–478.
- World Health Organization. 2000. Obesity. https://www.who.int/health-topics/obesity#tab=tab_1.
- Wu L, Chen JL. 2005. An extension of trust and TAM model with TPB in the initial adoption of on-line tax: an empirical study. Int J Hum Comput Stud. 62(6):784–808.