
 ?Mathematical formulae have been encoded as MathML and are displayed in this HTML version using MathJax in order to improve their display. Uncheck the box to turn MathJax off. This feature requires Javascript. Click on a formula to zoom.
Abstract
Micronutrient malnutrition is widespread and is linked with diets low in fruit and vegetables. However, during the twentieth century, declines in essential minerals in fruits and vegetables were reported in the UK and elsewhere. A new analysis of long-term trends of the mineral content of fruits and vegetables from three editions of the UK’s Composition of Foods Tables (1940, 1991 and 2019) was undertaken. All elements except P declined in concentrations between 1940 and 2019 – the greatest overall reductions during this 80-year period were Na (52%), Fe (50%), Cu (49%) and Mg (10%); water content increased (1%). There could be many reasons for these reductions, including changes in crop varieties and agronomic factors associated with the industrialisation of agriculture. Increases in carbon dioxide could also play a role. We call for a thorough investigation of these reductions and steps to be taken to address the causes that could contribute to global malnutrition.
Introduction
Globally, malnutrition in all its forms is the greatest cause of death and morbidity. In 2017 as many as 11 million deaths annually and 255 million Daily Adjusted Life YearsFootnote1 (DALYs) could be attributed to malnutrition, and low intake of whole grains and fruits were important contributors (Murray Citation2019). Mineral micronutrient malnutrition is widespread but there are insufficient global data to quantify the problem: only anaemia (related to Fe deficiency and other causes) and iodine status are assessed in any detail and the data have not been updated since 2005. Iodine deficiency was estimated at 35% globally (WHO Citation2004), and the global prevalence of anaemia for the general population was estimated at 25% (WHO Citation2005). For other essential mineral nutrients, a lack of data means that the full extent of global deficiencies is unknown.
Historical declines in essential minerals in fruit and vegetables (F&V) have been shown in several countries including the UK (Mayer Citation1997) and USA (Davis et al. Citation2004). These reductions should act as a wake-up-call for the need to improve food systems to optimise the nutritional value of foods. There is a well-recognised need to improve the nutritional quality of diets, with studies concurring that the best way to achieve this is through the dual purpose approach of making improvements to food systems to address health and nutrition goals which also improve the sustainability of production (Global Panel on Agriculture and Food Systems for Nutrition Citation2016). Dietary diversification is well recognised as an approach to ensure that a range of foods are consumed to meet the overall nutrient requirements. Food-based approaches to micronutrient malnutrition are gaining some attention, but still many programmes address one nutrient at a time, for example by providing supplements of iron or zinc (Mayer Citation2011; Nair et al. Citation2015). Strategies have been identified to improve the nutritional quality of food through production and post-harvest activities, including ‘fortification, plant breeding and soil fertility management’ (FAO Citation2014). However, in practice, this is interpreted by industry as ‘industrial fortification’, ‘genetic biofortification’ or ‘agronomic biofortification’. The problem with these reductionist approaches is that they target only the most commonly identified deficiencies such as Fe, Zn and I, whilst ignoring the other nutrients. Important opportunities for tackling multiple micronutrient malnutrition in a sustainable and holistic way are missed by targeting single foods for single nutrients. These approaches also take the challenge out of the hands of farmers who could otherwise play an important role in defining the solutions.
Here we propose a strategy to systematically document, research, understand and rectify deficits in the nutritional quality of foods.
The average contribution of F&V to the dietary intake of mineral nutrients in 1988 in the UK was K (37%); Mg (20%); P (12%); Cu (18%) and Zn (11%) (Lewis and Buss Citation1988) and they can, therefore, be considered good sources of minerals. We have not found more up-to-date information. Nutrient dense foods are key to meeting nutrient requirements without overconsuming dietary energy. In our opinion, improving consumption of F&V and other nutrient-dense foods is important to tackling global micronutrient deficiencies and optimising the nutritional quality of these foods is important to offer the best chance of meeting requirements. The nutritional value of these foods is therefore critical to meeting requirements.
The evidence of a general decline in the nutritional value of F&V consumed in the UK comes mainly from statistical analyses of national data sets, the first of which was published by Mayer in 1997 then in the USA by Davis (Mayer Citation1997; Davis et al. Citation2004). Mayer compared data from different editions of McCance & Widdowson’s The Composition of Foods (COF) and concluded that, in the UK, the average concentrations of Ca, Cu, Mg, and Na in vegetables, and the average concentrations of Cu, Mg, Fe and K in fruits, decreased significantly between the 1930s and the 1980s. Similar reductions were found elsewhere as described below.
Since the publication, in 1997, of the historical changes between 1930s and 1980s in UK F&V data (Mayer Citation1997) the UK government has released some updated analyses of F&V (Department of Health UK Citation2013). We have, therefore, returned to the UK data to update the historical changes, compare with other country’s historical comparisons, discuss the nutritional implications and the possible reasons for the declines and to suggest ways to improve the quality of these foods through agricultural production. In this way, the UK data are an example for what we suggest is a global phenomenon.
We have focussed the analysis on fruit and vegetables because they are recognised as an important component of the diet and can help prevent illness. Fruit or vegetables are associated with a ‘probable’ reduced risk of cardiovascular disease and age-related cataracts, and possible reduced risk of colon cancer, rectal cancer, depression, pancreatic disease, hip fracture (Angelino et al. Citation2019).
This current paper therefore poses and addresses five distinct questions:
Have there been systematic declines in the mineral content of F&V in the UK?
Have there been systematic declines in the mineral content of F&V in other countries?
What are the possible nutritional implications of a decline in mineral content of F&V in the UK?
What are the possible causes of any declines in mineral content of F&V?
What are the implications for the UK and globally of any declines in mineral content of F&V?
The methods used to answer each question are described below.
Materials and methods
Have there been systematic declines in the mineral content of F&V in the UK
This study follows the methodology used by Mayer (Citation1997), with three key differences; firstly, instead of comparing F&V separately, these are now combined to improve statistical power, and secondly with new data analysis available, three time points are now compared. The data are also now adjusted for dry matter content whereas the original analysis was on a fresh weight basis.
The data used in this analysis were obtained from three editions of the UK’s Composition of Foods (COF) Tables. There have been seven editions to date of these tables since the first edition was published in 1940. This first edition provided data based on analyses of various foodstuffs which were carried out between 1925 and 1939 (McCance and Widdowson Citation1940). The data for F&V remained unchanged until the fifth edition, published in 1991 (Holland et al. Citation1991). The analyses for this fifth edition were carried out between 1982 and 1990. The seventh edition, published in 2015, included new analyses for commonly consumed F&V carried out between 2011 and 2012 (Finglas et al. Citation2015). Although the COF is still published in hard copy, the dataset is also available online as the Composition of Foods Integrated Dataset (COFID). The latest version of COFID, published in 2019, includes values published in the seventh edition as well as further updates provided by Public Health England based on analysis carried out in 2015 (Public Health England Citation2017). To avoid confusion, these three time points are referred to by the date of publication (1940, 1991 and 2019). The reasons for the particular choice of fruits and vegetables targeted for reanalysis at each time point are not provided in the COF tables:
The data on F&V selected for this paper had to meet the following criteria:
Values were available for the three time points; only fruit and vegetables with new values published in 1940, 1991 and 2019 were included in the analyses.
The descriptions of the analysed portion of the food were comparable. For example, if both samples were peeled.
Only raw samples were included.
The food was not dried or rehydrated.
The food was not a condiment (e.g. horseradish root).
The analysis was limited to F&V, and did not include nuts, cereals or pulses.
The need to have mineral data available at all three time points means that not all F&Vs are included.
Only the original seven minerals reported in the 1940 edition were included throughout, so for example, Zn is not included because it was first listed in the 1991 edition. The minerals included are therefore Na, K, Ca, Mg, P, Fe and Cu. Dry matter and water are also included to enable adjustment for dry matter in the analysis which allows for comparisons of the mineral contents of F&V independent of their water content. Dry weight is calculated as 100 – water content. All statistical analysis was carried out using dry weight-adjusted values. These were calculated multiplying the fresh weight (FW) mineral concentration by the sample fresh weight to dry weight (DW) ratio. The sample fresh weight was 100 g in all cases, and the equation used was:
The analysis of most of the minerals included a numerical value because the mineral contents were within the detectable range of analysis. For Na, however, the analyses includes ‘Tr’ (trace) and is clarified as <0.5 or <1.0; to be able to include these data points, we have entered these ‘Tr’ entries as 0.5 and 1.0 mg/100 g, respectively, according to the information given in the COF version (Department of Health UK Citation2013).
Statistical analysis
Statistical analysis was carried out in SPSS (SPPS Inc., Chicago, IL). Three time comparisons of the mineral contents of F&V were carried out: period 1 from 1940 to 1991; period 2 from 1991 to 2019 and the overall period from 1940 to 2019. For each of these time periods, for each fruit and vegetable, ratios were calculated (new: old) for each dry-adjusted mineral value, and from these the geometric means were calculated for all F&Vs. The geometric mean of the rations (new:old) are presented as % change from the older data.
Repeated Analysis of Variance was used to test the significance of changes in mineral content of the F&V for each time period. For the overall period, the within subject-effects tests, the values shown are those for the Greenhouse–Geisser test. To further examine and confirm these results paired samples t-tests (2-tailed, p < 0.05) were used to test the significance of the changes in mineral content between time periods 1 and 2.
Repeated analysis of variance is a parametric test which assumes normality, this test was preferred over the non-parametric equivalent (Friedmann test). It is more robust and gives more information about the direction of changes in addition to the overall result. The dataset is large enough (n = 29) to assume a normal distribution. As a further check the Friedmann test was also carried out. Significant changes in mineral content over the overall time period (1940–2019) identified in the repeated analysis of variance also significant in the Friedmann test (p < 0.05) (data not shown).
Have there been systematic declines in the mineral content of F&V in other countries
A literature review was conducted to identify other historical analyses of the mineral content of F&V in other countries. Where the same data are analysed several times, we present the first and/or most comprehensive publication of the same data.
What are the possible nutritional implications of a decline in mineral content of F&V in the UK?
We examined the most recent dietary data to determine whether mineral requirements are generally met in the UK. This gives us an indication as to whether declines in the mineral content of F&V are likely to be nutritionally important.
The National Diet and Nutrition Survey (NDNS) rolling programme is a continuous, cross-sectional survey in the UK (Public Health England, Food Standards Agency, NatScen and MRC Human Nutrition Research Citation2016). It is designed to collect detailed, quantitative information on the food consumption, nutrient intake and nutritional status of the general population aged 1.5 years and over living in private households in the UK. The survey covers a representative sample of around 1000 people per year. The publication calculates total dietary nutrient intakes using the results of daily foods consumed and the latest COF tables. The total dietary nutrient intakes are then compared to nutrient recommendations (Committee on Medical Aspects of Food Policy Citation1991). These data provide an indication of the adequacy of UK diets with respect to the minerals under consideration in this paper. It is not possible to recreate historical mineral consumption data using the NDNS and the different COF tables because the data were updated at different times in each set of publications.
What are the possible causes of any declines in mineral content of F&V?
A list of hypothetical explanations for the changes in mineral nutrient content of F&V was compiled by reference to the results of the nutrient analysis in this paper, Mayer and Davis’s earlier historical comparisons, and statements in the COF tables as well as the experience of the authors (Mayer Citation1997; Davis et al. Citation2004; Department of Health UK Citation2013). Each of these proposed hypotheses was examined for their feasibility by searches of the literature.
What are the implications, for the UK and globally, of any declines in mineral content of F&V?
Recommendations for research and policies are made by reference to the preceding sections.
Results
Have there been systematic declines in the mineral content of F&V in the UK?
The updated 2019 data includes 29 F&V that match both the 1991 data and the 1940 data and satisfy our own inclusion criteria. These were: cabbage – winter, carrots – old, cauliflower, celery, cucumber, leeks, lettuce, mushrooms, onions, peas, potatoes – old, radishes, runner beans, tomatoes, watercress, avocado, bananas, blackberries, cherries, eating apples, grapefruit, grapes, nectarines, oranges, pears, pineapple, plums, raspberries, strawberries.Footnote2,Footnote3
Supplementary data (Table ST1) shows all the data included in the analysis. presents the results of mineral content comparisons for the whole time period from 1940 to 2019, and for the periods 1940 to 1991 and 1991 to 2019. highlights the percentage changes in the mineral nutrient contents over the whole period. These data confirm that since the original 1940 analyses of F&V in the UK, there have been reductions in their mineral content adjusted to the dry weight of the original data. The data are presented as three separate time comparisons:
Figure 1. Percentage change in mineral nutrient content of fruits and vegetables between 1940 and 2019. **Significant change (p < 0.01); *significant change (p < 0.05).
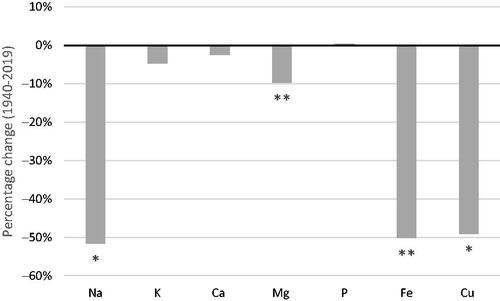
Table 1. Comparisons of minerals, water, and dry matter content of fruits and vegetables between 1940–1991, 1991–2019 and 1940–2019.
In the first period, from 1940 to 1991, there were significant reductions (p < 0.05) in Na, Ca, Mg and Cu. The greatest reductions were Cu (60%) and Na (32%). There were also increases in water content. This is of interest because it shows that by 1991 the fruits and vegetables contained more water and nutrient density – on a fresh weight basis – has consequently decreased.Footnote4 Comparisons of these data were published separately for fruits and vegetables on a fresh weight basis by Mayer in 1997 (Mayer Citation1997).
In the second period, from 1991 to 2019, there was a significant reduction in Fe (36%) and a significant increase in Mg (18%). There was also a further reduction in Na and increase in water that was not statistically significant (p < 0.05).
The overall longer-term comparison of data from 1940 to 2019 shows that the mineral contents of fruits and vegetables remain lower than in 1940. The greatest overall reductions during this 80-year period were Na (52%), Fe (50%) Cu (49%) and Mg (10%). There was a 12% decrease in dry matter content that was not statistically significant.
Overall, these results indicate very important and significant reductions systematically across the range of essential mineral nutrients. The magnitude and direction of the changes in nutrient content over the 80-year period varied considerably.
Have there been systematic declines in the mineral content of F&V in other countries?
Similar historical comparisons of the mineral content of F&V have been conducted in several countries. A summary of the historical changes is presented in . The F&V included in the analyses are shown in (ST2). The publications selected for inclusion in are all analyses of national data sets; later reviews of this same evidence are not included unless the analysis is different from the earlier publication (as is the case for the last two entries).
Table 2. Summary of changes over time in mineral content of horticultural produce reported in the literature (does not include reviews but only includes studies which performed analysis on national data sets).
Although there are commonalities, the F&V included in these historical comparisons are not the same. In each case, the authors of the publications based their analysis on a typical ‘basket’ of F&V consumed in their country, details can be found in Supplementary Table ST2. Excepting the values shown for Cunningham et al. (Citation2002), the values shown in as significant and non-significant were those reported in each of the publications. Cunningham et al. (Citation2002) reported increases and decreases without statistical analysis, we analysed their data using the methods described by Mayer (Citation1997) and values shown in bold were found to be significant.
It shows that, rather than being an isolated case, many countries have experienced declines in the mineral nutrient content of fruits and vegetables since the 1940s. For most of these studies, there is a decline in nutrients or no change with the exception of the Australian data that used a much later date (1980s) as the baseline. These data accord with our hypothesis that there has been a decline since the introduction of industrialised agriculture.
What are the possible nutritional implications of a decline in mineral content of F&V in the UK?
shows the Lowest Reference Nutrient Intake (LRNI) described by COMA (Committee on Medical Aspects of Food Policy Citation1991) for the minerals of interest that were included in the COF tables from 1940 to 2019. The LRNI is the lowest standard for dietary adequacy of the individual minerals.
Table 3. Lower Reference Nutrient Intake (LRNI) values in the UK.
shows the results for the latest National Diet and Nutrition Survey data from years 2012/13 to 2013/14 on dietary intake for those minerals that are included in the COF tables, compared to the LRNI. It shows that there are significant proportions of the population consuming less than the LRNI for the minerals of interest. Since the LRNI is a minimum standard for adequacy, there is a real concern that certain groups are not meeting even this requirement. Teenage girls are particularly prone to inadequacy of all the listed minerals: about half consume less than the LRNI for Mg and Fe. Fe intake is important for women due to high demands of menstruation, pregnancy and lactation and, hence, women of reproductive age are at high risk of deficiency. Mg is also of particular concern not only for teenagers but also all adults; it is important for bone, nerve and muscle function. Ca is also needed for a range of functions including bone development so poor intake during adolescence is a concern. Each of these minerals is essential and has key biochemical functions that can cause sub-optimal health when inadequate (Public Health England, Food Standards Agency, NatScen and MRC Human Nutrition Research Citation2016).
Table 4. Percentage of UK NDNS participants with average daily intakes below the LRNI for mineral nutrients from food sources.
The NDNS accords with this observation (Public Health England, Food Standards Agency, NatScen and MRC Human Nutrition Research Citation2016).
‘there was evidence of intakes below the LRNI in a substantial proportion of older children and adults for some minerals, particularly magnesium, potassium and seleniumFootnote5’
Many people do not consume a sufficiently varied diet and teenagers, in particular, have poor diets, with only 2.9 portions of F&Vs on average for 11–15-year-olds; only 9% meet the recommendation of 5 portions per day. For adults aged 50–64, by contrast, the average was 4.7 portions with 38% meeting the recommendation. In addition, the lowest income groups consumed the fewest number of fruit and vegetable portions.
In our opinion, therefore, good nutritional quality of F&Vs is key, particularly for those groups who are vulnerable to deficiency.
What are the possible causes of any declines in mineral content of F&V?
The ‘Nutrient analysis of Fruits and Vegetables’ (Department of Health UK Citation2013) includes the following statement:
‘It is not possible to make robust comparisons between current data and existing data held for F&Vs largely derived from earlier analytical surveys undertaken between 1982 and 1990. Since that time (between 1982 and 1990 and the 2010s), there have been changes in agricultural practices (particularly the type of fertilisers used, as well as the cultivars grown and geographical origin of some produce) that might affect the nutrient composition of the produce’
We question this statement because this is the very reason for carrying out the comparison, to determine whether representative fruits and vegetables, then and now, are different in mineral nutrient content and what the causes could be. In this statement are three possible explanations for the changes, i.e. type of fertiliser; type of cultivar and geographical origin. Each of these potential explanations and our own hypotheses is examined below.
Changes in geographical origin of F&V
The source of F&V in the UK during the 80 years of the comparison has changed substantially. During the Second World War, and the ‘Dig for Victory’ campaign, households were encouraged to produce as much of their own food as possible. In 1940 as much as 92% of fruit and vegetables were supplied by gardens in the winter and 98% in the summer in rural households but only 12% and 49% in urban households in winter and summer. In more recent years, the contribution of UK production to total fruit and vegetable supply in the UK decreased from 42% in 1987 to 22% in 2013 (Scheelbeek et al. Citation2020), meaning the largest proportion of F&Vs are imported. How these changes in the source of foods affect the mineral content will depend on a number of factors that are explored below.
Change in crop varieties
Varieties grown by modern commercial producers are very different to those grown in the early twentieth century. Today most varieties have been bred to improve their productivity and profitability and this focus on yield has largely ignored any implications for nutritional quality (Carli et al. Citation2004; Morris and Sands Citation2006). Davis, in his analysis of US horticulture, noted that significant yield increases have been achieved since the Second World War, but that during this same time period mineral losses were greatest in vegetables. He attributed this to a ‘dilution effect’, that is as yield increases, dry matter and carbohydrate (which is more than 80% of dry matter in F&Vs) also increases; without a concurrent increase in minerals the relative proportions are changed or diluted (Davis Citation2009). Therefore, one of the possible explanations for changes in mineral content of UK F&Vs is that varieties consumed now are higher yielding but less nutrient dense than those grown and eaten in the 1930s and 1980s. Significant variation in mineral content between cultivars has been observed in a number of crops including potato, raspberry and broccoli (White and Broadley Citation2005; Farnham et al. Citation2011). There is evidence that, at least in the case of cereals, modern varieties contain lower concentrations of several minerals – this change was clearly linked to the development of high yielding short straw varieties (Fan et al. Citation2008). However, the evidence for genetic dilution in horticultural crops is much less clear cut (White and Broadley Citation2005) and additional research is needed to examine the phenomenon in a greater range of F&Vs.
Change to less agroecological methods of farming
Organic farming systems, and related agroecological approaches, rely on the management of soil organic matter to enhance the chemical, biological, and physical properties of the soil, in order to optimise crop production (Watson et al. Citation2002). In the absence of archived samples, modern organic produce can serve as a proxy for fruits and vegetables produced before industrial agriculture became established. There have been several reviews of comparisons of organically grown fruits and vegetables and nutrient content but few that included the mineral nutrients that are of interest. A much cited review concluded that there was no evidence of a difference (Dangour et al. Citation2009), but statistical power was lost by the exclusion of a very large proportion of potential studies; the full supplemental data showed higher nutrients in organic compared to conventionally grown food (Benbrook et al. Citation2009). A more recent review showed higher mean percentage differences in micronutrient content in organic versus conventional, favouring organic (+5.9%, p < 0.001) (Hunter et al. Citation2011). Higher mineral nutrient concentrations (Fe, Mg and dry matter) were also found in organically grown compared to conventional (Lairon Citation2010; Popa et al. Citation2019).
Changes in soil microbiology related to a shift to industrial agriculture
Plants grow and take up minerals from the soil in conjunction with a complex relationship with soil organisms. One example of this is the arbuscular mycorrhizal fungi (AMF) symbiosis with plant roots which enables better uptake of soil nutrients as a larger volume of soil can be effectively utilised by the plants. Agroecological farming methods are likely to promote AMF symbiosis because of the avoidance of artificial fertilisers and fungicides. Minimum tillage and agrobiodiversity also promote this symbiosis (He and Nara Citation2007). Encouraging AMF to support plant nutrition has been proposed as a route to biofortificationFootnote6 rather than using plant breeding or application of artificial fertilisers (He and Nara Citation2007).
A review of AMF inoculation studies showed that measurements of the nutrient content of roots, leaves and shoots and micronutrient uptake are more common than studies of the edible portion of crops (Antunes et al. Citation2012). However, some evidence of improved nutrient profile with AMF inoculation was evident: higher concentrations of P, Zn, Cu and N were found in leeks (Sorensen et al. Citation2008). There was approximately 20% higher Zn, Cu and Se content in the edible portion of a range of vegetable crops with AMF inoculation and also an increase in yield (Ward et al. Citationno date). Tomatoes had higher mineral value (particularly N, P, and Cu) with AMF inoculation (Hart et al. Citation2015). On the other hand, high AMF colonisation did not correspond with greater crop growth, yield, or uptake of P, K, Ca, Cu or S in wheat or field pea although there was a positive effect on total crop Zn-uptake and grain Zn concentration (Ryan and Angus Citation2003).
Large applications of fertiliser N and P inhibit Fe, Mn and Zn uptake in plants that form symbiotic relationships with AMF (Azcón et al. Citation2003) whilst organically farmed soils have been shown to contain a greater abundance of AMF spores (Gosling et al. Citation2010). This range of studies suggests that a decline in the symbiotic relationship with plant roots could at least partially explain the historical declines in mineral content of F&Vs that has occurred since agricultural industrialisation.
Agronomic dilution effect
The usage of fertilisers, particularly those containing nitrogen, phosphorus and potassium increased rapidly from the 1940s onwards, increasing crop yields. Calcium is routinely applied (as lime) to crops to regulate soil pH and sulphur is often given to brassica crops, but micronutrients are generally not applied as fertilisers unless a particular deficiency is suspected or identified through soil testing. There is a view that a decline in minerals in crops may be due to the consequent depletion of soil trace elements (Thomas Citation2001). This has, however, been refuted by Fan et al. (Citation2008) who believe that the decline in minerals measured in grain from the Broadbalk experiments was due to the dilution effect of increased yield made possible by more productive varieties. More work is necessary to see if the same is true with fruits and vegetables.
A switch to soil-less growing techniques
Field vegetables and top fruit are still grown in soil but almost all UK conventional protected fruit crops (e.g. tomatoes, peppers and aubergines) are produced in soil-less culture such as hydroponics. These systems are optimised to maximise yield, using artificial fertilisers, so nutritional value of the produce is not considered an issue; plants grown in soil may be able to take up some micronutrients in greater amounts (especially those, like Se that are not actually required by plants). However, the issue is not clear cut (Gruda Citation2009). There is a surprising lack of robust studies that compare the mineral composition of crops grown in soil with soil-less production systems.
Change in the use of metal-based fungicides
Copper has been used as a fungicide since the nineteenth century but since the Second World War a succession of new pesticides were developed that were more active, less phytotoxic and easier to prepare; this has led to a great reduction in the amount of copper used in agriculture that may be partly responsible for the decline in copper shown in our results between 1940 and 1992s. Farias et al. (Citation2018) found that potatoes grown in vineyard soil where Cu fungicides had been routinely used for many years had elevated levels of Cu in the tubers.
Change in climate
Experimental results where carbon dioxide is artificially increased suggest that elevated concentrations in the air can reduce mineral nutrient concentration in fruits and vegetables (Loladze Citation2014; Myers et al. Citation2014). For the periods covered by this analysis, average values for atmospheric CO2 concentration were 308 ppm CO2 in the 1930s, 345 ppm CO2 in the 1980s, 398 ppm CO2 in the 2010s (European Environment Agency Citation2020). The elevated CO2 values used in the above experiments are more than the changes in atmospheric CO2 recorded between 1930 and 2019, but elevated concentrations could still have contributed to the observed reductions in mineral content. Historical records show that the average global surface temperature is now around 1 °C higher than that of the pre-industrial period and that globally 17 of the 18 warmest years have occurred since 2000 (Blunden et al. Citation2018). However, the published evidence available to support the impact of climatic changes, such as increased temperature, atmospheric ozone and drought on mineral nutrition in UK fruits and vegetables is insufficient to draw conclusions.
Changes in post-harvest handling
There have been considerable changes in the supply chain and post-harvest handling since the first edition of the Chemical Composition of Foods was published (McCance and Widdowson Citation1940). The changes have been supported by improvements in transport infrastructure and in storage and harvesting technology, having been driven by the changing requirements of the food supply chain. In the present day a large proportion of UK F&Vs are purchased in supermarkets. Supermarkets demand that produce meets exacting quality control standards; they require that produce is of uniform size and colour, blemish and pest free, washed to remove soil, trimmed, chilled and also often pre-packaged. Unlike vitamins, mineral concentrations in raw F&Vs are little affected by the processes that occur in the post-harvest period such as exposure to heat, light, or oxidising agents (Rickman et al. Citation2007) although trimming may remove plant tissues that are rich in minerals such as the outer leaves (Makhlouf et al. Citation1995). In the three time point comparisons in this paper, we were careful to include fruits and vegetables that had been prepared in comparable ways, so differences in trimming and removing outer leaves, should not explain the declining mineral nutrients. Washing may remove soil particles which contain minerals (Makhlouf et al. Citation1995). Bouzari et al. (Citation2015) found that removal of soil particles affected the mineral content of spinach and carrots resulting in small losses in Fe. This finding might be important because, overall declines in Fe were found in each time period.
What are the implications for the UK and globally of any declines in mineral content of F&V?
Our results clearly show that there has been a systematic reduction in the mineral nutrient content of fruits and vegetables consumed in the UK since the 1930s; this is particularly evident for some elements such as Fe that are known to be of nutritional concern. This is despite an assertion in 2013 by the Department of Health in its publication ‘Nutritive Value of Fruits and Vegetables’ (Department of Health UK Citation2013) that any such declines are not nutritionally important:
‘These results are broadly similar to existing data held. There is no evidence of major changes in the nutrient content of F&Vs based on this survey’.
Our comparisons bring this statement in to question.
Recommendations
United Kingdom
We recommend the UK Department of Health set up regular analyses of the nutritional quality of F&Vs. These should be compared to previous data in a time series to create greater transparency and awareness of changes in nutrient content. In addition, there should be a comprehensive monitoring of the nutritional value of different varieties, related to different methods of production and processing.
There is a disconnect between the NDNS data and recommendations contained therein for action. For example, the Mg data suggest a widespread deficiency, but no recommendations are given for action. The Department for Health needs to launch a strategy for addressing the deficiencies shown in the NDNS.
With the seemingly systematic reductions, it is necessary to have a holistic approach rather than an approach that takes each nutrient one at a time. It is important that all foods are grown and processed in a way that optimises their nutrient content from production through to consumption.
We do not recommend dietary supplements to meet the gap in nutrients supplied by fruits and vegetables. Unless for diagnosed specific problems, these foods remain the best source of nutrients.
Globally
Global databases of the COF could be examined for historical changes in the nutrient content of F&Vs, particularly to highlight problems in countries with high prevalence of micronutrient malnutrition.
Nutrition programmes that have historically focussed on a very limited range of mineral micronutrients (I, Fe and Zn) should give attention to the full range of nutrients that could be deficient through food-based approaches.
For a range of reasons, agroecological farming should be supported in the context the global climate emergency and loss of biodiversity. The limited evidence that compares nutritional value of organic versus conventionally grown F&Vs adds an extra reason to switch from industrial to agroecological farming.
Plant breeding should aim to improve a whole basket of mineral nutrients, not just targeted to one nutrient at a time, as is the current approach of biofortification programmes.
Farmers and other actors in the food system need to be provided with practical information to improve the nutritional quality of fruits and vegetables although further research is needed to fill the gaps in knowledge about how to improve nutritional quality of foods.
The phenomenon of the ‘genetic dilution effect’ needs investigation with side-by-side field trials comparing modern and older varieties. Similarly, to examine the effect of agronomic dilution, side by side trials of the same variety could be undertaken whilst varying the agronomic conditions to increase yield. Long-term trials of organic versus conventionally grown foods are still needed using agreed protocols. Where existing field trials are carried out for agronomic purposes, an extra analysis of the nutritional quality of the produce could be added. With the latest analysis technology, this should be relatively straightforward compared to similar analyses in the 1930s.
Conclusions
In the last 80 years, there have been reductions in concentrations of a range of nutritionally important minerals in UK fruits and vegetables, as published by UK Government sources. These reductions have been accompanied by a transformation of agriculture and widespread environmental changes. From 1940 to 1991, there were significant reductions in Na, Ca, Mg, and Cu; in the latest data, from the 2010s, there have been further significant reductions in Fe and some recovery in Mg. Therefore, in the overall 80-year period, there were significant and nutritionally important reductions in Na (52%), Fe (50%), Cu (49%) and Mg (10%). For some vulnerable groups, and those with poor diets, these reductions are important because they make a bad situation worse – teenagers are at particular risk of inadequate diets.
The potential causes have been explored in this paper; these are likely to be systematic across the mineral nutrients and include the choice of cultivar or plant variety, agronomic factors associated with a shift from largely organic practices to industrial practices. Changes to the soil ecosystems related to this shift are likely to be important, for example the loss of mycorrhizal colonisation of plant roots or soil-less farming such as hydroponics. Increases in atmospheric or artificially elevated carbon dioxide could play a role in the wide range of reductions in minerals. Declines in specific minerals could have particular causes, for example, Fe reductions could be caused by more thorough washing of vegetables in later samples and Cu contamination could have been present in earlier samples from copper-based fungicides.
We are also concerned that fruits and vegetables could have lost their value for other essential trace elements that were not included in early versions of the COF tables, such as Se, I and Zn.
Supplemental Material
Download MS Excel (16 KB)Supplemental Material
Download MS Excel (25.8 KB)Acknowledgments
The authors acknowledge the valuable comments on the manuscript provided by Don Davis and Julia Wright. The authors thank Alun Owen, Statistician at Sigma, Coventry University for his invaluable advice.
A. M. confirms that she had full access to all the data in the study and had final responsibility for the decision to submit for publication.
Disclosure statement
The authors report no conflict of interest.
Additional information
Funding
Notes
1 One DALY can be thought of as one lost year of ‘healthy’ life. The sum of these DALYs across the population, or the burden of disease, can be thought of as a measurement of the gap between current health status and an ideal health situation where the entire population lives to an advanced age, free of disease and disability (World Health Organisation).
2 Tomatoes and peppers are technically fruits but are included as vegetables in the COF tables.
3 The fruits and vegetables included in the COF represent common sources in the UK at the time of analysis and could include foods grown in the UK or abroad.
4 Nutrient density is the content of mineral nutrient in the fruit or vegetable as a proportion of the energy content.
5 Selenium has not been included in Tables 1 and 2 because it was only added recently to the Composition of Foods Tables.
6 Biofortification: the process of increasing the bioavailable concentrations of an element in edible portions of crop plants through agronomic intervention or genetic selection.
Related Research Data
References
- Angelino D, Godos J, Ghelfi F, Tieri M, Titta L, Lafranconi A, Marventano S, Alonzo E, Gambera A, Sciacca S, et al. 2019. Fruit and vegetable consumption and health outcomes: an umbrella review of observational studies. Int J Food Sci Nutr. 70(6):652–667.
- Antunes PM, Franken P, Schwarz D, Rillig M, Cosme M, Scott M, Hart M, 2012. Linking soil biodiversity and human health: do arbuscular mycorrhizal fungi contribute to food nutrition? In: Wall DH, et al., editors. Soil ecology and ecosystem services. Oxford: Oxford University Press.
- Azcón R, Ambrosano E, Charest C. 2003. Nutrient acquisition in mycorrhizal lettuce plants under different phosphorus and nitrogen concentration. Plant Sci. 165(5):1137–1145.
- Benbrook C, Davis DR, Andrews PK. 2009. Letters to the editor. Methodological flaws in selecting studies and comparing nutrient concentrations led Dangour et al. to miss the emerging forest from amidst the trees. Am J Clin Nutr. 90:1700–1701.
- Blunden J, Arndt D, Hartfield G. 2018. State of the climate in 2017. Bull Am Meteor Soc. 99(8):Si–S332.
- Bouzari A, Holstege D, Barrett D. 2015. Mineral, fiber, and total phenolic retention in eight fruits and vegetables: a comparison of refrigerated and frozen storage. J Agric Food Chem. 63(3):951–956.
- Carli P, Barone A ,Fogliano V, Frusciante L, Ercolano MR. 2004. Dissection of genetic and environmental factors involved in tomato organoleptic quality. BMC Plant Biol. 11:58.
- Committee on Medical Aspects of Food Policy. 1991. Dietary Reference Values (DRVs) for Food Energy and Nutrients for the UK (41) Report on Health and Social Subjects. London: T. S. Office.
- Cunningham JH, Milligan G, Trevisan L. 2002. Minerals in Australian Fruits and Vegetables – A Comparison of Levels Between the 1980s and 2000. A. N. Z. Food Standards. https://www.foodstandards.gov.au/publications/documents/minerals_report.pdf.
- Dangour AD, Dodhia SK, Hayter A, Allen E, Lock K, Uauy R. 2009. Nutritional quality of organic foods, a systematic review. Am J Clin Nutr. 90(3):680–685.
- Davis DR. 2009. Declining fruit and vegetable nutrient content: what is the evidence. Hortic Sci. 44(1):15–19.
- Davis DR. 2011. Impact of breeding and yield on fruit, vegetable, and grain nutrient content. In: Jenks MA, Bebeli PJ, editors. Breeding for fruit quality. New York (NY): Wiley-Blackwell; p. 127–150.
- Davis DR, Epp MD, Riordan HD. 2004. Changes in USDA food composition data for 43 garden crops 1950 to 1999. J Am Coll Nutr. 23(6):669–682.
- Department of Health UK. 2013. Nutrient analysis of fruit and vegetables: analytical report.
- Ekholm P, Reinivuo H, Mattila P, Pakkala H, Koponen J, Happonen A, Hellström J, Ovaskainen M-L. 2007. Changes in the mineral and trace element contents of cereals, fruits and vegetables in Finland. J Food Compos Anal. 20(6):487–495.
- European Environment Agency. 2020. Atmospheric greenhouse gas concentrations. https://www.eea.europa.eu/data-and-maps/indicators/atmospheric-greenhouse-gas-concentrations-6/assessment-1.
- Fan M-S, Zhao F-J, Fairweather-Tait SJ, Poulton PR, Dunham SJ, McGrath SP. 2008. Evidence of decreasing mineral density in wheat grain over the last 160 years. J Trace Elem Med Biol. 22(4):315–324.
- Fan M, Zhao F, Poulton P, McGrath S. 2008. Historical changes in the concentrations of selenium in soil and wheat grain from the Broadbalk experiment over the last 160 years. Sci Total Environ. 389(2–3):532–538.
- FAO. 2014. Second International Conference on Nutrition: Nutrition-sensitive Agriculture.
- Farias J, Nunes S, Sausen D, Nune SM, Neis F, Garlet L, Nunes P, Dressler V, Schetinger M, Rossato L, et al. 2018. Agricultural contamination: effect of copper excess on physiological parameters of potato genotypes and food chain security. J Appl Bot Food Qual. 91:49–59.
- Farnham MW, Grusak MA, Keinath AP. 2011. Mineral concentration of broccoli florets in relation to year of cultivar release. Crop Sci . 51(6):2721–2727.
- Finglas P, Roe M, Pinchen H, Berry R, Church S, Dohdia S, Farron-Wilson M, Swan G. 2015. McCance and Widdowson's the composition of foods. Seventh summary edition. Cambridge: Royal Society of Chemistry Cambridge.
- Global Panel on Agriculture and Food Systems for Nutrition. 2016. Food systems and diets: facing the challenges of the 21st century.
- Gosling P, Ozaki A, Jones J, Turner M, Rayns F, Bending GD. 2010. Organic management of tilled agricultural soils results in a rapid increase in colonisation potential and spore populations of arbuscular mycorrhizal fungi. Agric Ecosyst Environ. 139(1–2):273–279.
- Gruda N. 2009. Do soilless culture systems have an influence on product quality of vegetables? J Appl Bot Food Qual. 82:141–147.
- Hart M, Ehret DL, Krumbein A, Leung C, Murch S, Turi C, Franken P. 2015. Inoculation with arbuscular mycorrhizal fungi improves the nutritional value of tomatoes. Mycorrhiza. 25(5):359–376.
- He X, Nara K. 2007. Element biofortification: can mycorrhizas potentially offer a more effective and sustainable pathway to curb human malnutrition? Trends Plant Sci. 12(8):331–333.
- Holland B, Welch A, Unwin I, Buss D, Paul A, Southgate D. 1991. McCance and Widdowsons composition of foods. 5th edn. London: Royal Society of Chemistry and Ministry of Agriculture Fisheries and Food, HMSO.
- Hunter D, Foster M, McArthur J, Ojha R, Petocz P, Samman S. 2011. Evaluation of the micronutrient composition of plant foods produced by organic and conventional agricultural methods. Crit Rev Food Sci Nutr. 51(6):571–582.
- Lairon D. 2010. Nutritional quality and safety of organic food. A review. Agron Sustain Dev. 30(1):33–41.
- Lewis J, Buss D. 1988. Trace nutrients. 5. Minerals and vitamins in the British household food supply. Br J Nutr. 60(3):413–424.
- Loladze I. 2014. Hidden shift of the ionome of plants exposed to elevated CO2 depletes minerals at the base of human nutrition. eLIFE. 3:e02245.
- Makhlouf J, Zee J, Tremblay N, Bélanger A, Michaud M-H, Gosselin A. 1995. Some nutritional characteristics of beans, sweet corn and peas (raw, canned and frozen) produced in the province of Quebec. Food Res Int. 28(3):253–259.
- Mayer AB. 1997. Historical changes in the mineral content of fruit and vegetables. Br Food J. 99(6):207–211.
- Mayer AB. 2011. A food systems approach to increase dietary zinc intake in Bangladesh based on an analysis of diet, rice production and processing. In: Thompson B, editor. Combating micronutrient deficiency: food-based approaches. Rome: FAO. p. 256.
- McCance R, Widdowson E. 1940. The composition of foods. In: Medical research council special report series, No. 25. London: HMSO.
- Morris C, Sands D. 2006. The breeder's dilemma-yield or nutrition? Nat Biotechnol. 24(9):1078–1080.
- Murray CJL. 2019. Health effects of dietary risks in 195 countries, 1990–2017: a systematic analysis for the Global Burden of Disease Study 2017. Lancet. 383:1958–1972.
- Myers S, Zanobetti A, Kloog I, Huybers P, Leake A, Bloom A, Carlisle E, Dietterich L, Fitzgerald G, Hasegawa T, et al. 2014. Increasing CO2 threatens human nutrition. Nature. 510(7503):139–142.
- Nair MK, Augustine LF, Konapur A. 2015. Food-based interventions to modify diet quality and diversity to address multiple micronutrient deficiency. Front Public Health. 3(277):277.
- Popa ME, Mitelut AC, Popa EE, Stan A, Popa VI. 2019. Organic foods contribution to nutritional quality and value. Trends Food Sci Technol. 84:15–18.
- Public Health England. 2017. Nutrient analysis survey of fresh and processed fruit and vegetables with respect to fibre. https://assets.publishing.service.gov.uk/government/uploads/system/uploads/attachment_data/file/603483/fruit_and_vegetable_survey_2015_analytical_report.pdf.
- Public Health England, Food Standards Agency, NatScen and MRC Human Nutrition Research. 2016. National Diet and Nutrition Survey Results from Years 5 and 6 (combined) of the Rolling Programme (2012/2013–2013/2014).
- Rickman JC, Christine M, Bruhn CM, Barret DM. 2007. Nutritional comparison of fresh, frozen, and canned fruits and vegetables II. Vitamin A and carotenoids, vitamin E, minerals and fiber. J Sci Food Agric. 87(7):1185–1196.
- Ryan MH, Angus JF. 2003. Arbuscular mycorrhizae in wheat and field pea crops on a low P soil: increased Zn-uptake but no increase in P-uptake or yield. Plant Soil. 250(2):225–239.
- Scheelbeek PFD, Moss C, Kastner T, Alae-Carew C, Jarmul S, Green R, Taylor A, Haines A, Dangour AD. 2020. UK's fruit and vegetable supply increasingly dependent on imports from climate vulnerable producing countries. Nat Food. 1(11):705–712.
- Sorensen JN, Larsen J, Jakobsen I. 2008. Pre-inoculation with arbuscular mycorrhizal fungi increases early nutrient concentration and growth of field-grown leeks under high productivity conditions. Plant Soil. 307(1–2):135–147.
- Thomas D. 2001. Mineral depletion in foods over the period 1940 to 1991. Nutr Practitioner. 3(2):27–29.
- Ward N, Stead K, Reeves J. no date. Impact of endomycorrhizal fungi on plant trace element uptake and nutrition. http://www.nutrition-matters.co.uk/.
- Watson CA, Atkinson D, Gosling P, Jackson LR, Rayns FW. 2002. Managing soil fertility in organic farming systems. * Soil Use Manage. 18:239–247.
- White PJ, Broadley MR. 2005. Historical variation in the mineral composition of edible horticultural products. J Hortic Sci Biotechnol. 80(6):660–667.
- WHO. 2004. Global Database on Iodine Deficiency. https://www.who.int/vmnis/database/iodine/iodine_data_status_summary_t2/en/.
- WHO. 2005. Worldwide prevalence on anaemia 1993–2005 https://www.who.int/vmnis/database/anaemia/anaemia_status_summary/en/.