
 ?Mathematical formulae have been encoded as MathML and are displayed in this HTML version using MathJax in order to improve their display. Uncheck the box to turn MathJax off. This feature requires Javascript. Click on a formula to zoom.
ABSTRACT
This paper estimates spillover effects of investing in new early childhood education centers on the outcomes of children that did not attend those centers. I find positive and economically significant spillover effects in the EDI domain of communication skills and general knowledge. Furthermore, never-enrolled children have also experienced an improvement in physical health and well-being. There is no evidence of significant effects on parenting practices and reduction in behavioral problems. The evidence suggests that spillovers are driven by individual interactions instead of interaction between centers.
1. Introduction
Over the past decade, countries have increased their investment in early childhood education (ECED) substantially. While many factors influence the growth and development of young children, the quality of center-based early childhood education plays an important role. The literature provides strong evidence for improving the quality of center-based early education programs as a means of investing in young children. Influential studies involving randomized control trials, such as Head Start Impact Studies, consistently show positive impacts of high-quality early education and care programs on children’s cognitive, social outcomes and school readiness (Burchinal et al. Citation1996; Karoly, Rebecca Kilburn, and Cannon Citation2006; Ludwig and Miller Citation2007; Zhai, Raver, and Jones Citation2012; García et al. Citation2020). However, little attention has been devoted to investigating whether the practices and knowledge in those better quality centers spread to other children who do not enroll in those centers.
The Government of Indonesia implemented the Indonesia ECED project in collaboration with the World Bank. The project’s primary goal is to improve children’s school readiness by expanding access to early childhood education in poor villages. The project was launched in 2009 and ended in 2013. Treated villages received an intervention package consisting of a block grant of approximately $18,000 to establish two new ECED centers and 200 hours of training for teachers in these centers. Since the requirement from the project is that only 20 percent of the funds can be spent on a new building, most of the newly established centers involved rehabilitating existing buildings. The villages generally provided the site of the centers, while the project funds were used to buy materials, pay teachers, and provide supplementary services (Nakajima et al. Citation2021). For a more elaborate explanation of the project and data collection, I refer the reader to Pradhan et al. (Citation2013), Jung and Hasan (Citation2016), and Brinkman et al. (Citation2017).
In this study, I attempt to estimate the spillover effects of investing in two ECED centers in a village on the outcomes of children that did not attend those centers. I use data from the Indonesia ECED project that contains information on about 4500 children in 310 poor villages in Indonesia over 2009–2013. I specifically examine spillover effects on two groups of children. First is the effects on those children enrolling at centers not financed by the program (regular centers). Second is the effects on those children who never enrolled at any ECED centers, either regular or project-supported centers. Children never formally enrolled in ECED centers go straight to primary school around the age of 6–7 years old.
This research is among the first empirical studies investigating spillover effects of investing in ECED centers on children who did not attend those centers. Relatively few studies have been designed with the explicit purpose of identifying spillover effects on untreated individuals. One exception is a recent paper by List, Momeni, and Zenou (Citation2019) that accounts for spillover effects of ECED intervention on the outcomes of disadvantaged children in the Chicago Heights Early Childhood Center (CHECC). The identification comes from exploiting the exogenous spatial variation in the number of child i’s neighbors residing within r kilometers that were randomly assigned to treatment. In contrast to List, Momeni, and Zenou (Citation2019), I quasi-experimentally identify spillover effects using matching methods. While List, Momeni, and Zenou (Citation2019) consider the interactions to happen within a certain radius, this paper limits the interactions within a village.
The empirical work takes into account selection at two levels. Villages receiving ECED investments are relatively poorer, and children enrolling at ECED centers come from households with a better socioeconomic background. The estimation method is a two-level application of matching techniques. Ferracci, Jolivet, and van den Berg (Citation2014), Girma et al. (Citation2015), and Girma, Görg, and Kersting (Citation2019) use a similar approach in a continuous treatment setting. The matching involves balancing pretreatment covariates using the entropy balancing method (Hainmueller Citation2012) and subsequently employing the weights from entropy balancing in a weighted regression method. To address selection at the individual level, I treat enrollment in regular ECED centers as the treatment variable. Then I estimate the relationship between an individual’s enrollment status and outcomes in treated and control villages separately. The predicted village-averaged outcomes for ever- and never- enrolled children from the first stage become the outcomes in the second stage. After netting out the bias from the selection to ECED enrollment, the second stage analysis uses village-level data and considers ECED investments as the treatment variable. The second stage aims to address selection into treatment at the village level. I generate weights to match treated and control villages and then use the weights in a weighted regression to investigate relationships between ECED investments and the outcome of interests.
I find that spillover effects lead to significant improvements in two out of five EDI domains, i.e. the domain of communication skills and general knowledge and the domain of physical health and well-being. Furthermore, the findings are consistent with no significant spillover effects on parenting practices and behavioral problems as measured by the Strength and Difficulties Questionnaire (SDQ).
The spillover effects significantly improved school readiness in communication skills and general knowledge for both children enrolled at regular centers and never enrolled children. Interestingly, the magnitude of this effect is the same for both groups of children, which varies between 0.58σ and 0.84σ. The magnitude is at par with List, Momeni, and Zenou (Citation2019), who find that a child’s cognitive scores from having treated neighbors will increase between 0.6σ and 0.7σ. Furthermore, never enrolled children also benefit in terms of improvement in the EDI domain of physical health and well-being, with effect sizes ranging from 0.52σ to 0.78σ. Similar improvements, unfortunately, were not experienced by children enrolled at regular centers.
Spillover effects from ECED investments can operate through two main channels. The first channel is through productivity spillovers from project-supported ECED centers to regular ECED centers, i.e. the center’s management and teacher share their acquired know-how with personnel from different centers. The second channel is through social interaction. Social interactions within a village can happen in a number of ways. Children who are never enrolled at any ECED centers may be indirectly affected by ECED investments through interaction with enrolled children (either those enrolled at regular or project-supported centers). Parental interactions can also transmit the effects through information and preference externalities, which in the end may influence child-rearing practices. In short, spillover effects on children enrolled at regular centers can operate through both channels mentioned above, while the effects on never-enrolled children primarily work through social interactions.
To shed light on the mechanisms through which spillover effects operate, I compare the size of spillover effects on children enrolled at regular centers and on never-enrolled children. If spillovers mainly work through interactions between centers, I might expect larger effects on children enrolled at regular centers. I find no statistically significant differences in spillover effects between children enrolled at regular centers and never-enrolled children. The evidence suggests that spillovers are not driven by the interaction between centers but rather by social interactions.
I conclude the analysis by measuring the total and overall effects of the intervention, which provide summary measures of the effects of ECED enrollment and spillover effects of ECED investments. The total effect is the sum of ECED enrollment and the effects of ECED investments on a child. The overall effect is the average effect being in the treated villages compared to being in control villages. Both total and overall effects are significant in two EDI domains: physical health and well-being and communication and general knowledge. The range of effects for overall and total effects are between 0.48σ – 0.73σ and 0.58σ – 0.89σ, respectively. The share of spillover to total effects is above 50 percent, which can be considered large. Lastly, I find that children attending project-supported centers receive the most from ECED enrollment and investments. When those children were dropped from the analysis, total effects diminished both in significance and magnitude.
The findings speak to two strands of literature. First, I contribute to the growing body of research measuring spillover effects from various interventions, for example, in the labor market (Ferracci, Jolivet, and van den Berg Citation2014; Gautier et al. Citation2018), foreign direct investment (Girma et al. Citation2015; Girma, Görg, and Kersting Citation2019), education (Giuri and Mariani Citation2013; Bentsen, Munch, and Schaur Citation2019), and early childhood (List, Momeni, and Zenou Citation2019). Second, I contribute to the literature on program scaling. Learning about spillover effects helps us to understand what to expect when scaling up the program. The spillover effects can substantially amplify or undermine the intended effects of a program. Here I find that spillover effects from ECED investment on improving school readiness are modest at minimum, as it only improves two out of five EDI domains. Furthermore, I do not find adverse spillover effects due to competition between centers. Since Indonesia has various local civic organizations, one might expect that informal information sharing may magnify the impact of ECED investments.
The remainder of this paper is structured as follows. Section 2 explains the landscape of ECED in Indonesia. Section 3 describes the estimation strategy. Section 4 describes the data and variables used in the study. I present the main findings in section 5. Section 6 explores the sensitivity of the results to unobserved confounders. Section 7 concludes the study.
2. Early Childhood Education and Development (ECED) in Indonesia
Early childhood education in Indonesia targets children from birth up to age six. It aims to provide appropriate stimuli to promote optimum growth and development of young children as a preparation to enter further education (Law No. 20 the Year 2003 on National Education System). Early childhood services can take eight different forms: kindergartens, Islamic kindergartens (Raudatul Athfal), Qur’anic kindergartens (Taman Kanak-Kanak Quran), playgroups (kelompok bermain), Integrated Health Service Unit (Posyandu), Toddler Family Group (Bina Keluarga Balita), ECED-Post (Pos-PAUD), and daycare centers.
presents different types of ECED provisions in Indonesia and their characteristics. These different ECED services have different emphasis and curricula. For example, Integrated Health Service Unit (Posyandu) provides services to monitor the growth and development of children below 5-year-old, gives mandatory immunizations, vitamin A capsules, and information regarding health and nutrition for (almost) free. Almost all Indonesian children (more than 95 percent) are members of Posyandu. Toddler family groups (Bina Keluarga Balita) provide information about parenting practices for children under five years old. In contrast, kindergartens, Islamic kindergartens, playgroups, ECED-posts, and daycare centers are center-based and focus on educating and stimulating young children through play-based methods. Qur’anic kindergartens, while categorized as one of the ECED services, focus more on learning how to read the Qur’an, not on the stimulation of growth and development of young children.
Table 1. ECED services in Indonesia.
The intensity of the programs vary, typically depending on the age of the child. Center-based programs usually have weekly meetings, once a week at minimum, with a duration of 2 until 6 hours for each session. Children aged 0–2, 2–4, 4–6 years old should have meetings at least 2, 6, and 15 hours per week, respectively (Citation2011a, Citation2011b, Citation2011c), except for daycare centers, which operate full day. On the other hand, Posyandu and Toddler Family Groups (Bina Keluarga Balita) operate less frequently, typically once a month (Citation2018, Citation2011d).
The information in is based on the official documents issued by the corresponding ministries. It should be noted that the regulations do not always fit with local preferences and realities. For example, while the minimum requirement for center-based teachers is at least having a bachelor’s degree, most ECED teachers in a rural setting have less than a bachelor’s degree. Finding teachers with bachelor’s degrees is difficult in an environment where most people only have primary education. Another example is that the distinction between playgroups and kindergarten is less clear-cut in practice. As displayed in Table 9 (Appendix A1), while kindergartens intended to serve children aged 4–6-year-old, some children younger than 4-year-old enter kindergartens instead of playgroups because of conditions such as service availability and family preferences.
In this research, ECED enrollment is defined for those children ever-enrolled at center-based ECED: playgroups, Islamic kindergartens, kindergartens, and ECED-posts. Posyandu membership is not considered an ECED enrollment in this study because the primary focus of Posyandu is on health and development monitoring, not on skill stimulation. Meanwhile, since the participation in Toddler Family Groups and daycare centers in the sample is minimal (less than 2 percent), I also ignore the involvement in those programs (Table 9 in Appendix A1).
3. Empirical methodology
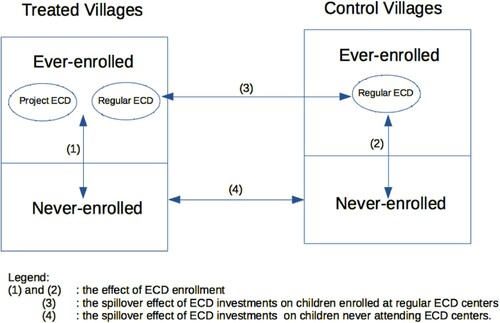
The main aim of the empirical exercise is to estimate spillover effects of ECED investments on children who enroll at regular ECED centers (center-based ECED without support from the project) and on children who never enrolled at any center-based ECEDs. Theoretically, the first effect is identifiable by comparing children attending regular centers in treated villages with similar children in control villages. Likewise, the second effect is identifiable by comparing similar children who never participated in ECED centers in treated versus control villages. I illustrate the idea using : arrows (3) and (4) measure the first and second types of spillover effects, respectively.
Figure 1. Graphical illustration of the method.
To allow for the presence of spillover effects, I follow a two-dimensional evaluation approach. I assume that individual potential outcomes are a function of his ECED attendance and the presence of ECED investments in his village. I adopt the notation that allows for interference (Hudgens and Halloran Citation2008). I denote potential outcomes as where i refers to the child and j refers to the village. Each child i belongs to village j.
is a binary indicator taking on a value of one if child i is enrolled in a regular ECED center and 0 otherwise. I also consider a binary treatment indicator
, which equals to 1 if village j received the ECED investments and 0 otherwise.
is defined as the potential outcome for child i if t and z are assigned to
and
, respectively. Thus, for example,
refers to the outcome of a child who enrolled at an ECED center in a control village. In principle, this notation allows for a total of
potential outcomes for each child. I follow the terminology of Halloran and Struchiner (Citation1995), who delineate different types of causal effects in the presence of interference. These four potential outcomes can be used to define several interesting estimates:
The effect of ECED enrollment (in regular centers) is the effect of ECED enrollment given
. This effect consists of two types:
The effect of enrollment (in regular centers) in treated villages,
The effect of enrollment in control villages,
Indirect (spillover) effect of ECED investments, which consist of:
The effect on children enrolled at regular ECED centers,
The effect on children never-enrolled at any ECED centers,
Total effects are the sum of enrollment effect and the spillover effect of ECED investments,
Overall effects are the average effect of being in the treated villages compared to being in control villages,
The design nevertheless relies on a simplified assumption that spillover is allowed within but not between villages, i.e. the village is assumed to be the likely network where the information is transmitted. This assumption in the literature is called partial interference (Sobel Citation2006) and randomized saturation design (Baird et al. Citation2018). Another critical assumption is the usual no selection on unobservables. To the extent that unaccounted unobservables are correlated with both the treatment and outcomes, the results could be biased.
The empirical approach proceeds in two steps to mimic a two-stage randomization design. In the first stage of randomization, some villages were randomly assigned to receive investments and the other villages to receive no investments. In the second stage, within each village, children were randomly assigned to enroll at regular centers. The empirical approach employed in this paper is similar to that of Ferracci, Jolivet, and van den Berg (Citation2014) and Girma, Görg, and Kersting (Citation2019). Both papers apply a multi-level propensity score matching to take into account selection at two levels. In contrast to this study, they employ the generalized propensity score method (Hirano, Imbens, and Ridder Citation2003) in the second stage since the treatment variable is continuous between 0 and 1.
This paper firstly estimates the relationship between a child’s ECED enrollment and outcomes in treated villages and control villages separately. After netting out the bias from the selection to ECED enrollment, I consider ECED investments as village-level treatment in the second step to estimate spillover effects.
3.1. First-step estimation
The goal is to estimate average potential outcomes for enrolled and never-enrolled children within each village, correcting for selection bias from the decision to enroll. For each , I run a technique that combines two methods. The first is the entropy balancing method developed by Hainmueller (Citation2012). The second is the weighted regression that regresses the outcome of interest on the treatment variable and covariates. The first involves computing weights that perfectly balances all observable pretreatment covariates
and
across the group of enrolled and never enrolled children within each
.
and
include both child and village characteristics, which list can be found in and , respectively. Since I balance village attributes across ever- and never-enrolled children, those children in similar villages are comparable. It means that the decision criteria to enroll a child is similar within z but different between z, where
. The estimated weights from entropy balancing are then used in the weighted regression method. For each
, I run the following regression:
(1)
(1) I denote the resulting estimates as
. The village specific average outcomes for the ever- and never-enrolled i.e.
and
can be expresed as:
(2)
(2) where
. It is easy to see that
is an estimate of the average effect of enrolling at regular ECED centers given the village’s treatment status. To investigate the spillover effects of ECED investments, I now turn to the second step of estimation.
Table 2. The difference in means of children enrolled at regular center versus children never enrolled at any ECED center, child and caregiver characteristics.
Table 3. Difference of means of treated versus control villages.
3.2. Second-step estimation
In the second step, I treat and
as the outcome variables and consider the presence of ECED investments in the village as the treatment variable. As such, the units of observation are no longer child i but village z. The estimation procedure is as follows:
Estimate the weights using entropy balancing to match treated and control villages.
Estimate the relationships between village-averaged outcomes and the presence of ECED investments in the village using weights from entropy balancing through the following weighted regressions:
4. The data
The impact evaluation data is in longitudinal form, collected in 2009 (baseline), 2010 (midline), and 2013 (end-line) on approximately 6895 children residing in 310 poor villages in 9 districts: three districts in Sumatera (Bengkulu, Sarolangun, and Lampung Timur), three districts in Java (Majalengka, Rembang, and Kulon Progo), one district in West Kalimantan (Ketapang), one district in South Sulawesi (Sidenreng Rappang), and one district in West Nusatenggara (Lombok Tengah). Districts vary in poverty, remoteness, population density, and service access. Ketapang is the most remote, and Lombok Tengah is the poorest. Since the sampled districts are not random, the sample can not be considered nationally representative.
Each sampled villages consist of about five sub-villages on average. The project-supported centers were located in two sub-villages, which did not have center-based ECED in 2009 (baseline). However, it was expected that all children throughout the village utilized the services (Pradhan et al. Citation2013). At baseline, the most commonly seen services are Posyandu. The next common services are kindergartens and playgroups. On average, there are two kindergartens and two playgroups in each village, which are almost entirely privately funded and require fees from parents. Together with the new centers supported by the project, each village has around six to seven center-based ECED.
The data contains the sample of children, caregivers, village-head, households, and early childhood education providers. The villages were selected based on poverty rate, a sufficiently large population of children aged 0–6-year-old, and the village’s willingness to contribute to the project. In the analysis, pretreatment characteristics come from the 2009s survey, while outcome variables are from the 2013s survey.
Enrolled children in the analyses are those children who participated in regular centers between 2009 and 2013. The sample of children attending project-supported centers is dropped because the comparison is made between children attending regular centers in treatment versus control villages when measuring spillover effects on ever-enrolled children (see , arrow (3)). As a result, the total number of observations in the analysis sample drops to 4485. The binary enrollment variable is constructed from 2013s survey that contains retrospective information on children’s enrollment histories since 2008. Since there are many types of regular ECED centers, the identified effect is the average effect of ECED enrollment across types. Once the children enter ECED centers, the participation is mostly uninterrupted until the children reach primary school age at 6–7-year old (drop out cases are rare).
Two cohorts of children were sampled at baseline, the one-year-old and four-year-old cohorts. Since I pool children across cohorts, I use the measurements that assess the same set of skills for the two cohorts. The items within the measurements may vary as those are targeted for different age groups. For example, I include gross motor skills but not socio-emotional skills since the measurement for the latter is unavailable for the two cohorts.
I include the following pretreatment scores: home activities, gross-motor, soft-motor, language, card-sorting task, drawing, parenting score, and Kessler 10 to account for the innate ability of the child. The outcome variables of interest are the total score of parenting practices (good parenting scores), the total difficulties score obtained from the Strength and Difficulties Questionnaire (SDQ), and the score from each of five domains of the Early Development Indicators (EDI). The detail of the measures can be found in Appendix A2. To pool the scores across ages, I use the residuals of the regressions of the total score on a child’s age and age squared at the time of the tests. These residuals were then standardized using the mean and standard deviation of the residuals of the never-enrolled children.
I explore the robustness of the estimates in two ways. First, I employ entropy balancing (eb) and inverse probability weighting (ipw) to generate weights. Entropy balancing is preferred because it ensures a perfect balance of pretreatment covariates across control and treatment groups. Second, I use short (47 items) and long versions (104 items) of EDI to check the robustness against measurement errors. I also construct a dummy variable whether the child scored at the lowest 10th percentile in each EDI domain. Thus, for each EDI domain, I have three variables measuring the same aspect of school readiness. However, this inflates the number of the outcome variables into 24 variables and raises the likelihood of false rejections (type 1 errors). In other words, the significant effects may be observed by chance and not represent the true effects.
To reduce the likelihood of false rejections of the null hypothesis, I conduct multiplicity adjustment in the regression analysis. I apply the adjustment on the seven outcomes considered together: total score on parenting practices, total difficulties score from the SDQ, and the score of each of the five EDI domains from the long questionnaire. Applying multiplicity adjustment to 24 outcomes would produce unnecessary reductions in statistical power. The significance of the grouped scores provides confirmatory evidence of the significance of the effects on a particular domain. If the impact on the grouped measure is not statistically significant, it is not necessary to examine the statistical significance of the sub-scores. In effect, the estimates on subscores of parenting practices, SDQ, the short version of the EDI, and the dummy variable of having the 10th lowest EDI scores are not presented in the regression tables as long as the aggregate estimates are not statistically significant after multiplicity adjustment.
4.1. Descriptive statistics
Below, I present mean comparison tests of pretreatment variables for the following groups: (1) ever- and never- enrolled children as shown by and (2) treated and control villages as shown by . panels A and B list child, caregiver, and household pretreatment variables, while panel C lists outcome variables. Village-level attributes are reduced into several indices. All the indices are standardized. A brief description of the instruments and variable creation is detailed in Appendices A2 and A3.
shows that enrolled children have better background characteristics. Their caregivers have higher completed formal education, practice better parenting quality (as demonstrated by parenting scores), and are less prone to stress and depression (as shown by Kessler 10). They live in wealthier households that could provide a more enriched home environment. Their pretreatment nutritional status and skills are also more advanced than never enrolled children. Not only that, enrolled children perform better in most outcome measures (, panel C).
shows that sampled villages are poor; around 50 percent of their inhabitants live in poverty. Treated villages have a significantly higher percentage of low-income families. Moreover, children from treated villages appear to be worse off than children from control villages in terms of reading fluency of caregivers, household wealth index, and home activities scores (Table 10, Appendix A5). By construction, treated villages are the poorest localities, while the left out villages (control villages) are less poor than treated villages.
5. Results
5.1. Covariate balance
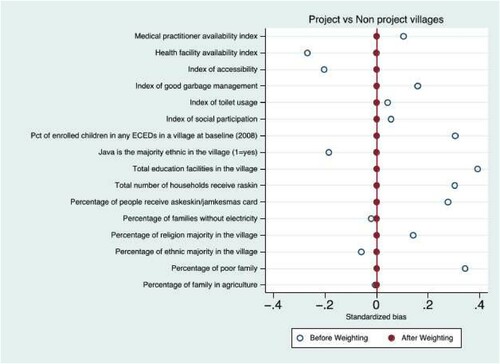
In the entropy balancing method, covariates balance is achieved by design. However, below diagnostic graphs are presented to assess covariate balance pre and post-matching for completeness. show the standardized bias demonstrating the balance before and post weighting. and show the case for ever- and never-enrolled children in control and treated villages, respectively. shows the balance of covariates across treated and control villages. All figures show that the standardized percentage bias between the two groups reduced drastically after weighting.
Figure 2. Covariate balance before and after weighting for ever- and never-enrolled children in control villages.
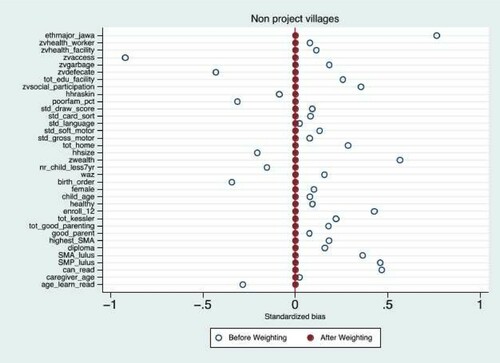
Figure 3. Covariate balance before and after weighting for ever- and never- enrolled children in treated villages.
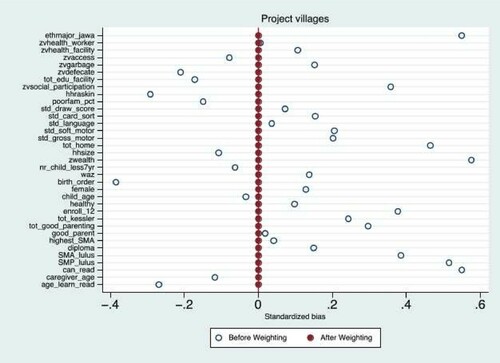
Figure 4. Covariate balance of village level covariates before and after weighting across treated and control villages.
5.2. First-stage estimation
Before turning to the main results, consider the results of the first-stage estimation presented in . Columns (1)–(2) and (3)–(4) present the estimates of enrollment effect in treated and control villages, respectively. While columns (1) and (3) present estimates from the entropy balancing (EB) method, columns (2) and (4) display the estimates from inverse probability weighting (IPW). Standard errors are clustered at the village level and reported in parentheses below each point estimate.
Table 4. First-stage estimation: the effects of ECED enrollment within treated and control villages.
To minimize Type I errors when conducting multiple hypothesis tests with correlated outcome variables, I apply Meff correction, a Family-Wise Error Rate (FWER) adjustment method without the assumption of independence test, i.e. the adjustment allows for correlated outcome variables. Meff is developed and validated in genetics (Cheverud Citation2001; Nyholt Citation2004) and is frequently used in Psychology (Derringer Citation2018).Footnote1 The adjustment rejects the null hypothesis if the p-value is less than , where
is the corrected significance level. In and all the regression tables that follow, the sign # indicates the rejection of the null hypothesis with the corrected significance level,
. For example, the Meff in the sub-sample of control villages is 6.401. Thus, the corrected significance level for that sub-sample for α equals to 0.1; 0.05; and 0.01 is 0.1/6.401 = 0.0156 ; 0.05/6.401 = 0.0078; and 0.01/6.401 = 0.00156, respectively. The null hypothesis is rejected if the p-value is less than
.
shows that enrollment effects are heterogeneous across treated and control villages. The results show that the effects of enrollment in regular centers are not statistically independent of the village’s treatment status. Many of these enrollment effects are insignificant. In line with the existing literature, I do not document any significant adverse effects of ECED enrollment (for a recent summary, see Tanner, Candland, and Odden [Citation2015]). I find that ECED enrollment improves school readiness in control villages but not in treated villages, particularly in the domain of language and cognitive development. The estimates from EB and IPW methods are also similar in magnitude.
The differences in the impact of ECED enrollment across treated and control villages illustrate one of the challenges in making comparisons directly within treated or control villages when spillover effects are present. The estimates fail to account for potential externalities for never-enrolled children. If the analysis were limited to treated villages only, the evidence would suggest that ECED enrollment has little effect. It can be the case that never-enrolled children also benefit through spillover effects, and the estimates may understate the benefits of enrollment. Children enrolled in ECED centers (and their parents) may transmit knowledge to the never-enrolled group. The issue here is that enrollment effects can depend on the village treatment status due to interference between individuals. Ali et al. (Citation2005) and Halloran and Hudgens (Citation2012) noted a similar phenomenon in the context of vaccine efficacy.
To test more formally whether spillover effects exist and to measure their magnitude, I investigate the link between children’s average outcomes and a village’s treatment status through the second-stage analysis.
5.3. The second-stage estimation: spillover effects of ECED investments
Before presenting results from the second-stage analysis, I compare the outcomes of children enrolled in regular centers and never-enrolled children in treated versus control villages (Table 10 in Appendix A5, Panel C columns (3) and (6)). Based on these naïve differences in mean analysis, the evidence of spillover effects is mixed. Spillover effects for children enrolled at regular centers are negative and significant on the EDI domains of social competence and communication and general knowledge. By way of contrast, the effects are positive and significant for never-enrolled children on SDQ total difficulties score, EDI domain of physical health and well-being, and EDI emotional maturity.
The main results of the second-stage regression are presented in . Columns (1) and (2) show the spillover effects on the outcomes of children enrolled at regular centers using EB and IPW methods, respectively (corresponds to arrow (3) in ). Columns (3) and (4) show the spillover effects on never-enrolled children from EB and IPW methods, respectively (corresponds to arrow (4) in ).
Table 5. Second-stage estimation, spillover effects of ECED investments on enrolled and never-enrolled children.
At a minimum, the estimates suggest that the spillover effects of ECED investments are modest overall. The effects matter significantly on two out of seven outcomes considered in the analysis. Specifically, ECED investments improve the school readiness of the group of children attending regular centers and the group of never-enrolled children in the EDI domain of communication and general knowledge. Interestingly, these effects affect both groups of children of similar magnitude (, columns (5) and (6) show that there are no significant differences of spillover effects on ever- and never- enrolled children). The range of effect on this domain varies between 0.53σ and 0.84σ, which is economically large.
Furthermore, the improvement in the EDI domain of physical health and well-being is felt by never-enrolled children, but not by those children enrolled in regular centers.Footnote2 Similar to the effect on the domain communication and general knowledge, the effect size is large, between 0,57σ and 0,65σ. These findings are robust to the choice of EDI instrument (either long or short version of EDI, results not shown) and the weights being chosen (either from EB or IPW). In contrast with the naive difference in means analysis, I do not document negative spillover effects.
To explore the mechanism that drives the spillover effects, I conjecture that child i may benefit from ECED investments through two channels. The first channel is through direct social interaction: child k (and/or his parent) may influence the behavior and decision of child i (and or his parent), which may in turn shape i’s development. The second channel is through interaction between ECED centers (productivity spillover), which operates through two routes. First, project-supported centers may transfer knowledge and best practices to regular ECEDs, either voluntarily or involuntarily. Secondly, project-supported centers may compete with regular centers for the same pool of resources and students, negatively impacting children attending regular centers. Indeed there has been some evidence that project-supported centers crowded out students from the regular centers, possibly due to the low subsidized tuition of the project-supported centers (Hasan, Hyson, and Chang Citation2013; Brinkman et al. Citation2017).Footnote3 Thus, I infer that spillover effects on children enrolled at regular centers may be driven by social and center interactions, while the effects on never-enrolled children are mainly driven by social interaction.
To shed light on which channel generates stronger effects, in columns (5) and (6), I compare spillover effects between children enrolled at regular centers and never-enrolled children. If spillovers mainly operate from the interaction between centers, then it is expected that the effects on enrolled children (columns (1) and (2)) are significantly larger than on never-enrolled children (columns (3) and (4)). Alternatively, larger spillover effects on never-enrolled children could imply that social interaction plays an important role in generating the effects. I find no statistically significant differences in spillover effects between children enrolled at regular centers and never-enrolled children (see columns (5) and (6)). The result suggests that interaction between centers plays a minor role in generating spillover effects. The evidence is more consistent with the hypothesis that social interactions mainly drive spillover effects.
5.4. Total and overall effects
Total and overall effects provide summary measures of the enrollment and spillover effects, the results of which are shown in . The first and last two columns of present the overall and total effects estimates, respectively. It can easily be checked that total effects can be parsed into enrollment effects () and spillover effects () – for example, the coefficients in col. (3) are generated from col. (1) and col. (3).
Table 6. Overall and total effects of ECED investments.
Focusing on overall effects, residing in treated villages improves school readiness in two domains: physical health and well-being and communication and general knowledge. The range of effects is between 0.48σ and 0.73σ. Likewise, total effects are statistically significant in the same two EDI domains, with a range of effects estimated between 0.58σ and 0.89σ. Note that the ratio of spillover effects to total effects is above 50 percent, which is relatively large. The finding suggests that a large portion of the total impact is due to the network effects that emerge from interactions with other treated individuals.
5.5. The difference in performance across project-supported and regular ECED centers
This section explores whether children attending project-supported centers have better outcomes than those attending regular centers. Comparing the means of selected variables between children attending project-supported and regular centers shows that (see Table 11, appendix A5), on average, children in regular centers have a better socioeconomic background than those in project-supported centers: they live in wealthier and less crowded households and had more educated caregivers. Table 11 also shows that children in project-supported centers have significantly worse outcomes than those in regular centers in terms of total difficulty scores and three out of five EDI domains, possibly due to having worse socioeconomics backgrounds.
In the following specification, the sample is restricted to those ever-enrolled children in treated villages. Children in project-supported centers are matched with children in regular centers. The weights from matching are then used in the following weighted regression:
(4)
(4) where
is a dummy variable that takes on value 1 if child i attended the project-supported center and 0 if child i attended the regular center. θ captures the effect of being enrolled in project-supported centers, the estimates of which are presented in . Columns (1) and (2) are estimates from EB and IPW, respectively. The table shows that children in project-supported centers have more socioemotional risk or negative behaviors than those in regular centers as indicated by their total difficulty scores.
Table 7. The difference in performances across project-supported and regular centers.
Both descriptive statistics and weighted regressions demonstrate that children in project-supported centers do not necessarily have better outcomes than those in regular centers. However, it does not imply that project-supported centers have worse quality than regular centers since the actual effects may be understated due to spillover effects.
Alternatively, I return to the two-step procedure to examine the performance of project-supported centers. Columns (3)–(4) and (5)–(6) in report the total effects of ECED intervention excluding and including those children who enrolled at project-supported ECED centers, respectively. It is easy to see that children in the project-supported centers push the total effects up. When those children were taken out from the analysis, total effects diminished both in significance and magnitude. The finding suggests that children enrolled in project-supported centers receive the most benefits generated from both ECED enrollment and ECED investments.
Project-supported centers have higher quality than regular centers in the domain of physical infrastructure, program structure, students’ activities, interactions, and personal care and routines, as shown by ECERS-S score (Early Childhood Environment Rating-Scale-Revised).Footnote4 Project-supported centers met or exceeded local standards for quality (Brinkman et al. Citation2017). As mentioned above, project-supported centers are located in renovated buildings that were designed specifically for ECED centers. The toys and learning materials are brand new and more varied. Moreover, teachers in project centers received intensive training for 200 hours, which was very intensive compared to the training typically offered by other programs at that time. Thus, it is reasonable to expect that project centers are more effective in improving children’s outcomes than regular centers.
6. Sensitivity analysis
This section examines the sensitivity of the empirical findings to any unobserved confounders. The sensitivity test follows Oster (Citation2019). I focus on the sensitivity tests for the first stage, i.e. whether the significance would be altered by additional adjustment for unmeasured confounders. The second stage of the estimation does not depart significantly from the existing research that used the same data set (Jung and Hasan Citation2016; Brinkman et al. Citation2017). One of the central assumptions of the analysis is that receiving the ECED grants can be considered as good as random, conditionally on the set of village’s level covariates, . The validity of this assumption can be assured since the village’s selection into treatment is based on the village’s scoring indicator that consists of the highest number of children aged 0 to 6 years old, high poverty rates, and high population density.Footnote5 Since that information is already contained in
, the bias in the second stage becomes less of an issue.
Oster (Citation2019) points out that the test assumes that the bias from observed characteristics is informative about the bias from unobservables. As controls are added, the magnitude of change in the R-square is informative for the level of observable selection in the sample, and by assumption, for the potential level of unobserved selection as well.
columns (3) and (6) show the bounds of enrollment effects with the assumption that the coefficient of proportional selection on unobservables relative to observables, δ, is equal to 1 and Rmax = 1.3*.Footnote6 The corresponding Rmax are reported in columns (1) and (4). The recommended sets displayed in columns (3) and (6) safely exclude zero, which means that omitted variable bias is unlikely to drive the effect of ECED enrollment. Columns (2) and (5) report delta, δ, assuming Rmax equals the number displayed in columns (1) and (4). Generally, the delta of 1 or more implies that the relationship is unlikely to be explained by omitted variable bias. I find that selection on unobservables would have at least two times as powerful as the selection on observables to zero-out the estimated effects of ECED enrollment. The results are encouraging, as this implies that the significant enrollment effects are unlikely to be due to omitted variables.
Table 8. Sensitivity analysis for significant coefficients in the first-stage regression.
7. Conclusion
This paper measures the spillover effects of ECED investments in poor villages in Indonesia. The investment is manifested through establishing two new ECED centers in the chosen village, including teacher training in those centers. I measure the effectiveness of such types of investments on the outcomes of children who did not attend project-supported centers: children who attended regular (not supported by the project) centers and children who never attend center-based ECED programs as they go straight to primary school. The empirical work considers selection at two levels: a child self selects to enroll at ECED centers, and the village is chosen to receive ECED investments. Measuring spillover effects is possible because the data contains villages that are not received ECED investments at all.
I find limited evidence of the presence of spillover effects. I fail to reject the null hypothesis of no spillover effects when accounting for multiple hypothesis tests on the practices of parenting and the reduction of behavioral problems as measured by the SDQ. I obtain significant spillover effects on two out of five EDI outcomes. Formal estimation confirms that the benefits of ECED investments spilled over both to children attending regular centers and to children who were never attending ECED centers. On average, children never attending ECED centers experienced improvements in two domains of school readiness: physical health and well-being and communication and general knowledge, while children enrolled in regular centers only experienced improvements in communication and general knowledge. The range of spillover effects varies between 0.48σ and 0.89σ. The empirical results also suggest that spillovers are not driven by spillovers between centers, but rather by social interactions. The share of spillover effects to total effects is large. It is above 50 percent for all significant outcomes in this study. In conclusion, the empirical evidence supports the argument that spillover effects are significant in some dimensions. For the majority of outcomes considered in this study, I do not find significant spillover effects.
The findings are consistent with the literature on the neighborhood’s influence on the readiness to learn of very young children in the USA and Canada. Strong neighborhood effects have typically been found in cognitive outcomes (the EDI domains of language and cognitive development and communication and general knowledge) and the EDI domain of physical health and well-being than behavioral and social outcomes (the EDI domains of emotional health and maturity and social knowledge and competence). Lapointe, Ford, and Zumbo (Citation2007) and Cushon et al. (Citation2011) found that the physical health and well-being domain is the most sensitive to the neighborhood characteristics than other EDI domains. On the other hand, Oliver et al. (Citation2007) found that communication skills and general knowledge is ‘strongly neighbourhood-based’, in which the percentage of individuals with English as a Second Language (ESL) status show the strongest relationship with the communication skills and general knowledge.
Why were spillover effects observed on the communication skills and general knowledge and the physical health and well-being but not on the other outcomes? The domain of communication skills and general knowledge measures communication proficiency in the language of instruction at school, Bahasa Indonesia. Bahasa Indonesia, being the official national language, is not the mother tongue of most Indonesians. Local languages (Indonesia has 781 such languages) are preferred in social and informal settings. In fact, only 5.5% of caregivers use Bahasa Indonesia as the primary language in the sample, while the rest use local languages or the mix of Bahasa Indonesia and local languages. Never enrolled children particularly have little opportunity or need to develop skills in Bahasa Indonesia because their surroundings conduct daily life in another language. The finding, however, suggests that neighborhoods with more people who are frequently exposed to Bahasa Indonesia will have children with greater communication skills, as demonstrated by improvement in communication skills and general knowledge. Since this finding is consistent with the neighborhood-effect research carried out in Canada (Oliver et al. Citation2007), this suggests that the spillover (neighborhood) effects are not unique to a single context.
The significant spillover effect found in the EDI domain of physical health and well-being could be due to the concrete nature of this measureFootnote7 compared to the more complex measure captured in other EDI domains (Cushon et al. Citation2011). The improvement is significant only for the group of never-enrolled children but not for the group of enrolled children. The domain of physical health and well-being is susceptible to the deprivation in socioeconomic status (Brooks-Gunn Citation1997). Since the group of never-enrolled children is worse off in many socio-economic aspects than the enrolled group (), new ECED centers improve the physical health and well-being of the more disadvantaged group in the neighborhood.
Overall, studying spillover effects of ECED investments is crucial to designing effective policies for at least two reasons. First, it helps us to understand what to expect when implementing a program at the national level. For example, as the finding suggests that the program has sizeable spillover effects on communication skills and general knowledge, the community-based program which gives young children the opportunity to engage in activities using Bahasa Indonesia (such as reading and storytelling) may be effective in improving the communication skills dimension of readiness to learn. The significant spillover effect on communication and general knowledge is perhaps not surprising since Indonesia has various local civic organizations that enable informal information sharing, such as save and borrow group, cooperative, and youth group. Second, the finding can provide feedback for policymakers on whether the current strategy of investing in a few ECED centers in poor villages is cost-effective. The study finds that all children in the village can potentially benefit from the ECED investment regardless of whether the actual children attend the project-supported centers or not. The evidence agrees with the rationale that the strategy that targets poor villages with a low ECED enrollment rate is a cost-effective policy.
Acknowledgment
The data used in this study is from the Impact Evaluation Baseline (2009), Midline (2010), and Endline (2013) survey, which collection was partially funded by the Government of the Kingdom of the Netherlands through the Dutch Education Support Program Trust Fund (TF057272). I want to thank Menno Prasad Pradhan, Chris Elbers, and two anonymous referees for detailed feedback on an earlier version of this paper.
Disclosure statement
No potential conflict of interest was reported by the authors.
Additional information
Funding
Notes
1 Meff calculation is based on eigenvalues of the outcomes correlation matrix, as shown by the formula: , where k is the number of outcome variables and λ is a vector of eigenvalues of length k.
2 Without the multiplicity adjustment, the EDI domain of physical well-being is significant at a 10 percent significance level for the group of ever-enrolled children. The significance is gone after the adjustment.
3 It is less likely that project-supported ECEDs are actively prevented the leakage of know-how to regular ECEDs, thus reducing the potential spillovers.
4 ECER-S is an instrument that measures observed classroom quality, such as space and furnishings, personal care and routine, language reasoning, activities, interactions, and program structure (Harms, Clifford, and Cryer Citation1998).
5 The evidence of which can be seen in the aforementioned articles.
6 Delta equals to one means that the unobservables are at least as important as unobservables in explaining the outcome of interest. Rmax is the maximum R-squared form a hypothetical regression of the outcome on treatment, observed, and unobserved controls. is the regression of the outcome on treatment and observed covariates (controlled regresssion). The cutoff value
is chosen as it allows at least 90 percent of randomized results to survive (Oster Citation2019).
7 The domain of physical health and well-being evaluates gross and fine motor skills and the child’s independence in looking after his or her own hygienic needs.
References
- Ali, Mohammad, Michael Emch, Lorenz von Seidlein, Mohammad Yunus, David A. Sack, Malla Rao, Jan Holmgren, and John D. Clemens. 2005. “Herd Immunity Conferred by Killed Oral Cholera Vaccines in Bangladesh: A Reanalysis.” The Lancet 366 (9479): 44–49. doi:10.1016/S0140-6736(05)66550-6.
- Baird, Sarah, J. Aislinn Bohren, Craig McIntosh, and Berk Özler. 2018. “Optimal Design of Experiments in the Presence of Interference.” The Review of Economics and Statistics 100 (5): 844–860. doi:10.1162/rest_a_00716.
- Bentsen, Kristian Hedeager, Jakob R. Munch, and Georg Schaur. 2019. “Education Spillovers Within the Workplace.” Economics Letters 175 (February): 57–59. doi:10.1016/j.econlet.2018.11.025.
- Brinkman, Sally Anne, Amer Hasan, Haeil Jung, Angela Kinnell, and Menno Pradhan. 2017. “The Impact of Expanding Access to Early Childhood Education Services in Rural Indonesia.” Journal of Labor Economics 35 (S1): S305–S335. doi:10.1086/691278.
- Brooks-Gunn, Jeanne. 1997. Neighborhood Poverty: Context and Consequences for Children. New York: Russell Sage Foundation.
- Burchinal, Margaret R., Joanne E. Roberts, Laura A. Nabors, and Donna M. Bryant. 1996. “Quality of Center Child Care and Infant Cognitive and Language Development.” Child Development 67 (2): 606–620. doi:10.2307/1131835
- Cheverud, James M. 2001. “A Simple Correction for Multiple Comparisons in Interval Mapping Genome Scans.” Heredity 87 (1): 52–58. doi:10.1046/j.1365-2540.2001.00901.x.
- Cushon, Jennifer A., Lan T. H. Vu, Bonnie L. Janzen, and Nazeem Muhajarine. 2011. “Neighborhood Poverty Impacts Children’s Physical Health and Well-Being Over Time: Evidence from the Early Development Instrument.” Early Education & Development 22 (2): 183–205. doi:10.1080/10409280902915861.
- Derringer, Jaime. 2018. “A Simple Correction for Non-Independent Tests,” March. https://osf.io/re5w2/.
- Direktorat Pembinaan Pendidikan Anak Usia Dini. 2011a. Petunjuk Teknis Penyelenggaraan Kelompok Bermain. Jakarta: Kementrian Pendidikan Nasional.
- Direktorat Pembinaan Pendidikan Anak Usia Dini. 2011b. Petunjuk Teknis Penyelenggaraan Taman Kanak-Kanak. Jakarta: Kementrian Pendidikan Nasional.
- Direktorat Pembinaan Pendidikan Anak Usia Dini. 2011c. Petunjuk Teknis Penyelenggaraan Taman Penitipan Anak. Jakarta: Kementrian Pendidikan Nasional.
- Direktur Jenderal Pemberdayaan Masyarakat dan Desa. 2011d. Pedoman Umum Pengelolaan Posyandu. Jakarta: Kementrian Kesehatan.
- Ferracci, Marc, Grégory Jolivet, and Gerard J. van den Berg. 2014. “Evidence of Treatment Spillovers Within Markets.” Review of Economics and Statistics 96 (5): 812–823. doi:10.1162/REST_a_00428.
- García, Jorge Luis, James J. Heckman, Duncan Ermini Leaf, and María José Prados. 2020. “Quantifying the Life-Cycle Benefits of an Influential Early-Childhood Program.” Journal of Political Economy 128 (7): 2502–2541. doi:10.1086/705718.
- Gautier, Pieter, Paul Muller, Bas van der Klaauw, Michael Rosholm, and Michael Svarer. 2018. "Estimating Equilibrium Effects of Job Search Assistance.” Journal of Labor Economics 36 (4): 1073–1125. doi:10.1086/697513.
- Girma, Sourafel, Yundan Gong, Holger Görg, and Sandra Lancheros. 2015. “Estimating Direct and Indirect Effects of Foreign Direct Investment on Firm Productivity in the Presence of Interactions between Firms.” Journal of International Economics 95 (1): 157–169. doi:10.1016/j.jinteco.2014.11.007.
- Girma, Sourafel, Holger Görg, and Erasmus Kersting. 2019. “Which Boats Are Lifted by a Foreign Tide? Direct and Indirect Wage Effects of Foreign Ownership.” Journal of International Business Studies 50 (6): 923–947. doi:10.1057/s41267-019-00248-2.
- Giuri, Paola, and Myriam Mariani. 2013. “When Distance Disappears: Inventors, Education, and the Locus of Knowledge Spillovers.” Review of Economics and Statistics 95 (2): 449–463. doi:10.1162/REST_a_00259.
- Hainmueller, Jens. 2012. “Entropy Balancing for Causal Effects: A Multivariate Reweighting Method to Produce Balanced Samples in Observational Studies.” Political Analysis 20 (1): 25–46. doi:10.1093/pan/mpr025.
- Halloran, M. Elizabeth, and Michael G. Hudgens. 2012. “Causal Inference for Vaccine Effects on Infectiousness.” The International Journal of Biostatistics 8 (2): 1–40. doi:10.2202/1557-4679.1354.
- Halloran, M. Elizabeth, and Claudio J. Struchiner. 1995. “Causal Inference in Infectious Diseases.” Epidemiology 6 (2): 142–151. doi:10.1097/00001648-199503000-00010.
- Harms, Thelma, Richard M. Clifford, and Debby Cryer. 1998. Early Childhood Environment Rating Scale. Revised ed. New York, NY: Teachers College Press, Columbia University.
- Hasan, Amer, Marilou Hyson, and Mae Chu Chang. 2013. Early Childhood Education and Development in Poor Villages of Indonesia: Strong Foundations, Later Success. World Bank Publications. The World Bank. https://ideas.repec.org/b/wbk/wbpubs/15799.html.
- Hirano, Keisuke, Guido W. Imbens, and Geert Ridder. 2003. “Efficient Estimation of Average Treatment Effects Using the Estimated Propensity Score.” Econometrica 71 (4): 1161–1189. doi:10.1111/1468-0262.00442.
- Hudgens, Michael G., and M. Elizabeth Halloran. 2008. “Toward Causal Inference with Interference.” Journal of the American Statistical Association 103 (482): 832–842. doi:10.1198/016214508000000292.
- Jung, Haeil, and Amer Hasan. 2016. “The Impact of Early Childhood Education on Early Achievement Gaps in Indonesia.” Journal of Development Effectiveness 8 (2): 216–233. doi:10.1080/19439342.2015.1088054.
- Karoly, Lynn A., M. Rebecca Kilburn, and Jill S. Cannon. 2006. Early Childhood Interventions: Proven Results, Future Promise. California: Rand Corporation.
- Kepala Badan Kependudukan dan Keluarga Berencana Nasional. 2018. Pengelolaan Bina Keluarga Balita Holistik Integratif (BKB HI). Vol. 12.
- Lapointe, Vanessa R., Laurie Ford, and Bruno D. Zumbo. 2007. “Examining the Relationship Between Neighborhood Environment and School Readiness for Kindergarten Children.” Early Education & Development 18 (3): 473–495. doi:10.1080/10409280701610846.
- List, John A., Fatemeh Momeni, and Yves Zenou. 2019. “Are Estimates of Early Education Programs Too Pessimistic? Evidence from a Large-Scale Field Experiment That Causally Measures Neighbor Effects.” SSRN Electronic Journal. doi:10.2139/ssrn.3385107.
- Ludwig, Jens, and Douglas L. Miller. 2007. “Does Head Start Improve Children’s Life Chances? Evidence from a Regression Discontinuity Design*.” The Quarterly Journal of Economics 122 (1): 159–208. doi:10.1162/qjec.122.1.159.
- Nakajima, Nozomi, Amer Hasan, Haeil Jung, Angela Kinnell, Amelia Maika, and Menno Pradhan. 2021. “Built to Last: Sustainability of Early Childhood Education Services in Rural Indonesia.” The Journal of Development Studies 57 (0): 1593–1612. doi:10.1080/00220388.2021.1873283.
- Nyholt, Dale R. 2004. “A Simple Correction for Multiple Testing for Single-Nucleotide Polymorphisms in Linkage Disequilibrium with Each Other.” The American Journal of Human Genetics 74 (4): 765–769. doi:10.1086/383251.
- Oliver, Lisa N., James R. Dunn, Dafna E. Kohen, and Clyde Hertzman. 2007. “Do Neighbourhoods Influence the Readiness to Learn of Kindergarten Children in Vancouver? A Multilevel Analysis of Neighbourhood Effects.” Environment and Planning A: Economy and Space 39 (4): 848–868. doi:10.1068/a37126.
- Oster, Emily. 2019. “Unobservable Selection and Coefficient Stability: Theory and Evidence.” Journal of Business & Economic Statistics 37 (2): 187–204. doi:10.1080/07350015.2016.1227711.
- Pradhan, Menno, Sally A. Brinkman, Amanda Beatty, Amelia Maika, Elan Satriawan, Joppe de Ree, and Amer Hasan. 2013. “Evaluating a Community-Based Early Childhood Education and Development Program in Indonesia: Study Protocol for a Pragmatic Cluster Randomized Controlled Trial with Supplementary Matched Control Group.” Trials 14 (1): 259. doi:10.1186/1745-6215-14-259.
- Sobel, Michael E. 2006. “What Do Randomized Studies of Housing Mobility Demonstrate?” Journal of the American Statistical Association 101 (476): 1398–1407. doi:10.1198/016214506000000636.
- Tanner, Jeffery, Tara Lynn Candland, and Whitney Swan Odden. 2015. “Impacts of Interventions during Early Childhood on Later Outcomes : A Systematic Review.” Working Paper. The World Bank. https://repositorio.minedu.gob.pe/handle/20.500.12799/3581.
- Zhai, Fuhua, C. Cybele Raver, and Stephanie M. Jones. 2012. “Academic Performance of Subsequent Schools and Impacts of Early Interventions: Evidence from a Randomized Controlled Trial in Head Start Settings.” Children and Youth Services Review 34 (5): 946–954. doi:10.1016/j.childyouth.2012.01.026.