
 ?Mathematical formulae have been encoded as MathML and are displayed in this HTML version using MathJax in order to improve their display. Uncheck the box to turn MathJax off. This feature requires Javascript. Click on a formula to zoom.
ABSTRACT
Inefficient targeting of students at risk of dropping out might explain why dropout-reducing efforts often have no or mixed effects. In this study, we present a new method which uses a series of machine learning algorithms to efficiently identify students at risk and makes the sensitivity/precision trade-off inherent in targeting students for dropout prevention explicit. Data of a Dutch vocational education institute is used to show how out-of-sample machine learning predictions can be used to formulate invitation rules in a way that targets students at risk more effectively, thereby facilitating early detection for effective dropout prevention.
1. Introduction
The increase in tertiary education enrollment by more than 10 percentage points in many countries since the turn of the millenium (Altbach, Reisberg, and Rumbley Citation2009; OECD Citation2014) has been accompanied by an increase in student dropout (OECD Citation2010) and by more students switching between educational programs in – or after – their first year (Dynarski Citation2008). Since dropout is generally undesirable for both students and institutions alike, vast efforts are made to prevent student dropout and to guide students towards a program that provides a better match in terms of capabilities and preferences (Freeman and Simonsen Citation2015; Rumberger and Lim Citation2008). Even when dropout is desirable (e.g. due to learning or better outside options), it is still important to identify all potential dropouts at an early stage, so that it can be determined whether there is an (un)desirable threat of dropout and appropriate action can be taken.
Successful dropout prevention requires both accurate targeting and effective intervening. Targeting is concerned with accurately identifying students at risk and doing so efficiently in the face of miss-classification and capacity constraints. Intervening is concerned with providing targeted students at risk with a policy that should effectively reduce student dropout or that results in a switch towards an educational program which better suits a student. The most widespread rigorously evaluated interventions can be characterized as remediation, matching activities before enrolling in vocational or higher education, and financial aid. The empirical literature on the effectiveness of these efforts is largely disappointing (Lyche Citation2010; Plak et al. Citation2019). Remediation programs demonstrate no or mixed-effects (Boatman and Long Citation2018; Calcagno et al. Citation2008; Scott-Clayton and Rodriguez Citation2012; Valentine et al. Citation2011) at enormous costs (Scott-Clayton, Crosta, and Belfield Citation2014), and matching initiatives tend to not affect student dropout or performance (van Klaveren et al. Citation2019). Evaluations of financial aid programs show that financial aid increases degree attainment and improves grades when combined with other support programs (Angrist, Lang, and Oreopoulos Citation2009; Page and Scott-Clayton Citation2016).
This study contributes to the literature by acknowledging that targeting all students at risk is unfeasible due to capacity constraints of educational institutes (e.g. a restricted number of student counselors) or due to model miss-classification problems (i.e. students at risk are wrongly classified as successful and vice versa). To accommodate such capacity constraints, a two-step approach is adopted to optimally identify students at risk for participation in dropout prevention programs.
In step 1, a student’s risk of dropping out is predicted using a series of machine learning algorithms. The performance of each of these different machine learning algorithms is then evaluated using the conventional rule that a student is considered to be at risk if the probability is .5 or higher. The performance indicators used are accuracy, sensitivity, precision and the root mean squared error (RMSE).
In the second step, it is acknowledged that the adopted threshold of 0.5 is arbitrary and does not provide a targeting rule directly based on the predicted risk estimation while also accommodating potential capacity constraints. Therefore, the performance indicators sensitivity and precision @% plots are shown. Sensitivity refers to the proportion of students at risk that were correctly identified, and precision refers to the proportion of risk predictions that were correctly identified. The @% refers to the targeting capacity and shows for each percentage of the number of students that are targeted the corresponding sensitivity and precision performance. If educational institutes can more effectively target students at risk, then interventions designed to reduce dropout can be more effective.
This study thus proposes a new method that makes the sensitivity/precision trade-off insightful over time and offers a systematic way to actually act on this intertemporally. This study follows Sansone (Citation2019) and Plak et al. (Citation2019) in that machine learning techniques are used to identify students at risk of dropping out, but applies a broader palette of machine learning algorithms, uses these algorithms to target students at risk, and focuses on vocational education students instead of college students. The use of machine learning algorithms is important because the objective is to predict dropout well for later students entering vocational education (i.e. out-of-sample prediction) and because such a prediction should incorporate the fact that the ratio of at-risk and not at-risk students can be highly unbalanced.
This study proceeds as follows. Section 2 describes the algorithms used and discusses the performance measures to evaluate the algorithmic performance. Section 3 describes an application of this method to a vocational education program and shows the data and descriptive statistics of this program. Section 4 presents the empirical findings and Section 5 concludes and discusses avenues for further research.
2. Stochastic and deterministic prediction rules and performance measures
2.1. Machine learning
Machine learning approaches are designed for optimally predicting outcomes out-of-sample (i.e. for new data records) in the face of overfitting problems and unbalanced risk data. The approach can be stochastic (ML algorithms) or deterministic. For the study at hand, out-of-sample prediction performance is important because the objective is to predict the risk of dropping out for new entering students and the puzzle is then to know what information of these entering students should be collected to predict their risk of dropping out optimally. To predict well out-of-sample, the data is first randomly split into a training sample (70% of the data) and a test sample (30% of the data). The training sample is used to train the machine learning models and the out-of-sample performance of these trained machine learning models is evaluated using the test set. provides information on both the training and test sample.
Table 1. Descriptive statistics of the training and test sample.
The machine learning approach focuses on (1) the prediction algorithm, and (2) the performance measures. It generally estimates the risk prediction by estimating a series of algorithms and the best-performing algorithms then chosen to classify students as (not) at-risk of dropping out. Moreover, it is acknowledged that the at-risk group can be substantially smaller than the group not at risk, such that more conventional model performance evaluators, like , tend to be less suitable. Below, we outline the prediction rules and performance evaluators used in this study.
2.2. Deterministic and stochastic prediction rules
Supported by dropout prediction literature (Aulck et al. Citation2016) a natural default model is a straightforward deterministic rule predicting dropout from GPA within the program. Ranking the students accordingly to their average grades (GPA per period) is therefore the intuitive starting prediction rule. However, when more information correlated with future dropout is known, determining a deterministic rule for an accurate prediction becomes more difficult and cannot be a generic approach for all contexts (when a deterministic rule should be formulated using more that one variable, it is rather unclear how this should be done).
Another downside of this approach is that while waiting for the first grades an intervention to prevent dropout could already be not effective anymore (i.e. is started too late). A switch will have to be made to an approach that will find an optimal rule in every context. If educational institutes have more information related to future dropout to their disposal, machine learning algorithms can outperform this single-criterium approach.
Because there are different stochastic rules that perform differently in the accuracy of the prediction, we use three stochastic ML algorithms in this study. The reason why these three algorithms are used is because they are complementary to each other and at the same time represent a whole range of machine learning algorithms available. Machine learning algorithms differ from conventional statistical estimation models in that its sole objective is to identify the set of covariates (X) that optimally predicts variation in the dependent variable (Y). These models optimize prediction power by discouraging more complex/flexible models to avoid overfitting. Random forest, for example, tunes the hyper-parameters (e.g. the number of samples in the leaf) and the lasso algorithm penalizes the absolute values of the estimation parameters (see Hastie, Tibshirani, and Friedman Citation2009).
Targeting students with the lowest grades is an intuitive starting point. This theory-based single-criterium can be performed by ranking the students accordingly to their average grades (GPA per period).
As first algorithm, a Least Absolute Shrinkage and Selection Operator Model (LASSO) is estimated that penalizes the absolute values of the estimation parameters. The regularization and variable selection is integrated in the LASSO procedure, such that a pre-selection of the independent variables is not required. Instead, all independent variables are considered, but the inclusion of a penalty function that penalizes the sum of the estimated regression coefficients ensures that redundant variables receive a zero weight.
Intuitively, the LASSO algorithm determines if the addition of a covariate outweighs the penalty, and redundant variables receive a zero weight. The LASSO algorithm clearly shows that it is not designed to optimally describe the relationship between the independent and dependent variables, as the inclusion of the penalty function imposes a bias on the estimated parameters to gain out-of-sample prediction performance. With the LASSO algorithm a potential outcome is that it estimates that the optimal penalty is zero, which means that an OLS regression model without a penalty would have been sufficient to yield optimal results. This shows that a deterministic rule also resides within other machine learning algorithms.
Also, a ridge regression estimation was performed, which is similar to LASSO but with a quadratic penalty function. This penalization by the sum-of-squares of the parameter can be interpreted as a weight decay approach in neural network analysis (Hastie, Tibshirani, and Friedman Citation2009). The LASSO and ridge regression yielded similar performance, which is why we only mention the LASSO results in the remainder of the paper.
Second, a Random Forest (RF) ensemble regression algorithm is used. This ensemble method draws a bootstrap sample from the training data and grows a random-forest tree to the bootstrapped data by (1) selecting m random variables of the available covariate set, (2) selecting the optimal variable-split points, and (3) splitting the tree-node into two daughter nodes (Hastie, Tibshirani, and Friedman Citation2009). Based on the training sample estimates, an out-of-sample prediction is based on all individual regression trees and the covariate values.
The third and final algorithm that is estimated is the Support Vector Machine algorithm (SVM) for non-separable cases. The intuition of the SVM is that in a fully separable situation many lines can be drawn that fully separate the – in this case – dropouts from non-dropouts and the best line that separates the two groups is considered to be a separating line such that the margin, defined as the minimum distance between the line and the closest point, is maximized (Guenther and Schonlau Citation2016). In most applications, the two outcome classes are not separable and, as a result, the optimization problem only has a solution when the model allows for a certain amount of error. This error is defined by observations observed on the wrong side of the margin and the sum of the errors is assumed not to exceed the hyperparameter C, which is generally – and also in this study – set to 1. Therefore, SVM is also a penalization method, in the sense that observations on the wrong side of the margin receive penalty points, while observations observed well inside their margin receive zero penalty points (Hastie, Tibshirani, and Friedman Citation2009).Footnote1 All described machine learning algorithms are described in more detail in Appendix A in the supplementary data Section.
2.3. Performance measures
For risk predictions, samples are often unbalanced in the sense that the number of people at risk is smaller than the number of people not at risk. Conventional empirical studies tend to evaluate the performance of the empirical model based on the (adjusted) R² or RMSE (Root Mean Squared Error). With unbalanced samples, this can be problematic – also without overidentification – because observing a high R² can make it appear that the model predicts well overall, but mainly correctly identifies persons who are not at risk correctly and not persons who are at risk. If the latter are the main objective of a model, R2 would not be an appropriate performance measure.
To take into account the effects of unbalanced risk data when evaluating model performance, machine learning approaches visualize the algorithmic performance using a confusion matrix (displayed in ). The table offsets the predicted risk value by the machine learning algorithm against the observed/true value. Four performance evaluators can be distinguished based on the confusion matrix. The R²-evaluator is represented by accuracy, which indicates the proportion of correctly identified risk states. However, in this study the objective is to optimize model performance by correctly identifying students at risk of dropping out. Therefore, sensitivity and precision are more appropriate evaluators as they acknowledge that the objective is to optimize (1) the identification of students at risk of dropping out (i.e. sensitivity) and (2) the correctly predicted students at risk (i.e. precision). When considering unbalanced risk data, the focus should be on these evaluators, as they focus on the model performance for at-risk students. Specificity is an interesting evaluator since it provides information on how many students not at risk are incorrectly identified as students at risk. Nevertheless, this evaluator focuses on the not-at-risk group, and, similarly to the R²-evaluator, a high specificity value does not ensure that the model also performs well in identifying students at risk of dropping out.
Table 2. Confusion matrix.
Conventional machine learning models tend to evaluate model performance by classifying students as at risk of dropping out if the estimated probability of dropping out is higher than 0.5 (Sansone Citation2019). The underlying reason for this is that continuous dropout probabilities do not translate into the binary labeling at risk or not at risk. As a consequence, no values for the confusion matrix evaluators can be calculated if students are not dichotomously classified based on some threshold. When presenting the empirical results, this study departs from the conventional approach, in the sense that we first show the in-sample and out-of-sample performance of the estimated machine learning algorithms in terms of RMSE, R², and sensitivity and precision evaluated at the .5 threshold. Based on these results, we obtain information on overfitting, on the optimal penalty-weight in the LASSO estimation, and a first comparison of the performance of the different algorithms.
A drawback of this approach is that the estimated probabilities are translated into a classification such that the calculated sensitivity and precision values do follow directly from the algorithmic estimation. Based on the method proposed by Savi et al. (Citation2021), this study provides a more actionable alternative in that it offers educational practice concrete guidelines into how students can be targeted – or invited – based on their risk prediction; thereby optimizing combinations of sensitivity, precision, and specificity. Instead of using a fixed threshold, the number of correct predictions is plotted when inviting a percentage of the students (@%) proportional to the total number of students at risk (sensitivity) or proportional to the total predicted number of students at risk (precision). It then becomes visible how many students have to be invited to reach a certain percentage of the overall students at risk. A higher precision @% signifies a better proportionality and a higher sensitivity @% signifies a better coverage of the students at risk. In the ideal scenario, precision remains 100% with every increase in the percentage of invited students, and sensitivity increases with every increase in the percentage of invited students until sensitivity also reaches 100% (Savi et al. Citation2021). The advantage of this approach is that the ratio between the decrease in precision and gain in sensitivity also incorporates specificity information (i.e. if inviting additional students does not result in sensitivity gains and precision loss, then this indicates that more students who were not at risk were incorrectly identified as at risk and invited).
3. Data and descriptive statistics
To demonstrate the aforementioned approach empirically, this study uses information of 409 students of cohort 2015, 2016, 2017, and 2018 who entered the ROC TOP Sports Academy Amsterdam, a vocational education program in the Netherlands (). Dutch vocational education offers an education that trains for a specific profession, and the education programs are typically developed together with the industry in which the graduates will work upon completing the program.
Table 3. Descriptive statistics of students (N = 409) in this study.
The considered data in this study contains three data sources: (1) standardized intake test scores related to cognition and personality, (2) data from an expectations questionnaire (filled out by 365 students before the intake test), and (3) registration data of students, which includes student background characteristics, GPA, average grades per period, exit data and dynamic data on absenteeism. The absenteeism data contains the amount of reprimand letters sent to a student.Footnote2
Every student who enrolls at ROC TOP Sports Academy Amsterdam takes an intake test that assesses the cognitive skills and personality traits of the student. Personality traits are measured using the Big Five taxonomy (John and Srivastava Citation1999; McCrae and Costa Citation2008). The cognitive skills are measured with different ability tests. In total this test contains 27 variables. Before the intake test, the students filled out an expectation questionnaire (73 variables, for cohort 2015 50 variables) in which students express their expectation on the program content and study success ( and Appendix B in the supplementary data Section).
We note that for each variable with missing observations, we constructed a missing dummy that indicates 1 if the value was missing and zero otherwise. Then the missing values were replaced with the mean value of that variable, such that no observations were lost while also containing the potential predictive information of missing data with respect to dropout risk. In total 142 variables are included in the machine learning models as predictors.
Throughout the school year, more student data becomes available (for example grades, and information on absenteeism), which are incorporated in generating dynamic dropout prediction models. The first year of the vocational education program considered in this study is naturally divided into four periods. Therefore, the empirical analyses are conducted for the first period, the first two periods, the first three periods, and all four periods.
4. Findings
shows the baseline findings after period 4 and Appendix B in the supplemantary data Section describes all 142 variables that were fed to the machine learning algorithms. The objective is to predict well for students at risk of dropping out, and the precision and sensitivity evaluators, using the convention threshold of 0.5, show that the LASSO algorithm outperforms the other algorithms: 95% of the risk predictions are correct (i.e. precision = 95%) and 76% of drop-out students were correctly identified as such (sensitivity = 0.76%).
Table 4. Baseline estimation model performance after period 4 (Dropout = 43%, 176 students).
The optimal penalty weight, λ, in the LASSO model is 0.02. Even though this weight is rather close to zero, it is sufficient to reduce the number of variables included in the model from 142 to 22 (see Appendix E in the supplementary data Section for the variables that are not excluded in the Lasso prediction model).
In Appendix C in the supplemantary data Section, we show the prediction results at the start of the program and at the end of periods 1, 2, 3, and 4, which gives information of the change in model-performance due to the inclusion of the additional data that become available over throughout the school year. The results indicate that the model performance when evaluated on the basis of accuracy (i.e. R2), precision, and sensitivity improves substantially over time. Using the conventional threshold rule of .5 indicates that the LASSO algorithm performs best as it generates the highest precision and sensitivity values.
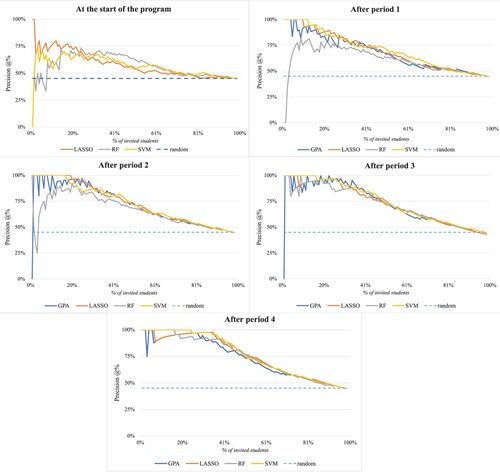
As argued in the previous section, it is more informative to educational practice to plot the number of correct predictions when inviting a percentage of the students proportional to the total number of students at risk (sensitivity) or proportional to the total predicted number of students at risk (precision). These plots are shown in (sensitivity @%) and (precision @%).
Figure 1. Sensitivity @% for test sample at the start of the program and after period 1, 2, 3, and 4. The dashed line represents the sensitivity by random invitation.
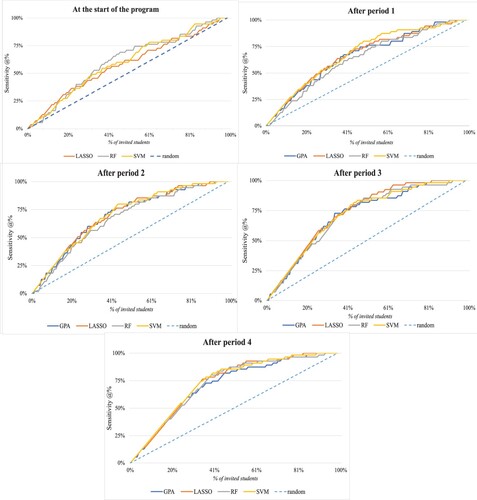
Figure 2. Precision @% for the test sample subsequently at the start of the program and after period 1, 2, 3, and 4. The dashed line representes the precision by random invitation.
shows the percentage of dropouts correctly identified for the test sample when a percentage of the students are invited (@%). The figures show that the model performance of LASSO and Support Vector Machine are best because the sensitivity lines are mostly above those of the other models. The line of the GPA ranking is close to the other lines, which means that, in this particular study and in this particular vocational program, also GPA could be used as a predictor of dropout. LASSO and SVM do not outperform the GPA rule from a sensitivity perspective, but at the same time, it also holds that the GPA rule does not outperform LASSO and SVM. This shows that the GPA deterministic rule resides within the SVM and LASSO approach.
At the start of the program, also the random forest algorithm performs relatively well, but in later periods – and in terms of precision (as we will show below) its performance is not as good as the LASSO and the Support Vector Machine algorithms. The GPA line is missing because the students did not yet obtain any grades at the start of the program.
Considering the sensitivity lines of the best performing models, the figure shows that if 45% of the students were to be invited/targeted, 75% of these students would have dropped out at the end of the year (i.e. the invited students were correctly identified as student dropouts). If 100% of the students would be invited then the sensitivity would be 100%, but this invitation rule would be highly inefficient as 55% of the students did not drop out and were wrongly classified as at risk of dropping out.
To formulate an efficient invitation rule, plots the correct predictions proportional to the total predicted number of students at risk for the percentage of the students invited. The Support Vector Machine (SVM) performs best in terms of precision: (1) the precision line is highest, and (2) there are no sudden drops in precision performance. The different panels for SVM also suggest that the precision increases over time: the precision remains 100% for a larger percentage and for later periods the precision lines shift to the right. The results for the start of the educational program show that precision is low and rather erratic, such that, from the perspective of efficient capacity use, inviting students already at the start of the program does not seem optimal.
To explain the precision @% results, we will focus on the results generated by SVM. The After period 1 results show that the risk-predictions for the first 12% were correct, such that if these students were invited, they were all correctly identified as dropouts. If more than 12% of the students are invited, the precision drops below 100%, meaning that when more than 12% of the students are invited, not all of them are correctly identified as dropouts.
and illustrate that there is a trade-off between the objective of identifying all students at-risk and the objective of efficient capacity usage of anti dropout programs. In other words, inviting more students is beneficial when identifying more students indeed at risk of dropping out, but at the same time inviting more students also implies that a larger fraction is incorrectly labeled as a student at-risk of dropping out.
Using the SVM results, and considering the sensitivity-precision trade-off, a precision-based invitation rule can be formulated. We depart by formulating such a rule using a precision-based 100% rule, and then present and discuss less stringent precision rules and their implications.
A precision-based 100% rule after Period 1 implies that 12% of the students can be invited and all are correctly identified as students at risk of dropping out. This covers 27.3% of the total number of students that drop out after year 1 in the test sample. Then, after periods 2, 3 and 4 the number of invitations at 100% precision is, 17%, 17% and 24%, which amounts to coverage of, respectively, 38.2%, 38.2%, and 54.5% of the total number of students that drop out after the first education year. The coverage might appear low, but these percentages are obtained using a stringent precision rule that imposes 100% efficient capacity usage (i.e. no non-dropouts are targeted).
shows the invitation-sensitivity results given different precision-based percentage rules. Thereby, it provides information on how efficient the deployment of available resources can be. It also gives insight in the precision-sensitivity tradeoffs that remain when dropout prevention programs have limited capacity. It is not the case that an optimal rule can be formulated, as optimality concerning the number of invitations depends on available capacity and the type of interventions that are implemented to prevent dropout. However, this precision-sensitivity trade-off is informative in several contexts.
Table 5. Precision-based invitation rule using the SVM-results.
is informative in that – in the context of this particular study – inviting 17% of the students using a 100% precision rule gives already a sensitivity-coverage of 38% after period 2 (when dropout can still be prevented). Using the 100% rule means that the at-risk students predicted by the model are indeed dropouts. When it is accepted that the precision of the model is lower (e.g. possibly students are targeted who would have never dropped out), sensitivity can be increased (e.g. when using an 80% precision rule, inviting 45% of the students already gives a sensitivity-coverage of 80% after period 2, and it shows that an increase of this coverage to 91% requires an increase in the number of invitations to 68%). An invitation-sensitivity table, such as , can thus support more evidence informed targeting of students at risk and can accommodate effective dropout prevention policies.
5. Conclusion and discussion
This study proposed a method that targets students at risk of dropping out by adopting a two-step machine learning approach and by taking the precision-sensitivity trade-off into account. In doing so, we have introduced a precision-based ruling system for inviting students and offer a systematic way to actually act on this intertemporally. This approach acts as an invitation-sensitivity planner for making informed decisions on which students, and at which point throughout the school year, should be invited. Doing so enables a highly targeted approach in combatting student dropout in the face of capacity constraints for counseling or participation in dropout prevention programs.
Our precision-based ruling system informs policymakers on exactly what the precision-sensitivity trade-off is in inviting more students into their dropout prevention programs and it helps making an informed cost–benefit analysis when it concerns, for example, the funding of such programs or assigning extra personel to students. With these insights the percentage of students targeted in order to achieve a certain precision-percentage can be chosen and associated costs can then be included on the balance sheet. The effectiveness of dropout prevention programs could improve because the ‘right’ students are invited, which could save time and money but most importantly helps students earn a degree.
Using a wide array of machine learning algorithms, we derive model predictions for being at risk of dropping out and update this prediction periodically as new information (e.g. grades, absenteeism) becomes available. Using this information on the risk of dropping out, we then formulate a precision-based invitation planner with the objective to put dropout prevention resources (e.g. counselors, programs) to use efficiently. This planner provides hands-on guidance in which students should best be invited when in avoiding resources to be spent on students that are actually not at risk of dropping out.
An empirical example of applying this approach was provided, using registration data of four Dutch first-year student cohorts enrolled at a vocational education institution in the Netherlands. The results indicate that adding information periodically improves model performance substantially.
Overall, predictions based on Support Vector Machines (SVM) and LASSO regressions appear to perform best when taking also into account the important tradeoff between precision (i.e. targeting only students who are indeed at risk of dropping out) and sensitivity (i.e. targeting all students who are indeed at risk of dropping out). While the deterministic rule performs similar when the sensitivity performance is evaluated, it is outperformed by machine learning when the precision performance is evaluated. This result reflects that the model prediction performance of the deterministic rule is worse than that of most other Machine Learning algorithms, while it does a relatively good job in terms of correctly identifying the students at risk of dropping out. It also holds that other pivotal information should and can be collected to increase the predictive power of prediction models. The prediction models after program entry performs relatively better than the prediction model before program entry. However, for many programs this may be different. Typically for college education, high-school grades and some demographic variables remain a significant predictor even after first grades are entered into the predictions (Murtaugh, Burns, and Schuster Citation1999).
The results indicate that this precision-based approach has merit in making informed decisions when acknowledging the precision/sensitivity tradeoff. The performance of the algorithms could potentially increase when more dropout relevant predictors are collected. Whereas the exact performance numbers are of course unique to the student cohorts considered in this study, this approach can be applied in general at any institution that faces capacity constraints in targeting the right students. In those situations, the weights of the variables will vary for each program, but the drivers will be generalizable.
A fruitful avenue for further research, is to combine predictive and causal approaches with the objective to lower student dropout. The combination may contribute to better targeting of the students at risk. Savi et al. (Citation2021) proposes such a combination and refer to it as an exploit-explore procedure that provides an actionable alternative to only acting on presumed risks. Future research should also focus more on the diagnostic component such that students at risk receive an intervention that is addressing the underlying cause of dropping out. Machine learning can contribute to identifying sub-populations among students being at risk of dropping out and can provide insights in how interventions can be personalized (Sansone Citation2019).
Combatting student dropout is a challenge faced by educational systems across the globe. Even though dropout is not undesirable for every student, the targeting of potential dropouts in an early stage of the program is important to assess if students can be helped in preventing undesired dropout. The emerging evidence on the effectiveness of dropout prevention interventions points out that interventions are not unequivocally successful in curbing dropout patterns and often come with enormous costs. A factor that might often be overlooked is that a prerequisite for any dropout prevention intervention to be effective is that it targets the right students. Machine learning algorithms enable better risk predictions, but – in itself – do not provide hands-on advice to educational institutions about which students should participate in dropout prevention programs and when they should be invited. The precision-based approach introduced in this study provides a way of doing just this.
Ethical considerations and informed consent
The research design fell under an umbrella protocol that was approved by the Scientific and Ethical Review Board of the Faculty of Behavioral and Movement Sciences, Vrije Universiteit Amsterdam (2019-147).
Availability of data and material
Please contact the first author for further details on the data set.
Supplemental Material
Download PDF (279.6 KB)Acknowledgements
We want to thank Eva Bus (Vrije Universiteit Amsterdam) for helping us completing the data set.
Disclosure statement
The first author works within the institution that was subject to the research.
Additional information
Funding
Notes
1 For more details on how margins are constructed and maximized in SVM and how this can be interpreted as a penalization approach, please see Hastie, Tibshirani, and Friedman (Citation2009, 426).
2 The Dutch compulsory schooling law requires children to go to school until the age of 18. Students who successfully finish pre-vocational education are, on average, 16 years old. When a student misses 16 scheduled hours in 4 weeks the vocational institutes are obliged to report this and inform the students by a letter.
References
- Altbach, P. G., L. Reisberg, and L. E. Rumbley. 2009. “Trends in Global Higher Education: Tracking an Academic Revolution.” In UNESCO 2009 world conference on Higher education.
- Angrist, J., D. Lang, and P. Oreopoulos. 2009. “Incentives and Services for College Achievement: Evidence from a Randomized Trial.” American Economic Journal: Applied Economics 1 (1): 136–163. doi:10.1257/app.1.1.136.
- Aulck, L., N. Velagapudi, J. Blumenstock, and J. West. 2016. Predicting Student Dropout in Higher Education (No. 1606.06364v3). http://arxiv.org/abs/1606.06364.
- Boatman, A., and B. T. Long. 2018. “Does Remediation Work for All Students? How the Effects of Postsecondary Remedial and Developmental Courses Vary by Level of Academic Preparation.” Educational Evaluation and Policy Analysis 40 (1): 29–58. doi:10.3102/0162373717715708.
- Calcagno, J. C., T. Bailey, E. Bettinger, M. Clark, J. Deke, T. Kane, … M. Urquiola. 2008. The Impact of Postsecondary Remediation Using a Regression Discontinuity Approach : In National Bureau of Economic Research (No. 14194).
- Dynarski, S. 2008. “Building the Stock of College-Educated Labor.” Journal of Human Resources 43 (3): 576–610. doi:10.3368/jhr.43.3.576.
- Freeman, J., and B. Simonsen. 2015. “Examining the Impact of Policy and Practice Interventions on High School Dropout and School Completion Rates: A Systematic Review of the Literature.” Review of Educational Research 85 (2): 205–248. doi:10.3102/0034654314554431.
- Guenther, N., and M. Schonlau. 2016. “Support Vector Machines.” The Stata Journal 16 (4): 917–937. doi:10.1177/1536867X1601600407.
- Hastie, T., R. Tibshirani, and J. Friedman. 2009. The Elements of Statistical Learning: Data Mining, Inference, and Prediction. 2nd ed. doi:10.1007/b94608
- John, O. P., and S. Srivastava. 1999. “The Big Five Trait Taxonomy: History, Measurement, and Theoretical Perspectives.” In Handbook of Personality: Theory and Research, edited by L. A. Pervin, and O. P. John, 102–138. New York: Guilford Press.
- Lyche, C. S. 2010. Taking on the Completion Challenge: A Literature Review on Policies to Prevent Dropout and Early School Leaving. In OECD Education Working Papers, No. 53, OECD Publishing. doi:10.1787/5km4m2t59cmr-en
- McCrae, R. R., and P. T. Costa. 2008. “Empirical and Theoretical Status of the Five-Factor Model of Personality Traits.” In The SAGE Handbook of Personality Theory and Assessment, 273–294. doi:10.4135/9781849200462.n13
- Murtaugh, P. A., L. D. Burns, and J. Schuster. 1999. “Predicting the Retention of University Students.” Research in Higher Education 40 (3): 355–371. doi:10.1023/A:1018755201899.
- OECD. 2010. “Education at Glance 2010.” In Education at a Glance 2010: OECD Indicators (Vol. 6). doi:10.1787/eag-2010-en
- OECD. 2014. “Education at a Glance 2014.” In Education at a Glance 2014: OECD Indicators. doi:10.1787/eag-2013-en
- Page, L. C., and J. Scott-Clayton. 2016. “Improving College Access in the United States: Barriers and Policy Responses.” Economics of Education Review 51: 4–22. doi:10.1016/j.econedurev.2016.02.009.
- Plak, S., I. Cornelisz, M. Meeter, and C. Van van Klaveren. 2019. Early Warning Systems for More Effective Student Counseling in Higher Education: Evidence from a Dutch Field Experiment.
- Rumberger, R., and S. A. Lim. 2008. Why Students Drop Out of School: A Review of 25 Years of Research. In California Dropout Research Project Report. doi:10.1007/s10758-013-9210-4
- Sansone, D. 2019. “Beyond Early Warning Indicators: High School Dropout and Machine Learning.” Oxford Bulletin of Economics and Statistics 81 (2): 456–485. doi:10.1111/obes.12277.
- Savi, A. O., I. Cornelisz, M. J. Sjerps, S. L. Greup, C. M. Bres, and C. van Klaveren. 2021. “Balancing Trade–Offs in the Detection of Primary Schools at Risk.” Educational Measurement: Issues and Practice 40 (3): 110–124. doi:10.1111/emip.12433.
- Scott-Clayton, J., P. M. Crosta, and C. R. Belfield. 2014. “Improving the Targeting of Treatment: Evidence from College Remediation.” Educational Evaluation and Policy Analysis 36 (3): 371–393. doi:10.3102/0162373713517935.
- Scott-Clayton, J., and O. Rodriguez. 2012. Development, Discouragement, Or diversion? New evidence on the effects of college remediation policy. In National Bureau of Economic Research (No. 18328). doi:10.1162/EDFP_a_00150
- Valentine, J. C., A. S. Hirschy, C. D. Bremer, W. Novillo, M. Castellano, and A. Banister. 2011. “Keeping at-Risk Students in School: A Systematic Review of College Retention Programs.” Educational Evaluation and Policy Analysis 33 (2): 214–234. doi:10.3102/0162373711398126.
- van Klaveren, C., K. Kooiman, I. Cornelisz, and M. Meeter. 2019. “The Higher Education Enrollment Decision: Feedback on Expected Study Success and Updating Behavior.” Journal of Research on Educational Effectiveness 12 (1): 67–89. doi:10.1080/19345747.2018.1496501.