
ABSTRACT
Since the collapse of the communist system, regional inequalities have increased in Central European Countries. This paper describes an assessment of the impacts of regional development programmes on the development of Hungarian regions at a highly disaggregated level between 2002 and 2008. We construct a multi-dimensional composite indicator to estimate the overall development of rural regions and capture social, economic and environmental dimensions. The impacts of rural development programmes were investigated through counterfactual analysis in combination with Propensity Score Matching and Difference-in-Differences approaches. There has been considerable variation with increasing concentration in the level of subsidies distributed during the analysed period. From a policy perspective, the results are disappointing. Irrespective of the subsidy measures or methodology employed, the impact of the former is very close to zero or non-significant. Our findings cast serious doubt on the effectiveness of development policy and the long-run convergence of European regions.
1. Introduction
European Union (EU) regions are characterized by considerable differences in terms of economic development and well-being. The enlargement of the EU led to an increase in these regional differences, challenging the EU structural policy. The goal of this policy is to strengthen economic, social and territorial cohesion by reducing the disparity in the level of development among regions and Member States. To achieve this, structural programmes and funds have been established to promote the political objectives of convergence, regional competitiveness and employment, as well as European territorial integration. However, the distribution of regional and rural funds has been criticized as being ineffective and inefficient. The situation in Central and Eastern European Countries (CEEC) is somewhat different from that of the Old Member States – the role of EU funds is much more important for the former because their level is much higher than it was during the pre-accession period.
There was a general expectation in the CEEC bloc that, through the Community’s regional policy resulting from EU membership, living standards would rather quickly catch up with the Western European level. In many cases, however, these expectations were naive. Some of the literature (Balogh, Citation2012) argues that contra-productive subsides are to blame, while other authors (Jeney & Varga, Citation2016) emphasize the growth of within-nation regional polarization in explaining the lack of regional development convergence. The latter argument claims that within poorly developed regions, support can only be successfully absorbed when pre-existing material and human capital is available for efficiently using such support. It follows that only regions with better social economic status will thus benefit, thereby increasing within-periphery polarization. Impact analysis requires the most realistic mapping of social-economic territorial inequalities, which theoretically would require the lowest-level aggregation possible of locality units.
Despite its importance, the empirical literature with respect to the evaluation of regional development measures is rather undeveloped. Most papers focus on the impact of agricultural policy on the labour market or rural income distribution (e.g. Breustedt & Glauben, Citation2007; Elek, Fertő, & Forgács, Citation2010; Esposti, Citation2007; Petrick & Zier, Citation2012; Pufahl & Weiss, Citation2009; Swinnen & Van Herck, Citation2010). One reason for the scarcity of relevant literature is that making policy evaluations and impact assessments of rural funds is rather complicated, since complex notions are hard to quantify, whilst all relevant components of the impact should be included in a transparent and easy-to-handle fashion (from a data perspective). According to a definition by the Commission (European Commission (EC), Citation2006), the purpose of programme impact assessment is to support policy involvement based on criteria that measure to what extent (impacts, results and requirements) the aims of intervention are fulfilled. In practice, however, there are numerous examples of when regional development policies have provided regions with elevated levels of support (and selected – partial – indicators reflect the success of such policies), yet the same localities show signs of degradation, with an increase in the tendency to out-migration. Considering the complex issues of regional development as a whole, particularly the subsidies that arrive through different axes and the measures that address various – and sometimes contradictory – development goals, the need for the use of complex regional development indicators (RDIs) that are capable of reflecting cross-measure synergies is clear.
In this regard, there are two key issues: first, the problem of applying partial indicators (such as number of projects supported, area supported, change in employment, value of realized investments, and GDP change – see Michalek and Zarnekow (Citation2012a) for a critical review); and second, the issue of a counterfactual situation that excludes the possibility of a before-after comparison. Naive approaches to the impact evaluation of European funds are often employed, such as simple case studies or the use of partial indicators that do not even attempt to construct a counterfactual analysis (Terluin & Roza, Citation2010). Generally, the most important drawback of partial measures is the lack of clear causal relations between partial measures and subsidies (i.e. the problem of differentiating between the impact of funds and other exogenous factors). These issues may, however, be solved by the use of a complex RDI, as originally proposed by Michalek and Zarnekow (Citation2012a), and counterfactual analysis.
In the empirical literature, two broad categories of research methodology with respect to complex indicators can be distinguished. One stream of studies (Csatári, Citation1999; Faluvégi & Tipold, Citation2007; Hahn, Citation2004; Jeney & Varga, Citation2016) categorizes the variables used for analysis into dimensions, and creates a composite indicator per dimension. Other papers (Bíró & Molnár, Citation2004; Bodnár, Citation2016; Cserháti, Dobosi, & Molnár, Citation2005; Faluvégi, Citation2004; Fazekas, Citation1997; Lukovics, Citation2008; Lukovics & Kovács, Citation2011; Obádovics, Citation2004; Ritter, Citation2008), including that of Michalek and Zarnekow (Citation2012a) , use all the available data as a single group, arguing that the value-creating properties of the economy, human endowments, infrastructure, etc. are not independent manifestations in special analysis but strongly interact. In the latter case, factor or principal component analysis facilitates understanding of the joint effect of variables that otherwise would be categorized into different dimensions. However, this approach, which we favour in this paper, comes with a caveat. Namely, the interpretation of the results of factor analysis is difficult – providing that individual factors need to be interpreted.
In this paper, regional development support variables were assessed, including all available funds for this purpose from national sources and from EU Structural and Investment Funds. In contrast to Michalek (Citation2012) who investigates only the impact of SAPARD programmes in Poland and in Slovakia between 2002 and 2005, we focus on the 2002–2008 period and incorporate all regional development policy measures. Thus, we can assess the effects of regional development policy in Hungary as a whole.
Of all CEECs that acceded to the EU in 2004, Hungary is the country most exposed to free market rules. Our primary aim is to assess whether initial EU transfers were actually able to positively influence regions that seem to be permanently affected by post-transition crisis symptoms. Thus, our main research question is simple: Did the flow of regional development payments make a difference to the development of Hungarian sub-regions?
In the following section of the paper, we describe CEEC context followed by the discussion of data we used. In Section 4 we present and overview the empirical methodology. Part 5 focuses on empirical results, whilst Section 6 concludes.
2. Regional development in Central and Eastern European countries
The transformation of political and economic systems in CEEC induced similar impacts with respect to spatial inequalities within the regions of CEECs. With the collapse of socialism, the strong interlocking of industry and regional development became unwound, and with the transition to a Western-type market economy, localities entered the competition for available resources. The new economic actors chose their premises purely based on economic variables, leading to the development of new inequalities. Better-endowed regions started to amass more important economic organizations, changing the spatial pattern of CEEC’s national economies (Beluszky & Győri, Citation1999). The negative impacts that hit the less favoured regions were at best only mitigated by Government support.
The most prominent symptoms of regional inequalities in the post-communist countries are the level of urbanization and the extent of rural space; however, there are significant differences between CEECs. Except in Poland, where the urban population is still increasing, outmigration from rural to urban areas has halted. Moreover, in a number of countries (Kovács, Citation2009) within-country migration has reversed, with the unemployed urban population moving to rural regions. Before the transition, rural areas and traditionally industrial suburbs contained the highest proportion of the active population, and the opposite trends were observed in larger cities.
Spatial differences in labour markets are mostly due to the re-structuring of economic systems. High employment rates were rather specific to regions where structural changes had not yet affected all branches of the economy (i.e. where old structures persisted). In addition, there are regions where the quick development of previously neglected tertiary sectors offset the shrinkage of the other branches of the national economy. One particular paradox of CEEC transition is that successful regions displayed the lowest activity rates (Horváth, Citation2004).
Certainly, the transition was a very country-specific process. In Hungary, for example, un-competitive socialist plants were closed or privatized (often at all costs), whilst Poles rejected shock therapy and continued operating loss-making production plants for reasons of employment and regional policy, whilst gradually improving their efficiency. By the end of the 1990s, Hungary had gone beyond the transition crises typical of regional economies and was on a path to growth, whilst Poland, the Czech Republic and Slovakia – mainly due to an extended process of privatization and the practice of continuously propping up the budgets of large production plants – was still in front of the great structural and regional transformation process (Horváth, Citation2004). Due to the lack of nationally available capital, in Hungary the emergence of a market economy mostly favoured international companies (Faragó, Citation2016).
Similarly to other European countries, regions specialized in heavy and extractive industries were the losers of the transition process, alongside – and this is a CEEC specificity – large agrarian regions. This partly explains why amongst CEECs, Hungary shows one of the largest differences in development at the NUTS2 level (the picture is actually worse when NUTS3 decomposition is considered; (Horváth, Citation2004). This direct exposure of Hungary to free market forces – compared to other CEECs – makes it an especially interesting case when assessing the impact of incoming development support funds (Faragó, Citation2016; Horváth, Citation2004). Thus the 2004 accession opened new sources to manage regional differences. We choose our period of analysis to 2002–2008 to incorporate two pre-accession years and the first two years of the 2007–2013 programming period. The year 2002 is an interesting year for research since SAPARD funds became available at that time, thus allowing Hungary access to all pre-accession funds. In the period right before accession, national and pre-accession programmes (PHARE, ISPA, SAPARD)Footnote1 were the main sources of funds for promoting regional convergence, whilst after the accession the slow drying up of domestic resources occurred. The National Development Plan was implemented on 1 May 2004, the overall aim being to improve quality of life (QoL) through five operative programmes, of which four used a sectoral approach (economy, agriculture and rural development, human resources, environment protection and infrastructure) whilst the fifth, the Regional Operative Development programme, focused on reducing development inequalities at the NUTS 2 level. The New Hungary Development Plan (NHDP) was elaborated for the 2007–2013 programming period, the target being to increase employment and create the conditions for sustained growth. Six priorities were listed for coordinated domestic and EU development: economy, transport, societal renewal, energy and environment protection, regional development, and state reform. All these were to be carried out through Regional Development Programs at the NUTS 2 level.
Impact analysis requires the most realistic mapping of social-economic territorial inequalities, which theoretically would require the lowest aggregation possible of locality units. However, considering the rather unique Hungarian settlement structure (a high number of very small villages, and the disproportionalities found in spatially extended settlements in the Alföld region), the impact analysis of regional development is best served by using LAU 1 (formerly NUTS 4) aggregation.
3. Data and preliminary analysis
To derive the RDI we used the Hungarian Central Statistical Office’s T-STARFootnote2 regional database provided by the databank of the Centre for Economic and Regional Studies of Hungarian Academy of Sciences.
Data about regional development support are derived from the Information Systems of National Regional Development. We use nominal value data about subsidies, and also the number of projects funded. We use three subsidy indicators: total support per sub-region, support per km2, and support per capita.
Descriptive statistics about total development subsidies (years 2002–2008) are presented in , and emphasize the uneven distribution of funds.
Table 1. Descriptive statistics of subsidies (2002–2008).
The average value of support per sub-region amounts to HUF 2.2 billion, but there are sub-regions with no support at all (minimum value 0) whilst the maximum value of support per project was HUF 541 million. This uneven distribution is also reflected in the extremely high standard deviation. However, the picture is more nuanced according to the last two rows of (per capita and per km2 subsidy), where the inequality of distribution is less prominent.
illustrates the yearly averages of support variables. Note the post-EU accession (2004) non-monotonic increase in average development funds. Somewhat surprisingly, the number of projects that were continuously supported decreases after 2004, resulting in a dynamic expansion of subsidy-per-project averages. Support per km2 increased five-fold, whilst support per capita roughly doubled between the start and end period – an otherwise expected outcome (i.e. the distribution of funds was more likely to vary according to the sub-regions’ total population rather than surface area).
Table 2. Average values of subsidies and supported projects per sub-region (2002–2008).
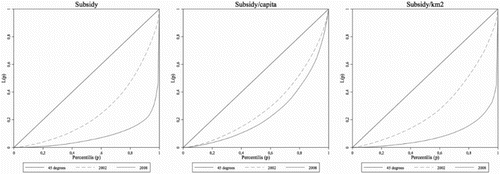
The Lorenz curves () reinforce our prior beliefs with respect to the increase in the concentration of subsidies experienced between 2002 and 2008. The most prominent increase is recorded for total subsidies received and for per km2 support, and the lowest for per capita support. The higher concentration of subsidies in 2008 is evident from the graph.
Figure 1. Lorenz curves of the sub-regional distribution of subsidies (2002 and 2008). Source: Authors’ calculations.
In addition, Figures A1–A3 in the Appendix present a graphical overview of the spatial distribution of total, per capita and per km2 subsidies received at the beginning of the period under analysis (2002) and the end of it (2008), showing a very uneven distribution of support.
4. Methodology
We employed principal component (PCA) and factor analysis to reduce the number of variables that describe objective QoL in the sub-regions. We first tested the data to determine the applicability of PCA using Kaiser–Meyer–Olkin’s measure and Bartlett’s test of variable independence, followed by rotation algorithms (Varimax). Finally, we applied Kaiser selection criteria, considering only factors with Eigen values of larger than one (see Afifi, May, & Clark, Citation2003 for the related practitioner’s handbook). The resulting factors were used to construct the RDI. However, the weights that represent the ‘relative social value’ attached to each factor are unknown, and had to be estimated. This was done using net migration flows in and out of the given sub-regions: by making a decision to migrate, people implicitly weigh the importance of regional characteristics that define the local QoL. In doing this, we followed the wealth of research that focuses on the relationship between migration and QoL. The basic idea is simple: people move (migrate) to where their QoL is better. Since the seminal article of Tiebout (Citation1956) that lays out the related theoretical foundations, and emphasizes that ‘if consumer-voters are fully mobile, the appropriate local governments, whose revenue-expenditure patterns are set, are adopted by the consumer-voters’ (Tiebout, Citation1956, p. 424), papers that use migration-based assessments of QoL have flourished. Some more recent empirical applications of this concept include Douglas and Wall (Citation1993) – who use a non-parametric approach to construct QoL rankings using utility-maximizing migration decisions in Canada; Douglas and Wall (Citation2000), who use migration data to observe how much QoL is determined by income versus non-pecuniary amenities; Nakajima and Tabuchi (Citation2011) who analyse the convergence of migration-based utility differentials in Japan; Wirth (Citation2013) , who ranks German regions based on interregional migration data and estimates regional utility differentials; and finally, Michalek and Zarnekow (Citation2012a) – the paper most similar to the present research – that applies the former technique to analyse rural regions of Poland and Slovakia. In a paper focusing on alternative solutions for deriving the RDI index, (Michalek & Zarnekow, Citation2012b) propose four modelsFootnote3 for estimating the weights of regional characteristics. Considering the data that were available and the purpose of the research, we employed Model 1; i.e. we estimated the migration function in a balanced panel setting, as follows (equation 1):(1) where mpit is net migration into sub-region i normalized by the total population of the sub-region i, α0 is a constant, Fikt is the value of factor k in sub-region i, at time t. Thus, βk accounts for the impact of factor k (Fk) upon net migration, and is used as a weight in the construction of RDI. Finally, vi is the region-specific residual and εit is the residual with the usual white noise properties. Given the panel nature of data, and the strict underlying assumptions of panel models, a variety of models were estimated using specification and diagnostic tests to facilitate selection of the ‘best’ model (see e.g. the handbook of Baltagi, Citation2008). We now estimate the RDI index, which takes the following form:
(2) where RDIit – Rural Development Index in region i and year t, Fikt the factors as defined under equation (1), βkt the weights for each factor specific to region i, and time t resulting from the estimation of the migration function (1). That is, equation (2) calculates the RDI as the proportion of migration flows explained by local characteristics represented by the factors.
Having calculated the unbiased RDI, we were in position to actually analyse the impact of RDPs on sub-regions. Whilst in standard policy analysis settings the sample-average treatment effects cannot be calculated because it is only possible to observe one of the two possible outcomes for each individual (or sub-region in our case), this issue is solved by using an RDI that allows for the creation of a counterfactual situation. Following insights from impact analysis literature, we adopted the counterfactual framework developed by Rosenbaum and Rubin (Citation1983). We employed Propensity Score Matching (PSM) to predict the probability of a sub-region being subsidized on the basis of observed covariates for both subsidized and non-subsidized sub-regions. The method balances the observed covariates between the subsidized and non-subsidized sub-regions based on the predicted probability of them being subsidized regions. The aim of using PSM was to identify a comparison group of subsidized regions from a sample of non-subsidized sub-regions that was closest (in terms of observed characteristics) to the sample of subsidized sub-regions.
More specifically, sub-regions were selected into treatment and non-treatment groups that have similar potential outcomes (RDI scores). We employed a matching estimation technique to identify the treatment effects: more specifically, sub-regions selected into treatment and non-treatment groups have potential outcomes (TE scores) Y0, Y1 in both states (subsidized or not subsidized) D = 0,1: the one in which the outcomes are observed , and the one in which outcomes are not observed
. The most common evaluation parameter of interest is the Average Treatment Effect on the Treated (ATT), defined as:
(3) Similarly, we can derive estimators of the Average Treatment effect on Controls (ATC) and the overall average treatment effect (ATE).
To solve the evaluator’s classing problems the matching approach reproduces the treatment group among the non-treated by pairing each programme participant with members of the non-treated group, controlling for observable characteristics.
Thus, as a first step, a logit modelFootnote4 (equation (4)) was estimated for all three subsidy indicators (thus changing the dependent variable).(4) where Subsidyit is dummy variable that takes a value of one if a sub-region is identified as a subsidized one, and zero otherwise. RDI2002it is the 2002 level of RDI and UNEMP2002it is the absolute value of unemployment for 2002 – these variables control for the initial status of a given sub-region. In addition, the variable UNEMPR2002it captures the rate of unemployment in the sub-region. The logic behind the inclusion of UNEMP2002it and UNEMPit is that unemployment levels are the indicators perhaps most closely monitored by decision makers, thus are likely to influence subsidy allocation decisions. The results of the logit estimations are used to calculate the probability of participation (of being treated) of a given sub-region in the development projects.
Estimating the treatment effects based on PSM requires two assumptions. First, the Conditional Independence Assumption (CIA), which states that for a given set of covariates participation is independent of potential outcomes. A second condition is that the Average Treatment Effect for the Treated (ATT) is only defined within the region of common support. This assumption ensures that treatment observations have comparison observations ‘nearby’ in the propensity score distribution. For a more comprehensive discussion of the econometric theory behind this methodology, we refer the reader to Imbens and Wooldridge (Citation2009) and Guo and Fraser (Citation2010) . However, the PSM has several limitations. First, PSM requires extensive data sets from large samples of units – less of an issue for the research described in this paper since we use a large panel – , and even when those are available, a lack of common support between the treatment or enrolled group and the pool of nonparticipants may arise Second, the assumption that no selection bias has arisen from unobserved characteristics is very strong, and, what is more of a problem, cannot be tested for.
Having data about subsidized and non-subsidized sub-regions over time can also help with accounting for some unobserved selection bias by combining PSM and the Difference-in-Differences estimator (conditional DID estimator). The conditional DID estimator (e.g. Smith & Todd, Citation2005) is very applicable in the case that the outcome data about programme participants (i.e. subsidized sub-regions) and nonparticipants (non-subsidized sub-regions) is available for both ‘before’ and ‘after’ periods (2002 and 2008, respectively). In our study, PSM-DID measures the impact of the subsidies by using the differences in selected outcome indicator (ATE or ATT) between subsidized (D = 1) and non-subsidized sub-regions (D = 0) in the before and after situations. The main advantage of the PSM-DID estimator is that it can relax the assumption of unconfoundedness. The PSM-DID estimator also allows for quantile differences; that is, assessing the effects of subsidies at different points in the outcome variable’s (RDI scores) distribution. This means that we can compare individuals across both groups and time according to their quantile.Footnote5
5. Results
We present our results in four steps. We start with the derivation of the RDI, followed by a description of the balancing tests in the second step that helped to assess the appropriateness of the counterfactuals. This is followed by the estimation of ATT and finally, the DID results of impact assessment. The strategy we follow is somewhat similar to that applied by Michalek and Zarnekow (Citation2012a) for the construction of a Rural Development Index for Poland and Slovakia using 991 local indicators for the former, and 337 for the latter. Whilst a number of approaches for the selection of variables and construction of a development index exist (see Michalek & Zarnekow, Citation2012a for an excellent review of the pros and cons of these methods), selection bias and subjective weighting are likely to affect most processes. Thus, we ‘let the data choose’ and employ the maximum number of indicators (132 variables) that are available for all localities for all years, covering various fields of QoL including demographics (15 variables), health services (9), business units (2), tourism and catering (9), retail sector (24) transport (7), community infrastructure (14), environment (4), culture (2), unemployment (4), education (16), social protection (17) personal income tax (3), number of houses (5) and number of villages (1). We summarize the local data that is available for 3164 administratively independent settlements into 174 LAU 1 sub-regions (a much deeper level than the 20 regions available under the NUTS 3 nomenclature), the subject of our analysis. All variables were normalized by the total population in the given LAU 1 sub-region. Variables were grouped in 23 factors,Footnote6 some heterogeneous with a high number of variables, others more homogenous with a low number of variables (minimum 2). Factors were standardized with their annual mean and standard deviations, thus factor z-scores were used in the subsequent analysis. Based on composing variables and correlation coefficients, factors were sorted into dimensions. The most prominent factors, the regional development dimensions they belong to, and some other variables we included are presented in Table A1 in the Appendix. In the case of heterogeneous groups, higher correlation coefficient variables were considered more relevant. The largest and most heterogeneous factors are Factor 1 (28 variables), Factor 3 (20 variables) and Factor 2 (19 variables). Whilst Factor 2 and Factor 3 grouped variables that measure rather similar phenomena, the dimension of Factor 1 is far from obvious since it contains a large array of different variables. However, since in this factor the highest correlation coefficients were displayed by unemployment, personal income tax, number of automobiles, and number of firms – i.e. variables that describe the well-being of populations – it was sorted into the dimension of living conditions. Most of our factors describe various local living conditions and social services, but 58% of all variables are grouped into the first four factors, each belonging to a different dimension (see Table A1 in the Appendix).
Equation (1) was estimated both in terms of fix and random effects; the Hausman test, however, rejected the random effects model (chi2(23) = 113.66, p = .000). The modified Wald test for group heteroscedasticity (Greene, Citation2000 p. 598) in the fixed-effects model rejected the homoscedasticity assumption (chi2(174) = 5407.77, p = .000). Further, the Wooldridge (Drukker, Citation2003; Wooldridge, Citation2002) test for the first-order autocorrelation in panel data also rejected the null assumption (F(1,173) = 58.006, p = .000). Thus, linear regression methods with panel-corrected standard errors that assume heteroscedastic and contemporaneously correlated disturbances across panels were used. Sixteen of the 23 factors were significant in this regression, explaining almost 60% of the normalized net migration’s variance. presents the calculated RDI index in 2002 and 2008, and the change in RDI between 2002 and 2008, respectively. Development levels are sorted into quantiles, the top quantile being the darkest in colour, the lowest quantile the lightest. Results confirm our intuition. The 10 sub-regions with lowest and highest RDI indices are presented in Table A3 in the Appendix. Central and North-West Hungary are the most developed, whilst the Eastern, North-eastern and South Western sub-regions are doing worse. Graphical evidence does not suggest a major difference in the comparative levels of development of LAU 1 sub-regions between 2002 and 2008. The difference in the levels of development between 2002 and 2008 emphasizes the uneven development process of the sub-regions in this period.
Figure 2. RDI in 2002, 2008 and the change of RDI between 2002 and 2008. Source: Authors’ calculations, using STATA’s spmap command family.
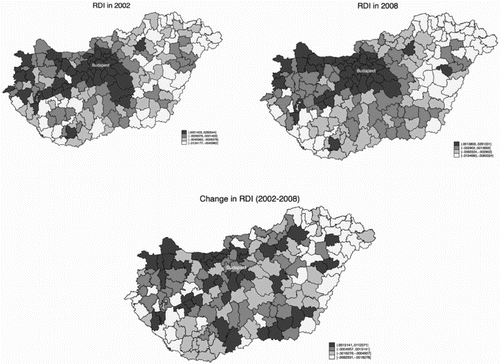
Comparison of to Figures A1–A3 in the Appendix clarifies that they do not overlap; i.e. graphical evidence suggests that it was not necessarily those sub-regions that were targeted that actually needed the most funds.
In line with the recent literature, we analysed the impact of regional development subsidies using PSM.Footnote7 The estimated propensity score is actually the probability of participation in a programme (treatment), conditioned on control variables calculated for all sub-regions. A number of matching algorithms are available for this, such as nearest neighbour, radius caliper, stratification matching, and kernel matching (Abadie, Drukker, Herr, & Imbens, Citation2004; Leuven & Sianesi, Citation2009). Whilst asymptotically all matching procedures should result in similar conclusions, small sample estimation may pose some problems. The following criteria were used to choose the appropriate matching algorithm: (a) standardized bias, (b) t-test and (c) common significance and pseudo R2.
Since all sub-regions received some development support, a necessarily subjective rule had to be created to differentiate between treated and non-treated sub-regions. For robustness, in the research described in this paper we employed two thresholds to separate the treated from the non-treated sub-regions: two-thirds of the median, and two-thirds of the mean. Thus, for each support variable (i.e. total subsidy per sub-region; subsidy per capita; subsidy per km²), sub-regions where the programme intensity was higher than two-thirds of the median and two-thirds of the mean were qualified as subsidized (i.e. treated). presents the results of the balancing tests between treated and non-treated sub-regions based on the covariates. Three definitions of subsidies, each with the two thresholds discussed above, were used. P-values are for the null hypothesis that the covariates are equal between treated and non-treated groups. Results emphasize that the correct matching approach was used (e.g. where the mean values of covariates were significantly different in the unmatched sample, after matching the null of mean equality across treated and untreated sub-regions may generally not be rejected). The rather few exceptions are emphasized in bold.
Table 3. Balancing tests of total subsidies, subsidies per cap., subsidies per km2 (common support: sub-region, biweight kernel) in subsidized and non-subsidized sub-regions.
One important prerequisite of using PSM methodology is assessing whether common support or overlap assumptions hold (Caliendo & Kopeinig, Citation2008). The test is based on the comparison of the distribution of estimated propensity scores in the treated and untreated samples. This may be done using graphical approaches (kernel density functions or histograms) or by applying parametric/non-parametric statistical tests. The result of Smirnov–Kolmogorov tests suggests that we may not reject the equal distribution of the two groups’ null hypothesis at the 1% significance level.
We assessed the ATT impact of development subsidies on sub-regions using two approaches (see (Abadie et al., Citation2004) for a discussion of pros and cons). First (top panel, ATT in ), non-parametric Kernel matching (using bootstrapped z values), and second (lower panel, SATT in ), nearest neighbour matching – allowing for bias adjustment and heteroscedasticity robust variance estimation – were employed.Footnote8
Table 4. Impact (ATT) of development subsidies on RDI levels.
presents the main results obtained through use of the above-mentioned approaches. Again, for robustness we employed two definitions for treated sub-regions (more support than two-thirds of the median, and two-thirds of the mean, respectively). However, regardless of the support variable that was used, we reached the same – quite unfortunate from a policy perspective – conclusion about the extremely low, and non-significant impact of subsidies on sub-regions.
Next, we present the results of PSM-DID – a process which can overcome hidden-bias, and may generally improve non-experimental programme evaluation. displays the results of DID and Quantile DID for some of the support variables.Footnote9 Note that the more-than-two-thirds-of-the-mean definition for treated regions could not be used with the DID estimations. Similarly, the subsidy per capita definition of support could not be matched either. Thus, focuses only on total subsidy and subsidy per km2.
Table 5. PSM-DID and Quantile PSM-DID results for the impact of total subsidy and subsidy per km2 on RDI levels.
PSM-DID estimates reinforce the ATT findings; namely, that it is difficult to find any positive effect for RDP funds upon the sub-regions’ level of development. Regardless of subsidy variable that is employed, results for most quantiles are not significant. For the total subsidy (left panel in ), none of the results, regardless of observed quantile, are significant. For subsidy per km2, the lower quantiles (Q10, Q20) are highly significant, albeit with low impact and have more of the opposite signs. For the upper quantile (Q90) results are also significant at 10%, but with an impact effect close to zero.
6. Conclusions
This paper has described an analysis of the impact of EU RD programmes on Hungarian regions using a multi-dimensional RDI to measure objectively the overall level of regional development and QoL of all individual regions at a highly disaggregated level (LAU 1) between 2002 and 2008. The main advantage of using a composite RDI is that it facilitates assessment of the various dimensions of RD programmes, including economic, social and environmental aspects. The effects of individual RD measures were investigated by means of a counterfactual analysis by applying a combination of PSM and difference-in-differences methods. Our main findings are the following: First, estimations suggest that EU subsidies concentrate on already well-supported regions. Second, we find considerable variation in terms of the level of subsidies during the period under analysis. Finally, and most importantly from a policy point of view, our results imply that we cannot identify any impacts of European development subsidies. The significance of the identified effects is rather low, and its direction may be positive or negative but it is always very close to zero. To assess the validity of these results we carried out sensitivity analyses in terms of impact indicators and methodological approaches. Our estimations suggest that our results are highly robust to alternative indicators and methodologies. Unfortunately, in the light of a lack of relevant research into the impact of European RDP it is difficult to assess the reliability our findings. However, Michalek (Citation2012) also finds negligible impacts for the SAPARD RD programme on Slovakian and Polish rural regions. These poor or negligible impacts of regional subsidies have several policy implications.
Notwithstanding the potential advantages of RDI, it is also important to highlight some of the limitations of the present research. The approach relied heavily on the availability of relevant data. Accordingly, we faced a trade-off between partial (and sometimes more theoretically based) indicators, and the more complex but readily available data-driven indicators. Although our composite indicator captures the main dimensions of RD programmes, further efforts are needed to construct both theoretically based and empirically feasible evaluation indicators for accurately assessing the effects of RD programmes.
Supp1.docx
Download MS Word (949.3 KB)Disclosure statement
No potential conflict of interest was reported by the authors.
ORCID
Zoltán Bakucs http://orcid.org/0000-0003-1071-6494
Additional information
Funding
Notes
1 PHARE: Poland and Hungary: Assistance for Restructuring their Economies, ISPA: Instrument for Structural Policies for Pre-Accession, SAPARD: Special Accession Programme for Agriculture and Rural Development
2 T-STAR is a database system used by the Hungarian Central Statistical Office that collects the most important settlement-level statistics for all Hungarian localities by time and nature of data.
3 In Michalek and Zarnekow (Citation2012a), Model 2 extends Model 1 to account for spatial autocorrelations, Model 3 incorporates migration-related transaction costs, and Model 4 uses information with respect to the destination region of migration to compute RDI differentials.
4 Dose Response Treatment Models that employ a continuous treatment variable (untreated: whose level is 0 and treated: whose treatment level ranges between >0 and 100%) are also available in the literature (see e.g. Cerulli, Citation2015 or Hirano & Imbens, Citation2004), yet require more assumptions and are technically somewhat demanding. Use of these models generated the same conclusions as the binary treatment variable models employed in this paper. Results are available upon request.
5 See Athey and Imbens (Citation2006) and Imbens and Wooldridge (Citation2009) for an overview of the quantile PSM-DID method.
6 Variables with loadings of above 0.4 were retained after rotation.
7 We use the psmatch2 STATA routine for the estimation
8 We apply the STATA nnmatch program developed by Abadie et al. (Citation2004).
9 The STATA module diff by Villa (Citation2011) was used for estimations.
References
- Abadie, A., Drukker, D., Herr, J. L., & Imbens, G. W. (2004). Implementing matching estimators for average treatment effects in Stata. Stata Journal, 4(3), 290–311.
- Afifi, A. A., May, S., & Clark, V. A. (2003). Computer-aided multivariate analysis (4th ed.). Boca Raton: Chapman and Hall/CRC.
- Athey, S., & Imbens, G. W. (2006). Identification and inference in nonlinear difference-in-differences models. Econometrica, 74(2), 431–497. doi: 10.1111/j.1468-0262.2006.00668.x
- Balogh, P. (2012). Counterfinality in development policy? An economic-sociological analysis of the EU-funds (PhD thesis). Corvinus University of Budapest, Budapest.
- Baltagi, B. H. (2008). Econometric analysis of panel data (4th ed.). Chichester: Wiley.
- Beluszky, P., & Győri, R. (1999). A magyarországi városhálózat és az EU-csatlakozás. Tér És Társadalom, 13(1–2), 1–30. doi: 10.17649/TET.13.1–2.510
- Bíró, P., & Molnár, L. (2004). A kistérségi szintű relatív fejlettség meghatározása. Területi Statisztika, 44(6), 564–585.
- Bodnár, G. (2016). Az endogén fejlődés tényezőinek vizsgálata rurális térségekben PLS-útelemzés segítségével (doktori disszertáció, kézirat). Szegedi Tudományegyetem, Közgazdaságtudományi Doktori Iskola, Szeged.
- Breustedt, G., & Glauben, T. (2007). Driving forces behind exiting from farming in Western Europe. Journal of Agricultural Economics, 58(1), 115–127. doi: 10.1111/j.1477-9552.2007.00082.x
- Caliendo, M., & Kopeinig, S. (2008). Some practical guidance for the implementation of propensity score matching. Journal of Economic Surveys, 22(1), 31–72. doi: 10.1111/j.1467-6419.2007.00527.x
- Cerulli, G. (2015). Econometric evaluation of socio-economic programs. Berlin: Springer.
- Csatári, B. (1999). A kedvezményezett kistérségek besorolásának felülvizsgálata (összefoglaló zárójelentés). Kecskemét: MTA RKK Alföldi Tudományos Intézet.
- Cserháti, I., Dobosi, E., & Molnár, Z. (2005). Regionális fejlettség és tőkevonzási képesség. Területi Statisztika, 45(1), 15–33.
- Douglas, S., & Wall, H. J. (1993). ‘Voting with your feet’ and the quality of life index: A simple non-parametric approach applied to Canada. Economics Letters, 42(2), 229–236. doi: 10.1016/0165-1765(93)90067-M
- Douglas, S., & Wall, H. J. (2000). Measuring relative quality of life from a cross-migration regression, with an application to Canadian provinces. In Research in labor economics (Vol. 19, pp. 191–214). Emerald Group.
- Drukker, D. M. (2003). Testing for serial correlation in linear panel-data models. Stata Journal, 3(2), 168–177.
- Elek, S., Fertő, I., & Forgács, C. (2010). The possible effects of the CAP reform on farm employment in Hungary. Agricultural Economics Review, 11(2), 29–33.
- Esposti, R. (2007). Regional growth and policies in the European Union: Does the common agricultural policy have a counter-treatment effect? American Journal of Agricultural Economics, 89(1), 116–134. doi: 10.1111/j.1467-8276.2007.00967.x
- European Commission (EC). (2006). Evaluation methods for the European Union’s external assistance (p. 99). France.
- Faluvégi, A. (2004). A társadalmi-gazdasági jellemzők területi alakulása és várható hatásai az átmenet időszakában. Budapest.
- Faluvégi, A., & Tipold, F. (2007). A területfejlesztés kedvezményezett térségeinek 2007. évi besorolása. Területi Statisztika, 47(6), 523–540.
- Faragó, L. (2016). Az EU területi politikájának a változásai közép-kelet-európai nézőpontból. Tér És Társadalom, 30(2), 3–22. doi: 10.17649/TET.30.2.2765
- Fazekas, K. (1997). Válság és prosperitás a munkaerőpiacon. A munkanélküliség regionális sajátosságai Magyarországon 1990–1996 között. Tér És Társadalom, 11(4), 9–24. doi: 10.17649/TET.11.4.447
- Greene, W. H. (2000). Econometric analysis (6th ed.). Upper Saddle River, NJ: Prentice Hall.
- Guo, S., & Fraser, M. W. (2010). Propensity score analysis: Statistical methods and applications. Los Angeles, CA: Sage.
- Hahn, C. (2004). A térségi fejlődést befolyásoló tényezők Magyarországon. Területi Statisztika, 44(6), 544–563.
- Hirano, K., & Imbens, G. W. (2004). The propensity score with continuous treatments. In A. Gelman & X.-L. Meng (Eds.), Applied Bayesian modeling and causal inference from incomplete-data perspectives (pp. 73–84). Chichester: Wiley.
- Horváth, G. (2004). A strukturális politika és a kelet-közép-európai régiók. Területi Statisztika, 7(3), 236–251.
- Imbens, G. W., & Wooldridge, J. M. (2009). Recent developments in the econometrics of program evaluation. Journal of Economic Literature, 47(1), 5–86. doi: 10.1257/jel.47.1.5
- Jeney, L., & Varga, Á. (2016). A felzárkóztatás eredményei és kudarcai az Encsi járásban. Területi Statisztika, 56(2), 183–208. doi: 10.15196/TS560205
- Kovács, Z. (2009). Urbanizáció és átalakuló városhálózat Kelet-Közép-Európában. Közép-Európai Közlemények, 2(4–5), 175–182.
- Leuven, E., & Sianesi, B. (2009). PSMATCH2: Stata module to perform full Mahalanobis and propensity score matching, common support graphing, and covariate imbalance testing. Boston College Department of Economics.
- Lukovics, M. (2008). Térségek versenyképességének mérése. Szeged: JATEPress.
- Lukovics, M., & Kovács, P. (2011). A magyar kistérségek versenyképessége. Területi Statisztika, 14, 52–71.
- Michalek, J. (2012). Counterfactual impact evaluation of EU rural development programmes – propensity score matching methodology applied to selected EU Member States. Volume 2: A regional approach (JRC Scientific and Policy Reports No. JRC72060) (p. 79). European Commission, Joint Research Centre.
- Michalek, J., & Zarnekow, N. (2012a). Application of the rural development index to analysis of rural regions in Poland and Slovakia. Social Indicators Research, 105(1), 1–37. doi: 10.1007/s11205-010-9765-6
- Michalek, J., & Zarnekow, N. (2012b). Construction and application of the rural development index to analysis of rural regions (JRC Scientific and Policy Reports) (p. 92). European Commission, Joint Research Centre.
- Nakajima, K., & Tabuchi, T. (2011). Estimating interregional utility differentials. Journal of Regional Science, 51(1), 31–46. doi: 10.1111/j.1467-9787.2010.00698.x
- Obádovics, C. (2004). A vidéki munkanélküliség térségi eloszlásának elemzése (doktori disszertáció, kézirat). Szent István Egyetem, Gazdálkodás és Szervezéstudományok Doktori Iskola, Gödöllő.
- Petrick, M., & Zier, P. (2012). Common agricultural policy effects on dynamic labour use in agriculture (Structural Change in Agriculture/Strukturwandel im Agrarsektor (SiAg) Working Papers No. 134425). Humboldt University Berlin, Department of Agricultural Economics. doi: 10.1016/j.foodpol.2012.07.004
- Pufahl, A., & Weiss, C. R. (2009). Evaluating the effects of farm programmes: Results from propensity score matching. European Review of Agricultural Economics, 36(1), 79–101. doi: 10.1093/erae/jbp001
- Ritter, K. (2008). Agrárfoglalkoztatási válság és a területei egyenlőtlenségek (doktori disszertáció, kézirat). Szent István Egyetem, Gazdálkodás és Szervezéstudományok Doktori Iskola, Gödöllő.
- Rosenbaum, P. R., & Rubin, D. B. (1983). The central role of the propensity score in observational studies for causal effects. Biometrika, 70(1), 41–55. doi: 10.1093/biomet/70.1.41
- Smith, J. A., & Todd, P. E. (2005). Does matching overcome LaLonde’s critique of nonexperimental estimators? Journal of Econometrics, 125(1–2 Spec. Iss.), 305–353. doi: 10.1016/j.jeconom.2004.04.011
- Swinnen, J., & Van Herck, K. (2010). Compensation payments in EU agriculture. Centre for Economic Policy Research, The World Bank.
- Terluin, I. J., & Roza, P. (2010). Evaluation methods for rural development policy. LEI Wageningen UR.
- Tiebout, C. M. (1956). A pure theory of local expenditures. Journal of Political Economy, 64(5), 416–424. http://www.journals.uchicago.edu/doi/10.1086/257839
- Villa, J. M. (2011). DIFF: Stata module to perform differences in differences estimation. Boston College Department of Economics.
- Wirth, B. (2013). Ranking German regions using interregional migration – what does internal migration tells us about regional well-being? Louvain-la-Neuve: European Regional Science Association (ERSA). Retrieved from https://www.econstor.eu/handle/10419/124143
- Wooldridge, J. M. (2002). Econometric analysis of cross section and panel data. Cambridge, MA: The MIT Press.