
 ?Mathematical formulae have been encoded as MathML and are displayed in this HTML version using MathJax in order to improve their display. Uncheck the box to turn MathJax off. This feature requires Javascript. Click on a formula to zoom.
ABSTRACT
Industrial land is under transition globally. Insights into this transition are important to plan a sustainable future. Since industrial land follows parcel shapes and the transition process requires multi-year data to observe the impacts of such changes, multi-year vector data should be used to analyse industrial land transition. This paper presents a framework to analyse path-dependent regional industrial land transition processes using vector data. A step by step instruction is presented. In the analysis, the changed percentages of land use in the surroundings of appeared or disappeared industrial land are visualized. The visualized surrounding land use compositions give planners an idea on what causes land use transitions, the most frequent transition forms and their impacts on the surroundings, purely from a land use point of view to reduce data collection efforts. The North Brabant region in the Netherlands is used as a case study. The region is split into urban and non-urban areas to show the generic applicability of this framework.
Highlights
The industrial land redevelopment trend requires understanding of land use transition mechanisms to plan a sustainable future. This paper presents a generic framework to systematically analyse regional industrial land transition and the impacts of such change on the surrounding land uses, purely based on land use data to reduce data collection and manipulation effort.
The analysis incorporates vector data from three years to detect changed industrial land in the first two years and the influences on the surroundings afterwards.
Four aspects of regional industrial land transition are analysed: the inertia for industrial land to stay, the surrounding land use compositions that cause industrial land to appear, the most common transition types for industrial land in a region and the impacts of each industrial land transition on the surrounding land use compositions.
A generic framework is presented to analyse industrial land transition process.
Vector maps are applied to minimise information loss for detailed industrial land use.
Path-dependence of land use redevelopment impacts is addressed by using land use data from three years.
Impacts of industrial land transition on surrounding land use compositions are emphasized, for each industrial land transition type.
Regional industrial land transition characteristics are identified which can help design future industrial land transition planning practice.
Sub-regions are analysed to show the generic applicability of the framework.
1. Introduction
1.1. The disused industrial land problem and the trend for transition
The disused industrial land problem is a global concern. For example, in Asia, local governments in China provide more industrial land than needed to attract investment and compete with their neighbouring cities (Huang & Du, Citation2016). Because of this, much of the industrial land sold is not entirely used or even abandoned. As a result, during the period from 2001 to 2005, 8.78 million square m of industrial land was in need of transition in China (Xie & Li, Citation2010). In North America, de Sousa (Citation2006) has examined the 11 largest Canadian cities and found over 1,900 brownfields amounting to around 113 million square m. Another study in the US shows that total brownfield land in a subset of 158 cities amounted to almost 390 million square m (The United States Conference of Mayors, Citation2006). In Europe, the same problem exists. According to a survey, around 379 million square m of land in England were either vacant or derelict (National Statistics, Citation2010). Disused industrial land is typically categorised as brownfield, a term that perhaps lacks a clear and well understood definition. Adams, de Sousa and Tiesdell have provided a good insight into the differences of terms used in this field (Adams, De Sousa, & Tiesdell, Citation2010): in the UK, brownfield means previously developed land as opposite of greenfield, which does not necessarily need to be contaminated, while in North America, brownfield is known or potentially contaminated land. In this study, to reduce confusion, the term industrial land is used. In the Netherlands, the same problem exists. At the beginning of twenty-first century, the unrealism in new industrial land demand estimation, the financial profitability of developing new industrial land and mutual competition among municipalities led to the redundantly large supply of very cheap industrial land (Olden, Citation2007; van der Krabben & Buitelaar, Citation2011). Industrial land users tend to move to new industrial land than to stay on the same land. According to the Dutch national industrial land database IBIS, 1,052 industrial land contains signs of obsolescence, equalling 28% of all industrial areas in 2012 (ARCADIS, Citation2014). What is different in the Netherlands as in other countries (i.e. US, UK) is that the interventions are undertaken at an early stage when there is sign of decaying or declining, which makes fewer places subjected to redevelopment but to improvements such as infrastructure improvement, investments in the public realm, relocation of undesired activities and the acquisition and demolition of obsolete properties and provision of building land in order to promote redevelopment. Most of the regeneration initiatives on industrial land are undertaken by municipalities whereas the majority of these initiatives do not involve redevelopment projects since policy officials responsible consider regeneration initiatives primarily as a means to promote local economic development. However, political motives might have driven the decisions to redevelopment schemes, just as in other countries (Ploegmakers & Beckers, Citation2015).
The scarcity of land resources necessitates many countries to reduce the amount of obsolete industrial land, especially for densely populated ones where opportunities can only be found in a sea of brown spaces, as argued by de Sousa (Citation2014). Furthermore, the transition of industrial land can bring quite a lot of benefits as argued by de Sousa and Ghoshal (Citation2012) and Loures and Vaz (Citation2018). Therefore, industrial land transition has been put on the political discussion table. Specifically, in the Netherland, more and more attention is put on industrial land transition to improve city vitality, to reduce increasing pressure on the available land and to stimulate the economy (Louw & Bontekoning, Citation2007). The new Spatial and Planning Act (Ministerie van Infrastructuur en Milieu, Citation2011) is enforced in 2008, and it is expected to be integrated into the new Environment and Planning Act (Ministerie van Infrastructuur en Milieu, Citation2016) in 2019. These new acts aim to simplify procedures to speed up the decision-making process and to enable the application of laws conforms to the current regional situation. This new regulation makes industrial land transition process more accessible than before. Regions and municipalities can take more initiatives to redevelop industrial land. Recently, the relatively heavy transition tasks are located in the provinces of North Brabant, North Holland, South Holland and Gelderland (Nijssen & Kremers, Citation2013, p. 7). However, governments should be cautious in applying pro-active transition strategies since these transitions bring significant environmental, social, economic impacts on the interdependent urban systems (van der Krabben & Jacobs, Citation2013).
1.2. Research efforts for industrial land transition impact analysis and gaps
Research efforts on industrial land transition impacts analysis are listed in this section. Literature on the impact of disused industrial land on surrounding property values can be found, for example in the Dutch North Brabant case by de Vor and de Groot (Citation2011). An American case is applied to illustrate the impacts of industrial land transition on neighbouring housing prices(Woo & Lee, Citation2016). Similarly, 36 redeveloped industrial heritage land in the Netherlands are studied to evaluate whether the transition has caused positive external effects by the changed nearby residential area housing prices (van Duijn, Rouwendal, & Boersema, Citation2016). Another example from a Hong Kong case on the building level reveals that there are some positive indications that property values may increase after the revitalisation of old industrial buildings (Mesthrige, Wong, & Yuk, Citation2018).
For the impacts on other aspects besides property values, Wcisło, Bronder, Bubak, Rodríguez-Valdés, and Gallego (Citation2016) illustrate the role of human health risk assessment -a social aspect- in the contaminated industrial land transition planning process, using a case from Spain. A GIS-based tool called STEPP (Carsjens & Ligtenberg, Citation2007) is developed to support local authorities in evaluating industrial land transition impact changes on environmental issues such as noise, smell, dust and danger, using a Dutch case from Nijmegen. Energy and climate change evaluation is actively researched in the environmental assessment for industrial land transition, both on project level (Hartmann, Török, Börcsök, & Oláhné Groma, Citation2014) and on a city level (Hou et al., Citation2018; Koch, Bilke, Helbig, & Schlink, Citation2018).
For a more holistic assessment of industrial land transition on the project level, see (Zhu, Hipel, Ke, & Chen, Citation2015) and on a building level, see (Chan, Cheung, & Wong, Citation2015). The Dutch Environmental Assessment Agency has published a report about business zone transition conditions, wherein the most influential attributes that determine the transition possibilities are identified (Renes, Weterings, Gordijn, & Langeweg, Citation2009). IBIS data, which documents the Dutch business land, concerning working locations (ARCADIS, Citation2014), is used. As shown in the literature, the outcome of a redeveloped project is unique and difficult to foresee, in many aspects, for different contexts and on different scales.
Even though these are fascinating researches and detailed analysis, further research is needed regarding industrial land transition analysis from four aspects.
Firstly, additional research can be directed at uncovering what drives industrial land to change and the impacts of these changes. There are two main types of drivers for land use change: bio-physical and socio-economic drivers. The bio-physical drivers include characteristics and processes of the natural environment while the socio-economic drivers comprise demographic, social, economic, political and institutional factors and processes (Briassoulis, Citation2000). The industrial land transition process, which is mostly initiated by policymakers, based on historical development, suitability of land and neighbourhood situations has influences on the future land use compositions, as has been stated by van Schrojenstein Lantman, Verburg, Bregt, and Geertman (Citation2011). The four core principles of land use change are: continuation of historical development; suitability of land; the result of neighbourhood interaction or the result of actor interaction. Industrial land transition is a path-dependent process. A path here means the approach an industrial land is designed to be transit into. What industrial land has been transformed into can change future land use trajectories. It is important to evaluate the impacts of a transition plan on the future land use compositions so that future scenarios can be evaluated on physical aspects besides the commonly applied environmental, social and economic aspects, especially for each different industrial land transition type. However, this has not yet received much attention. As argued by Banzhaf et al. (Citation2017), questions such as ‘what role do specific land-use types have under certain conditions?’ and ‘how will they be changing?’ need to be answered. Hansen (Citation2012) argues, detailed data from at least three not consecutive years are needed to compare land use compositional changes of a longer period, and they need to be collected from the same reliable source and manipulated consistently, and the effort in acquiring and long-time of manipulating data for decision support should be considered. Even though Nygaard and Meen have contended that this process of path dependency and spatial lock-in requires data over a period of 100 years (Citation2013), examples presented by McCauley, Rogan, Murphy, Turner, and Ratick (Citation2015) in USA and by Verburg, van Eck, de Nijs, Dijst, and Schot (Citation2004) in the Netherlands have shown a shorter period (15 and 8 years respectively) can also demonstrate such behaviour and these studies show that policies have an important influence on land use patterns.
Secondly, the urban unit is organised based on parcels in reality (Barreira-González, Gómez-Delgado, & Aguilera-Benavente, Citation2015; Lu, Cao, & Zhang, Citation2015). As a result, industrial land transition requires precise information of feature shapes, especially for the features with irregular shapes (Lu et al., Citation2015; Moreno, Wang, & Marceau, Citation2009).
Thirdly, it is needed to understand the reason behind and the impacts on each specific region where industrial land transition is located. In other words, this analysis is context specific. As Hagoort, Geertman, and Ottens (Citation2008) claimed, the neighbourhood rules need a sound empirical foundation before they can be applied to support spatial policy. Other researchers have also suggested that the land change process is to a great extent shaped by historically produced, locally specific social structures (Briassoulis, Citation2008; McCauley et al., Citation2015; Verburg et al., Citation2004).
Lastly, the impact analysis and data manipulation process should be not too much time-consuming. Computer tools are needed to manipulate data and analyse regional land use change patterns to provide generic analysis possibilities for each region (Wang, Shen, & Tang, Citation2015).
1.3. Research scale and boundaries
This research focuses on understanding land use transition from a physical point of view, with a focus on the Netherlands. In the Netherlands, scholars have concluded that the most suitable and sufficient scale to do research is on the regional level instead of on the local or national level (VROM-raad, Citation2006). For one thing, spatial-economical processes are better connected on the regional level. For another, the functional and financial aspects of industrial land supply can be tailored most effectively. This claim has been supported by other researchers as well, such as de Sousa (Citation2017) who compared the North American brownfield transition practice with European practices and claimed that the transition process should be connected to the regional level.
The boundaries are set as follows: in this study, the focus is on the land use system itself rather than other external influencing systems such as economic systems and demographic systems. Moreover, existing land use patterns influence future land use in three ways: the inertia of land uses in a location which reflects the land uses persist over time is one thing; the ease of land use conversions which represents the hierarchy of land use attractions for users is another and the last is the attraction or repulsion effects from surrounding land uses whose influence decreases with increasing distance till zero according to Tobler’s first law of geography (Tobler, Citation1970; van Vliet et al., Citation2013). Even though the Dutch planning practice for industrial land is more proactive which means that instead of redevelopment, more emphasis is put on physical improvement of industrial land (not changing industrial use), this study tries to find correlations between surrounding land uses and changed industrial land.
1.4. Objectives
Based on the identified gaps, this study provides a systematic and generic way to analyse regional industrial land transition process and understand interactions between neighbouring land uses, especially for the industrial land transition impacts on the surroundings. Analysing land use data from at least three non-consecutive years is necessary considering the path-dependency. Vector land use data should be used for detailed land use planning tasks such as industrial land transition. It should be straightforward for policymakers to understand and apply. The method should also be applicable to other land use type transition analyses. Effective ways for detecting industrial land transition and analysing the impacts of such a transition on the surroundings should be provided in this research without requiring much data effort on data collection.
In this paper, a generic framework for industrial land transition analysis is proposed, with the consideration of vector shapes and path dependency. The analysis process helps to find four important aspects of industrial land transition: the inertia for industrial land to stay, the attractiveness of surrounding land uses for industrial land to appear, the most common transition forms for industrial land and the impacts of industrial transitions on the surrounding land uses. This analysis procedure is also used to derive neighbourhood land use interaction rules for cellular automata land use change simulation models in another paper (Wang, Han, & de Vries, Citation2017a). The analysis framework can also help policymakers to evaluate their transition plans and plan the future land uses in a sustainable way, combined with case-based reasoning (Wang, Han, & de Vries, Citation2017b).
2. Methodology
2.1. Analysis framework
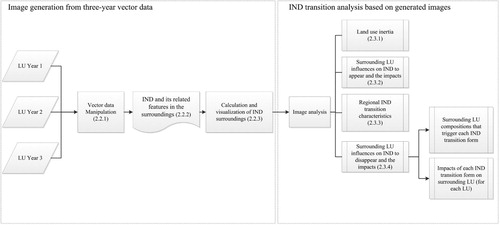
The proposed framework is presented in . It also serves as a reading guide by showing which part is explained in more details. In the first stage, vector land use maps from three non-consecutive years are manipulated to identify industrial land and their surrounding features. Based on the sizes of these related surrounding features, industrial land neighbourhood compositions can be calculated and visualized. In the second stage, automatically generated images showing neighbourhood compositions of industrial land are analysed to show the inertia of industrial land, surrounding land use influences on industrial land, and regional industrial land transition characteristics.
Figure 1. Industrial land transition analysis framework (LU: land use; IND: industrial land).
2.2. Image generation from three-year vector data
This process is used to manipulate land use data in a generic way and generate industrial land surrounding land use composition images for the analysis processes.
2.2.1. Vector data manipulation
For an effortless data manipulation process, an FME® script is developed for the automatic manipulation of three-year vector land use maps. The script is developed with Safe Software FME® Desktop version 2015.1.0.1 (FME desktop, Citation2016). FME is a visual programming environment in which spatial data can be manipulated by transformers that affect either geometry of features or their attributes. More details about the script can be found from a previous paper (Wang et al., Citation2017a).
The following procedures are performed in the data manipulation process. Firstly, the three-year land use information is combined in one map and the unique code for each land use combination in these three non-consecutive years is calculated. This process ensures that each feature has a unique land use combination code. For example, in the year 1, one feature is industrial land with land use code 5 and in the year 2, it is transformed into residential land with land use code 2. In year 3, it stays as residential land. Thus, the unique code for this feature is 050202. Likewise, code 050503 means that, in year 1 and 2, a feature is industry and is transformed into retail in year 3. These codes are used to detect industrial land transition frequencies. More details are shown in section 3.3. The dissolver function is used to remove common boundaries between neighbouring features once they have the same land use combination code. Line-alike features are deleted for their huge influence on the calculation of neighbourhood percentage. These features are transportation networks and waterways. Features that are smaller than 10,000 square m are deleted since industrial land are usually bigger.
2.2.2. Industrial land and its related features in the surroundings
In this step, industrial land and their surrounding features are identified so that the surrounding composition calculation in the following step becomes possible. Two configurations of spatial-relators are used to determine relationships between industrial land and their surrounding features. The first configuration assesses the surrounding feature intersection with a certain buffer radius of an industrial land. The other configuration is to exclude features completely embedded in a smaller buffer zone of the same industrial land. These latter features’ impacts need to be eliminated since they are already calculated in the previous smaller buffer zone.
2.2.3. Calculation and visualization of industrial land surroundings
To easily analyse the neighbouring compositions of industrial land, intuitive images are generated. These images show the relative presence of each land use type near industrial land. Each land use type’s regional distribution expectation is considered. This is a normalization process in which the local prevalence of a land use type around an industrial land is compared with the general prevalence of this land use in the entire region.
Aggregating, calculating and visualizing the results are accomplished in a Python® script in version 2.7.5 (“Python v2.Citation7.Citation5 documentation,” Citation2013). The script generates images showing appeared and disappeared industrial land surroundings from 100 to 800 m (8 buffer zones). 800 m distance is the normally applied distance for CA land use models (Abolhasani, Taleai, Karimi, & Rezaee Node, Citation2016). More details about the script can be found from a previous paper (Wang et al., Citation2017a).
2.3. Industrial land transition analysis based on generated images
Industrial land transition analysis is divided into four parts: (1) non-changed industrial land are analysed to define the inertia; (2) graphs showing the attractiveness and repulsiveness of other land use types on industrial land to appear within various distances are analysed; (3) industrial land that have been transformed into other land uses are analysed by their frequencies and the most common applied transition forms are identified; (4) the impacts of these conversions on the surrounding land uses are analysed by comparing surrounding land uses percentage changes before and after the transitions.
2.3.1. Industrial land inertia
In this step, the tendency of land use to stay the same, its inertia, is analysed. Metrics for land-use maps from year 1 and year 3 are compared in a contingency table. This is a matrix that shows how much one land use has changed into another, for all combinations of land use. The contingency table is used to derive the inertia of each land use types. The inertia of one land use type is proportional to a target land use types’ inertia based on the unchanged rates of these two land use types. Detailed analysis for the case study is in section 3.2.
2.3.2. Surrounding land use influences on industrial land to appear and the impacts
This process identifies surroundings that trigger industrial land to appear and studies the impact that these new industrial lands have on the surroundings.
For each land use type transit to industrial land, the image for surrounding land use compositions before this transit can be used to see what type of surroundings can trigger such transition. The image for surrounding land use compositions after this transit can be used to see what the impacts of such transition are. Section 3.3 gives a detailed analysis for the case study area.
2.3.3. Regional industrial land transition characteristics
A transition frequency table can be generated for analysing the regional industrial land transition characteristics. The most common applied transition types can be identified for each region and this can help planners to design future industrial land transition types. Section 3.4 gives a detailed analysis for the case study area.
2.3.4. Surrounding land use influences on industrial land to disappear and the impacts
This process identifies surroundings that trigger industrial land to disappear and studies the impact that these disappeared industrial lands have on the surroundings. Planners can use such evidence to evaluate their industrial land transition plans based on future possible land use surrounding scenarios, based on the empirical evidence from the same region.
Since this study focuses on understanding the impacts of industrial land transition on the surroundings, each industrial land transition type is going to be analysed in detail. For each industrial land transition, the surrounding land use compositions before and after the transition are going to be visualized and analysed. The image for surrounding land use compositions before this transit can be used to see what type of surroundings can trigger such transition. The image for surrounding land use compositions after this transit can be used to see what the impacts of such transition are. Section 3.5 gives a detailed analysis for the case study area.
3. Case study results and discussion
This chapter starts with the case study area and data source introduction, followed by each step proposed in the methodology part. This chapter ends with the comparison of urban and non-urban areas to show the generic applicability of this framework.
3.1. Study area and data
The North Brabant region has been chosen as the case study for its sustainable ambition and the industry and research oriented regional characteristics. Much industrial land in this region has been redeveloped since the twenty-first century because of the limited land resources.
In this research, land use data comes from the Dutch cadastre organization Kadaster (Centraal Bureau voor de Statistiek & Kadaster, Citation2010, Citation2013). Cadastral data ensures high-quality data and the parcel shapes are well preserved. Land use data from the year 2000, 2008 and 2012 are used. The disappeared industrial land between the year 2000 and 2008 are used to check the influence of such transition on the surroundings in the year 2012.
3.2. Industrial land inertia
gives an illustration of how contingency tables look. Public facilities include municipal facilities, police stations, and prisons. Social-cultural facilities are used for museums, universities and conference centres. (Centraal Bureau voor de Statistiek, Citation2003). Note that we have used cell numbers since we have deleted features with sizes less than 10,000 m2 in the detection of land-use transitions, but these features are also crucial for inertia evaluation. For example, 87% of industrial land remained unchanged from 2000 to 2012 (2000: 10752 cells; 2012: 9351 cells), equivalent to a rate of 0.87. While for retail land, the rate unchanged is 0.74 (2000: 773 cells; 2012: 573 cells). If the industrial land’s inertia is scaled to 100 in the land-use model, retail land’s inertia will take on a value 100*(0.74/0.87), or approximately 85. This can be explained by the fact that industrial land is more challenging to change considering the complicated transition process, compared to retail land. The inertia of other land use is analysed in the same way.
Table 1. Contingency table for land use from year 2000 and year 2012.
3.3. Surrounding land use influences on industrial land to appear and the impacts
In , the left-hand image shows which surroundings tend to trigger a change from agricultural land use to industrial land use. The ‘After-Agriculture-to-Industry’ image on the right shows the neighbourhood composition after transition. The x-axis represents the distance from the new industrial land to other land uses (LU), and the Y-axis represents the relative presence of surrounding LU. This is calculated based on equation (1). A positive value means that one land-use type’s percentage near new industrial land is higher than its overall regional distribution, and vice versa.(1)
(1) From the left side of , within 100–800 m radius (X-axis), the relative presence of agriculture and industry are both positive, while the relative presence of other land-use types is negative. This shows that agricultural areas that change to industrial are surrounded by more than average amounts of industry and agriculture, but less than the average amount of other land-use types. Comparing the left and right side of , the relative presence of retail land is increased tremendously (green line) at all distances from new industry and that of industrial land increases within 300 m, as does recreational land. However, the relative presence of social-cultural facilities decreases within 100 and 500 m.
Figure 2. Surrounding land use influences for agricultural land to become industrial land and the impacts of such transition.
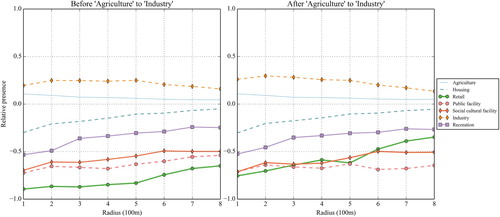
Planners can compare the change in relative presence of each land use type near newly appeared industrial land more thoroughly by splitting the image into each land use type. However, the emphasis of this research is to illustrate, and analyse, the process of industrial land transition, so land use types near new industrial land are not split here. The proposed process can be used as an evaluation procedure for land use development plans.
3.4. Regional industrial land transition characteristics
provides information on how industrial land are transformed in this region. This is based on the cadastre data from the first two years period. In our case study, this is from the year 2000 and the year 2008. can be used as a reference for scenario designs in case of further transitions in the region. From this frequency table, industrial land in North Brabant are mostly transformed into housing and retail. One of the reasons is that there are many expats and students living in major cities like Eindhoven and Tilburg. Local universities and big companies attract many people to move to the region. As a result, more accommodation is needed to meet the new market demands. Retail places are also necessary for these people. Other regions might have a different transition frequency table.
Table 2. North Brabant region industry transition frequency table based on features left (areas > 10,000 square m).
3.5. Surrounding land use influences on industrial land to disappear and the impacts
This process aims to find what causes industrial land to be transformed and the impacts of the transition on the surroundings. Generated images show changes in the relative presence of each land use type, both before and after an industrial land is transformed. The example in shows all the surrounding land use types near disappeared industrial land and the impacts on the surroundings of transitions from industrial to retail.
Figure 3. Surrounding land use influences for industrial land to become retail and the impacts of such transition.
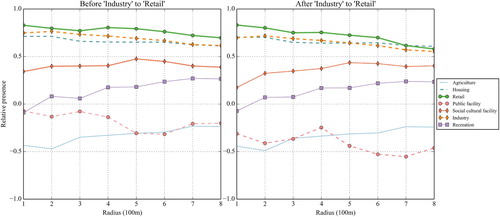
According to the left side of , before industrial land is transformed into retail, the relative presence of retail, industry, housing, and social-cultural facilities are all positive, which means that their percentages are all higher than their overall regional distribution. It is therefore concluded that industrial land with much retail, industry, housing and social-cultural facilities nearby, are easier to transform into retail. Comparing the left and right sides of , we can see that after such transitions, social-cultural facilities are reduced within 700 m (pink diamond on solid line), and public facilities (pink circles on dashed line) are much more reduced in the surrounding from 100 to 800 m.
These types of transition analysis help policymakers choose transition land and evaluate their land use transition proposals by showing the impacts on the surrounding land uses. If they want to redevelop an industrial land into a retail land, they need to check which surrounding compositions are more suitable to find such industrial land. For North Brabant region, industrial land near a high presence of retail, industry, housing and social-cultural facilities are suitable to be transit into retail according to the analysis. Moreover, based on the comparison before and after industry transition to retail in this region, shows that this transition causes less social-cultural and public facilities nearby. Other transition possibilities can be analysed in the same way.
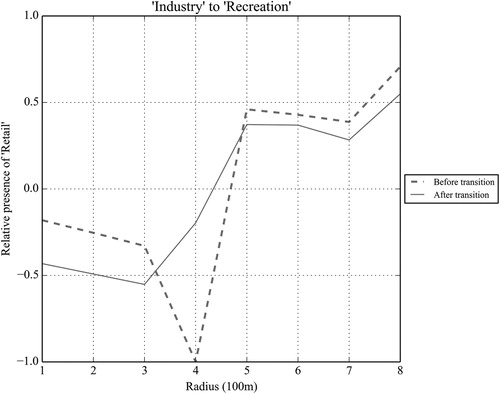
To analyse each transition more clearly, it is possible to show images for each specific land use type that address the differences before and after a specific transition form (such as an industrial transition), for each land use type in the surroundings. From all the images that are generated, the most obvious changes to the relative presence of surrounding land are listed are listed from . These images are based on every industrial land transition form in .
Figure 4. Relative presence changes in the surroundings of industrial land changed into housing.
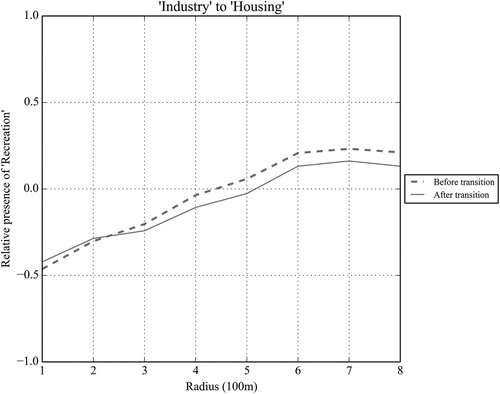
Figure 5. Relative presence changes in the surroundings of industrial land changed into retail.
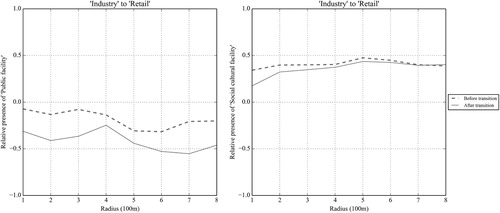
Figure 6. Relative presence changes in the surroundings of industrial land changed into public facilities.
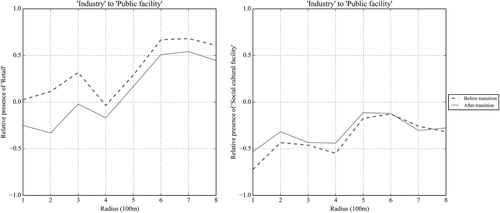
Figure 7. Relative presence changes in the surroundings of industrial land changed into social-cultural facilities.
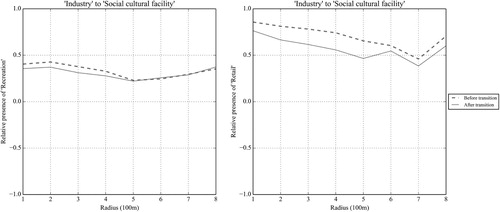
Figure 8. Retail relative presence changes after industry transformed into recreational land.
shows that the relative presence of recreational land is increased from 100 to 200 m after industrial land are transformed into housing. In other words, industrial land has a negative influence on recreation, compared with housing’s influence on recreation in this range. Beyond 200 m, there is less recreational land after the transition than before. This can be explained by the fact that new housing projects typically contain relatively small recreational areas nearby, so further recreational land are not that necessary anymore.
As explained in , public and social-cultural facilities are reduced after industrial land is transformed into retail. shows a more unobstructed view of what the influential ranges are. The existence of industrial land has a more positive impact than retail on social-cultural land within 700 m and on public facilities till 800 m. After all, large industrial land requires public facilities and social-cultural facilities nearby. While for retail areas such as department stores, these facilities are not commonly accommodated.
Compared with public facilities, industrial land has a more positive impact on retail at all scales since the relative presence of retail decreases after industrial land transform into public facilities. However, industrial land has adverse effects on social-cultural facilities within 100–600 m, as shown in . These retail land are often building-material shops or big supermarkets close to the industrial land which are ordinarily logistic centres. It is convenient for these shops to transport goods. After the transition, there are no longer any nearby public facilities since they cannot get their supply from industrial land as easily as before. However, more social-cultural facilities come near public facilities to accommodate the new function.
According to , the relative presence of recreational land is reduced within 500 m range where industrial land is transformed into social-cultural facilities. Retail is also reduced, with a longer range till 800 m. In other words, the existence of industry has a positive impact on retail and recreation compared with the existence of social-cultural facilities. This could be explained by the fact that industrial land requires more transition zones for environmental concerns.
shows that if industrial land is changed into recreational land, more retail facilities start to appear between 300 and 500 m. This also means, in reverse, that industrial land has a negative impact on retail at this distance. It is also clear from the image that there was no retail land whatsoever in North Brabant at 400 m distance of industrial land before the transition. This could be explained by the fact that not many industrial and retail features are left for analysis. Within 300 m, retail decreases after the industrial transition to recreational land. This shows the positive impacts of industrial land on retail, compared with recreational land impacts on retail. These retail land commonly represent large department stores which are generally near industrial land.
Up until now, the influence of industry on other land uses is found by comparing with each specific land use type. For example, in comparison with public facilities, industrial land has positive effects on retail but adverse effects on social-cultural facilities. However, the previously shown images only visualize the relative presence of one land use type surrounding specific industrial transitions. It is still difficult to determine whether the influence of industry as a whole is positive or negative on other land uses. Therefore, we have compared the relative presence of all types of land use around industrial land before and after the industrial land change, no matter which transition the industrial land undergo. If the percentage of one land use type is increased after the transition, then industrial land must have had a negative impact on this land use type before the transition.
The aggregate difference of relative presence for all land use types after and before the industrial land transition is shown in . Positive values show increased relative presence after industry transition, and vice versa. And increased relative presence reveals the negative influence of industrial land on this specific land use.
Figure 9. The difference in relative presence after industrial land transition.
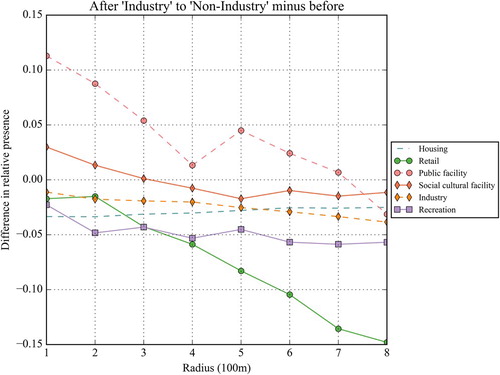
According to , the following observations can be made: Industrial land has adverse effects on public facilities (pink circles dashed line) from 100 to 700 m and social-cultural facilities (orange diamonds solid line) in the 100–200 m neighbourhood while an adverse effect on retail, recreation, and housing within 800 m. The positive influences of industry on these land uses could be explained by the fact that the North Brabant region is focusing on industrial transition and many facilities and accommodations are needed to meet the increasing demands on the market. Local governments are trying to redevelop industrial land to bring more economic activities and satisfy the current needs. Therefore, much industrial land is being transformed into other uses.
To summarize the land use transition analysis results for the North Brabant region, industrial land near a high concentration of retail, industry, housing, and social-cultural facilities but a lower concentration of other land uses is suitable for transitioning into retail and housing. The transition into retail causes less social-cultural (till 600 m) and public facilities (till 800 m) and the transition into housing attract more recreation (till 200 m), social-cultural (till 300 m) nearby but less retail and public-facilities from 100 m further. Industrial land is easier to transit into public-facilities if they are near more than the regional distribution of industry, retail, and housing, but less than the regional distribution of public, social-cultural facilities and recreation. And such transition from industry to public-facilities attracts more public-facilities (till 400 m) and social-cultural facilities (till 500 m), while reduces the amount of retail dramatically in the whole analysis range (800 m). Industrial land where all other land use types are more than regional distributions (except agricultural land) are more intended to transit into social-cultural facilities, and this causes less retail in the whole analysis range and less recreation till 500 m but more public-facilities till 400 m. Industrial land near more than average housing, industry, and social-cultural facilities but less than average retail, recreation, and public facilities are more intended to become recreational land, and this causes more retail between 300 and 400 m range and more recreational land within 300 m, but less housing (till 500 m) and less retail (till 200 m).
3.6. Urban & non-urban comparison
The whole of North Brabant is split into urban and non-urban areas. As a result, differences between urban, and non-urban, industrial land transition can also be analysed and it shows the robustness of the proposed approach. A frequency table is provided in .
Table 3. Urban and non-urban industry transition frequency table based on features left (areas > 10,000 square meters).
In urban areas, industrial land is mainly transformed into retail, housing, recreation and social-cultural facilities, while in non-urban areas; industrial land is mostly redeveloped into retail, housing and public facilities. There is more industrial land transformed in non-urban areas. This can be explained by the fact that recently more North Brabant housing projects have been allocated to non-urban areas because the permit acquisition process is simpler. To facilitate these housing projects, retail and public facilities must also be built. Since non-urban areas guarantee access to open spaces (treated by users as the equivalent of green spaces), little recreational space is created. However, in the urban areas, more recreation is needed for sustainable requirements.
4. Conclusions and further directions
The current trend of industrial land transition asks for a better understanding of industrial land transition mechanisms. Industrial land transition analysis can help policymakers to understand the reasons and impacts of industrial land use changes. A straightforward framework to analyse vector land use maps from three non-consecutive years with the focus on industrial land transition is presented in this paper. This helps to consider the real parcel shapes of industrial land and the path dependency of industrial land use change. This framework is generic and applicable to other areas.
Our proposed framework contains two parts, namely automatic data manipulation process and manual analysis process. The automatic process helps to manipulate vector land use data from three non-consecutive years in an effortless way. This process consists of the application of two scripts. The first script is used for identifying appeared and disappeared industrial land, together with the relevant features in their surroundings, using FME. The second script is used to calculate and visualize the percentage of each land use type surrounding appeared and disappeared industrial land. The images showing the relative presence of each land use type in the surrounding of industrial land are automatically generated by the Python script. These images give an intuitive guide for deriving land use change interaction rules to be used in the simulation models. This interpretation and analysis process of the images generated makes the analysis more transparent than pure automatically generated rules for stakeholders. A better understanding of the regional characteristics is achieved during the analysis. This transition analysis process supports planners in choosing transition land and evaluating their land use transition proposals by showing the impacts of their proposed strategies on the surrounding land uses. If planners want to redevelop an industrial land into a retail land, they need to check which surrounding compositions are more suitable to find appropriate industrial land.
The North Brabant region is used to illustrate the analysis framework. The North Brabant region is also split into urban and non-urban areas to check the robustness of the approach. The identified differences show the capability and robustness of the proposed framework.
To conclude, this generic analysis framework helps to incorporate land transition process into the land use planning practices. The analysis procedure can help land use policymakers to form new land use transition policies based on systematic analysis approach. A detailed understanding of the transition impacts and the factors that drive land transition in terms of surrounding land use compositions is achieved by analysing holistically regional industrial land transition based on empirical physical data. The analysis process finds out four aspects of industrial land transition, namely: the inertia for industrial land to remain; the surrounding land use compositions that cause industrial land to appear and the impacts on the surroundings of such changes; the most frequent transition forms of industrial land and the impacts on the surroundings for each industrial transition form. Furthermore, the approach makes the use of original feature shapes for incorporating industrial land transition process and land use maps from three non-consecutive years is sufficient, which renders its feasibility to apply this methodology with limited data requirements. Last but not least, the developed scripts can be plug-ins for various land use simulation and planning support systems such as Metronamica (van Delden et al., Citation2010, Citation2011; “Metronamica documentation,” Citation2012) and Land Use Scanner (Koomen, Hilferink, & Beurden, Citation2011) to integrate the impacts of such transition processes. Even though the focus in this study is mainly on industrial land transition analysis in the Netherland, the proposed framework provides a generic approach to analyse other land use transition processes in other regions.
Further research is possible in several ways. Successful redeveloped industrial land should be able to be detected from land use maps by analysing surrounding composition changes based on pre-set rules. For example, imagine after a transformation, the surrounding industrial area percentage increases. It could be argued that the transition process of that area is successful, provided that more industry comes nearby. If aiming for a greener environment, one can judge transition scenario by the changes of advent green or leisure areas in the surroundings. This depends on the objectives of policymakers and helps in designing sustainable transition strategies.
Regarding land use types, there is one limitation that the industrial land is stated as one land use type; while it can be argued that industrial land can be subdivided into several categories such as high-tech campus, heavy industry, light industry, creative industry and others. Future research can address more detailed industrial land use types to get more insights for regional industrial land transition process. For example, heavy industrial land which are contaminated are probably not suitable for residential land while other types of industrial land might be suitable. Xue, Zhang, Geng, Mitchell, and Ren (Citation2016) have stated this approach for brownfield transition exercises in China by proposing an extended coding system for land use types. A sub-type of industrial land transition (coalfield) case study is presented by Burke, Hough, Morgan, Hughes, and Lawrence (Citation2015), so as a case study for the creative industry by He and Gebhardt (Citation2014).
The current focus is to minimize the data collection and manipulation efforts and as a result, only vector land use data is applied which might cause insufficient planning support power. Future research can incorporate more data such as the existing IBIS data from the Netherlands to have a more holistic idea about industrial sites.
Disclosure statement
No potential conflict of interest was reported by the authors.
ORCID
Tong Wang http://orcid.org/0000-0003-2599-5000
Jan Kazak http://orcid.org/0000-0002-1864-9954
Qi Han http://orcid.org/0000-0001-9561-4547
Bauke de Vries http://orcid.org/0000-0002-7885-8221
Additional information
Funding
References
- Abolhasani, S., Taleai, M., Karimi, M., & Rezaee Node, A. (2016). Simulating urban growth under planning policies through parcel-based cellular automata (ParCA) model. International Journal of Geographical Information Science, 30(11), 2276–2301. doi: 10.1080/13658816.2016.1184271
- Adams, D., De Sousa, C., & Tiesdell, S. (2010). Brownfield development: A comparison of North American and British approaches. Urban Studies, 47(1), 75–104. doi: 10.1177/0042098009346868
- ARCADIS. (2014). Toelichting IBIS (pp. 1–8). Arnhem, the Netherlands: ARCADIS.
- Banzhaf, E., Kabisch, S., Knapp, S., Rink, D., Wolff, M., & Kindler, A. (2017). Integrated research on land-use changes in the face of urban transformations – An analytic framework for further studies. Land Use Policy, 60, 403–407. doi: 10.1016/j.landusepol.2016.11.012
- Barreira-González, P., Gómez-Delgado, M., & Aguilera-Benavente, F. (2015). From raster to vector cellular automata models: A new approach to simulate urban growth with the help of graph theory. Computers, Environment and Urban Systems, 54, 119–131. doi: 10.1016/j.compenvurbsys.2015.07.004
- Briassoulis, H. (2000). Analysis of land use change: Theoretical and modeling approaches. Regional Research Institute, West Virginia University. Retrieved from https://EconPapers.repec.org/RePEc:rri:wholbk:17
- Briassoulis, H. (2008). Land-use policy and planning, theorizing, and modeling: Lost in translation, found in complexity? Environment and Planning B: Planning and Design, 35(1), 16–33. doi: 10.1068/b32166
- Burke, H., Hough, E., Morgan, D. J. R., Hughes, L., & Lawrence, D. J. (2015). Approaches to inform redevelopment of brownfield sites: An example from the leeds area of the West Yorkshire coalfield, UK. Land Use Policy, 47, 321–331. doi: 10.1016/j.landusepol.2015.04.018
- Carsjens, G. J., & Ligtenberg, A. (2007). A GIS-based support tool for sustainable spatial planning in metropolitan areas. Landscape and Urban Planning, 80, 72–83. doi: 10.1016/j.landurbplan.2006.06.004
- Centraal Bureau voor de Statistiek. (2003). Productbeschrijving bestand bodemgebruik. Centraal Bureau voor de Statistiek. Retrieved from https://www.cbs.nl/NR/rdonlyres/5B353A4E-6B56-4756-A19C-4BF6AA520C65/0/BestandBodemgebruikProductbeschrijving.pdf
- Centraal Bureau voor de Statistiek, & Kadaster. (2010). Bestand bodemgebruik 2006 - BBG’06. Data Archiving and Networked Services (DANS). Retrieved from http://dx.doi.org/10.17026/dans-zvd-mwb9
- Centraal Bureau voor de Statistiek, & Kadaster. (2013). Bestand bodemgebruik - BBG 2010. Data Archiving and Networked Services (DANS). Retrieved from doi:10.17026/dans-x5e-3kgu.
- Chan, A., Cheung, E., & Wong, I. (2015). Impacts of the revitalizing industrial buildings (RIB) Scheme in Hong Kong. Sustainable Cities and Society, 19, 184–190. doi: 10.1016/j.scs.2015.08.005
- de Sousa, C. (2006). Urban brownfields redevelopment in Canada: The role of local government. The Canadian Geographer / Le Géographe Canadien, 50(3), 392–407. doi: 10.1111/j.1541-0064.2006.00148.x
- de Sousa, C. (2014). The greening of urban post-industrial landscapes: Past practices and emerging trends. Local Environment, 19(10), 1049–1067. doi: 10.1080/13549839.2014.886560
- de Sousa, C. (2017). Trying to smart-in-up and cleanup our act by linking regional growth planning, brownfields remediation, and urban Infill in Southern Ontario cities. Urban Planning, 2(3), 5. doi:10.17645/up.v2i3.1026.
- de Sousa, C., & Ghoshal, S. (2012). Redevelopment of brownfield sites. In Metropolitan Sustainability (pp. 99–117). Elsevier. doi: 10.1533/9780857096463.2.99
- de Vor, F., & de Groot, H. L. F. (2011). The impact of industrial sites on residential property values: A Hedonic pricing analysis from the Netherlands. Regional Studies, 45(5), 609–623. doi: 10.1080/00343401003601925
- FME desktop. (2016). (Version 2015.1.0.1). Safe Software Inc. Retrieved from http://www.safe.com/fme/fme-desktop/
- Hagoort, M., Geertman, S., & Ottens, H. (2008). Spatial externalities, neighbourhood rules and CA land-use modelling. The Annals of Regional Science, 42(1), 39–56. doi: 10.1007/s00168-007-0140-8
- Hansen, H. (2012). Empirically Derived neighbourhood rules for urban land-use modelling. Environment and Planning B: Planning and Design, 39(2), 213–228. doi: 10.1068/b36008t
- Hartmann, B., Török, S., Börcsök, E., & Oláhné Groma, V. (2014). Multi-objective method for energy purpose redevelopment of brownfield sites. Journal of Cleaner Production, 82, 202–212. doi: 10.1016/j.jclepro.2014.07.002
- He, J.-L., & Gebhardt, H. (2014). Space of creative industries: A case study of spatial characteristics of creative Clusters in Shanghai. European Planning Studies, 22(11), 2351–2368. doi: 10.1080/09654313.2013.837430
- Hou, D., Song, Y., Zhang, J., Hou, M., O’Connor, D., & Harclerode, M. (2018). Climate change mitigation potential of contaminated land redevelopment: A city-level assessment method. Journal of Cleaner Production, 171, 1396–1406. doi: 10.1016/j.jclepro.2017.10.071
- Huang, Z., & Du, X. (2016). Strategic interaction in local governments industrial land supply: Evidence from China. Urban Studies, 54(6), 1328–1346. doi: 10.1177/0042098016664691
- Koch, F., Bilke, L., Helbig, C., & Schlink, U. (2018). Compact or cool? The impact of brownfield redevelopment on inner-city micro climate. Sustainable Cities and Society, 38, 31–41. doi: 10.1016/j.scs.2017.11.021
- Koomen, E., Hilferink, M., & Beurden, J. B. (2011). Introducing land Use Scanner. In E. Koomen, & J. B. Beurden (Eds.), Land-use modelling in planning practice (pp. 3–21). Springer. doi: 10.1007/978-94-007-1822-7_1
- Loures, L., & Vaz, E. (2018). Exploring expert perception towards brownfield redevelopment benefits according to their typology. Habitat International, 72, 66–76. doi: 10.1016/j.habitatint.2016.11.003
- Louw, E., & Bontekoning, Y. (2007). Planning of industrial land in the Netherlands: Its rationales and consequences. Tijdschrift Voor Economische En Sociale Geografie, 98(1), 121–129. doi: 10.1111/j.1467-9663.2007.00380.x
- Lu, Y., Cao, M., & Zhang, L. (2015). A vector-based cellular automata model for simulating urban land use change. Chinese Geographical Science, 25(1), 74–84. doi: 10.1007/s11769-014-0719-9
- McCauley, S. M., Rogan, J., Murphy, J. T., Turner, B. L., & Ratick, S. (2015). Modeling the sociospatial constraints on land-use change: The case of periurban sprawl in the greater boston region. Environment and Planning B: Planning and Design, 42(2), 221–241. doi: 10.1068/b38018
- Mesthrige, J. W., Wong, J. K. W., & Yuk, L. N. (2018). Conversion or redevelopment? Effects of revitalization of old industrial buildings on property values. Habitat International, 73, 53–64. doi: 10.1016/j.habitatint.2017.12.005
- Metronamica documentation. (2012). Research Institute for Knowledge Systems bv.
- Ministerie van Infrastructuur en Milieu. (2011). Summary national policy strategy for infrastructure and spatial planning (pp. 1–24). The Hague, the Netherlands: Ministerie van Infrastructuur en Milieu. Retrieved from https://www.government.nl/documents/publications/2013/07/24/summary-national-policy-strategy-for-infrastructure-and-spatial-planning
- Ministerie van Infrastructuur en Milieu. (2016). Environment and planning act (Make it work) (pp. 1–79). Retrieved from /https://www.government.nl/binaries/government/documents/reports/2017/02/28/environment-and-planning-act/EnglishtranslationEnvironmentAct.pdf
- Moreno, N., Wang, F., & Marceau, D. J. (2009). Implementation of a dynamic neighborhood in a land-use vector-based cellular automata model. Computers, Environment and Urban Systems, 33(1), 44–54. doi: 10.1016/j.compenvurbsys.2008.09.008
- National Statistics. (2010). National land use database of previously developed land 2010 (NLUD-PDL). National Statistics. Retrieved from https://www.gov.uk/government/statistics/national-land-use-database-of-previously-developed-land-2010-nlud-pdl
- Nijssen, C. E. G. E., & Kremers, A. (2013). IBIS werklocaties de stand van zaken in planning en uitgifte van werklocaties op 1 januari 2013 en de uitgifte in 2012 (Goverment No. 077161475:0.3) (pp. 1–54). Arnhem, the Netherlands: ARCADIS. Retrieved from http://research.economicboardutrecht.nl/sites/nl.economicboardutrecht.research/files/%282013%29_Arcadis_IBIS%20werklocaties%202012-2013.pdf
- Nygaard, C., & Meen, G. (2013). The distribution of London residential property prices and the role of spatial lock-in. Urban Studies, 50(12), 2535–2552. doi: 10.1177/0042098013477704
- Olden, H. (2007). Remmende factoren bij het herstructureren van bedrijventerreinen (pp. 1–37). Utrecht: STOGO Onderzoek+Advies. Retrieved from https://milieudefensie.nl/publicaties/rapporten/rapport-stogo-remmende-factoren-bij-het-herstructureren-van-bedrijventerreinen
- Ploegmakers, H., & Beckers, P. (2015). Evaluating urban regeneration: An assessment of the effectiveness of physical regeneration initiatives on run-down industrial sites in the Netherlands. Urban Studies, 52(12), 2151–2169. doi: 10.1177/0042098014542134
- Python v2.7.5 documentation. (2013, May 15). Python software foundation. Retrieved from https://www.python.org
- Renes, G., Weterings, A., Gordijn, H., & Langeweg, S. (2009). De toekomst van bedrijventerreinen: Van uitbreiding naar herstructurering. Planbureau voor de Leefomgeving. Retrieved from http://edepot.wur.nl/10327
- The United States Conference of Mayors. (2006). Recycling America’s land a national report on brownfields redevelopment (The United States Conference of Mayors No. Volume VI). Washington, DC. Retrieved from https://www.csu.edu/cerc/documents/RecyclingAmericasLand2006.pdf
- Tobler, W. R. (1970). A computer movie simulating urban growth in the Detroit region. Economic Geography, 46, 234. doi: 10.2307/143141
- van Delden, H., McDonald, G., Shi, Y., Hurkens, J., van Vliet, J., & van den Belt, M. (2011). Integrating socio-economic and land-use models to support urban and regional planning. Proceedings of the 14th AGILE conference, Utrecht, the Netherlands. Retrieved from https://agile-online.org/conference_paper/cds/agile_2011/contents/pdf/shortpapers/sp_159.pdf
- van Delden, H., Stuczynski, T., Ciaian, P., Paracchini, M., Hurkens, J., Lopatka, A., … van Hout, R. (2010). Integrated assessment of agricultural policies with dynamic land use change modelling. Ecological Modelling, 221(18), 2153–2166. doi: 10.1016/j.ecolmodel.2010.03.023
- van der Krabben, E., & Buitelaar, E. (2011). Industrial land and property Markets: Market processes, market Institutions and market Outcomes: The Dutch case. European Planning Studies, 19(12), 2127–2146. doi: 10.1080/09654313.2011.633822
- van der Krabben, E., & Jacobs, H. M. (2013). Public land development as a strategic tool for redevelopment: Reflections on the Dutch experience. Land Use Policy, 30(1), 774–783. doi: 10.1016/j.landusepol.2012.06.002
- van Duijn, M., Rouwendal, J., & Boersema, R. (2016). Redevelopment of industrial heritage: Insights into external effects on house prices. Regional Science and Urban Economics, 57, 91–107. doi: 10.1016/j.regsciurbeco.2016.02.001
- van Schrojenstein Lantman, J., Verburg, P., Bregt, A., & Geertman, S. (2011). Core principles and concepts in land-use modelling: A literature review. In E. Koomen, & J. Borsboom-van Beurden (Eds.), Land-use modelling in planning practice (Vol. 101, pp. 35–57). Dordrecht: Springer Netherlands. doi: 10.1007/978-94-007-1822-7_3
- van Vliet, J., Naus, N., van Lammeren, R., Bregt, A., Hurkens, J., & van Delden, H. (2013). Measuring the neighbourhood effect to calibrate land use models. Computers, Environment and Urban Systems, 41, 55–64. doi: 10.1016/j.compenvurbsys.2013.03.006
- Verburg, P., Schot, P., Dijst, M., & Veldkamp, A. (2004). Land use change modelling: Current practice and research priorities. GeoJournal, 61(4), 309–324. doi: 10.1007/s10708-004-4946-y
- Verburg, P., van Eck, J. R. R., de Nijs, T. C. M., Dijst, M., & Schot, P. (2004). Determinants of land-use change patterns in the Netherlands. Environment and Planning B: Planning and Design, 31(1), 125–150. doi: 10.1068/b307
- VROM-raad. (2006). Werklandschappen: Een regionale strategie voor bedrijventerreinen. Den Haag: VROM-raad.
- Wang, H., Shen, Q., & Tang, B. (2015). GIS-based framework for supporting land use planning in urban renewal: Case study in Hong Kong. Journal of Urban Planning and Development, 141(3), 05014015. doi: 10.1061/(ASCE)UP.1943-5444.0000216
- Wang, T., Han, Q., & de Vries, B. (2017a). A semi-automatic neighborhood rule discovery approach. Applied Geography, 88, 73–83. doi:10.1016/j.apgeog.2017.08.014.
- Wang, T., Han, Q., & de Vries, B. (2017b). Sustainable industrial site redevelopment planning support: A case-based reasoning approach. International Journal of E-Planning Research, 6(2), 39–53. doi: 10.4018/IJEPR.2017040103
- Wcisło, E., Bronder, J., Bubak, A., Rodríguez-Valdés, E., & Gallego, J. L. R. (2016). Human health risk assessment in restoring safe and productive use of abandoned contaminated sites. Environment International, 94, 436–448. doi: 10.1016/j.envint.2016.05.028
- Woo, A., & Lee, S. (2016). Illuminating the impacts of brownfield redevelopments on neighboring housing prices: Case of Cuyahoga County, Ohio in the US. Environment and Planning A: Economy and Space, 48(6), 1107–1132. doi: 10.1177/0308518X16636380
- Xie, J., & Li, F. (2010). Overview of the current situation on brownfield remediation and redevelopment in China. Sustainable development - East Asia and Pacific Region discussion papers. (No. 57953). Washington, DC: World Bank. Retrieved from http://documents.worldbank.org/curated/en/450251468024319815/Overview-of-the-current-situation-on-brownfield-remediation-and-redevelopment-in-China
- Xue, B., Zhang, L., Geng, Y., Mitchell, B., & Ren, W. (2016). Extended land-use coding system and its application in urban brownfield redevelopment: Case study of Tiexi district in Shenyang, China. Journal of Urban Planning and Development, 142(3), 05015014. doi: 10.1061/(ASCE)UP.1943-5444.0000309
- Zhu, Y., Hipel, K. W., Ke, G. Y., & Chen, Y. (2015). Establishment and optimization of an evaluation index system for brownfield redevelopment projects: An empirical study. Environmental Modelling & Software, 74, 173–182. doi: 10.1016/j.envsoft.2015.09.012