
 ?Mathematical formulae have been encoded as MathML and are displayed in this HTML version using MathJax in order to improve their display. Uncheck the box to turn MathJax off. This feature requires Javascript. Click on a formula to zoom.
ABSTRACT
Small and medium-sized cities represent the backbone of the European territory, promoting cohesion and an economic base for development. The study compares the spatial and temporal trajectories of land use in three small/medium-sized cities located in central Portugal, between 1958 and 2011. The cities of Viseu, Leiria and Castelo Branco were chosen because they are located in different urban sub-systems and because of the different factors that frame their alterations in land use, occupation and consequent urban development. The research evaluates the transformations, supported by indicators to explain the spatial dynamics of losses and gains and a principal component analysis compares the land-use trajectories for the three cities. The general results reveal an increase from the central part of the study areas to the periphery, contrasting with a continuous decrease of the agricultural parts, illustrating peri-urbanization and rururbanization processes. The study allows identification of the dynamics in the three analysed areas, highlighting the different rhythms of change and relating them to the particularities that exist in each city. The methodology represents an advantage for the analysis and evaluation of territorial dynamics related to land-use change, and made possible the identification of the different forces.
1. Introduction
Small and medium-sized towns (SMESTOs) have been considered in the European Territorial Strategy and the Territorial Agenda of the European Union (EC, Citation1999; EU, Citation2007) to be the backbone of a territory, and a deterrent to dispersion (Catalan, Saurí, & Serra, Citation2008). The EU Sustainable Development Strategy (2006), the EU Rural Development Policy (2007–2013), the Community Strategic Guidelines for Rural Development (2007–2013) and the European Research Area Green Paper (2007) also present the importance of these morphological, functional and administrative entities for regional structure and European development. Despite the diversity and difficulty in defining SMESTO at European level, due to the enormous diversity of European urban areas, it is understood as representative of SMESTOs with a population density between 300 and 1500 inhabitants km−2 and/or between 5000 and 50,000 inhabitants (Servillo et al., Citation2013).
In the EU report on the Territorial Agenda 2020, linking the territorial dimension to cohesion policy (EU, Citation2007), small and medium-sized cities are presented as territorial vectors for the promotion of polycentric and balanced territorial development, supporting local synergies and territorial assets, integrating development in cities, rural and specific regions, as well as connecting ecological, landscape and cultural values of their regions for sustainable development (Piorr, Citation2011; Ravetz, Fertner, & Nielsen, Citation2013).
They structure the polycentric urban system that supports the dissemination of functions and stimulates economic growth while generating and empowering sustainable urban models (Camagni, Capello, & Caragliu, Citation2015; Dijkstra, Garcilazo, & McCann, Citation2013). This role encompasses a recent slowdown in the growth rate of smaller cities (Turok & Mykhnenko, Citation2007), reflecting the appearance of alternative scenarios of urban development process (Rounsevell et al., Citation2006) or expressing an urban dispersion with a loss of structure (Kasanko et al., Citation2006).
The characterization and explanation of land-use change trajectories in small and medium-sized cities act as managing scenarios for development strategies for cities and regional assets, as an ex ante condition for cohesion (Bandeira, Coelho, Sá, Tavares, & Borrego, Citation2011; Hersperger & Bürgi, Citation2009; Patacchini & Zenou, Citation2009; Pinhal, Citation2016; Romano & Zullo, Citation2013; Rounsevell et al., Citation2006). Deep changes in land use are common in these cities producing unbalanced occupation rates with complex interactions between environmental and socio-economic factors on land-use change (ET2050, ESPON, Citation2014; Fahmi, Hudalah, Rahayu, & Woltjer, Citation2014; Oueslati, Alvanides, & Garrod, Citation2015; Salvati & Sabbi, Citation2011; Verburg, Schot, Dijst, & Veldkamp, Citation2004). The identification of social distribution, organizational complexity and rethinking of local urban settlements sustainability (Bragagnolo & Geneletti, Citation2014; Monteiro & Tavares, Citation2015; Turcu, Citation2014), are becoming more crucial for small and medium-sized cities. The use of satellite imagery and aerial photographs, integrating groups of images from several observation periods, have been used for interpreting processes of land-use change in small and medium-sized cities (Henríquez, Azócar, & Romero, Citation2006; Liu et al., Citation2015; Verburg, van Berkel, van Doorn, van Eupen, & van den Heiligenberg, Citation2010) supporting the definition of urban expansion scenarios, the vulnerability of ecosystems, and the maintenance of distinctive morphological and socio-cultural features (Wu & Zhang, Citation2012; Yüzer & Yüzer, Citation2014).
The knowledge of long-term dynamics of urban areas, the transitions of agriculture and forest areas, bodies of water and the associated use of natural areas is fundamental to measure the past and future effects and understand the present landscape structure (Debolini, Schoorl, Temme, Galli, & Bonari, Citation2015; Dempsey et al., Citation2017; Meneses, Reis, Pereira, Vale, & Reis, Citation2017; Moreira, Fontes, Dias, e Silva, & Loupa-Ramos, Citation2016). Different studies present the use of indicators for monitoring the changes between classes of land use translating urban expansion and temporal dynamics (Long, Gub, & Han, Citation2012; Mantas, Marques, & Pereira, Citation2016; Tian, Ge, & Li, Citation2017).
In Portugal, the SMESTOs and their territorial dynamics are considered the basis of the Portuguese urban system and are called anchor cities (Araya & Cabral, Citation2010; Balsas, Citation2000; Monteiro & Tavares, Citation2015). Small and middle-sized cities are regarded as centres fostering the development of the surrounding territories (DGOTDU, Citation2002). Some of them are focused on small or medium-sized cities where land-use dynamics are presented as drivers to create new functions and offer a basis for planning and decision-making (Abrantes, Fontes, Gomes, & Rocha, Citation2016; Bandeira et al., Citation2011; Moreira et al., Citation2016; Pato, Castro, & Tavares, Citation2016; Teixeira, Teixeira, & Marques, Citation2014).
For the present study, the cities of Viseu, Leiria and Castelo Branco were chosen, which are located in the central region of mainland Portugal and which, due to their characteristics, are evident as regional poles. The choice of these areas is justified because they are medium-sized cities that mirror, to a large extent, the dichotomy between the territories of the coast (Leiria) and those of the inland (Viseu and Castelo Branco) present in the central region. On the other hand, this illustrates the population concentration in the main regional centres, with losses in the most remote areas. The choice is also justified by the fact that each of the study areas are located in distinct urban sub-systems belonging to the Centro region (CCDR-C, Citation2011), each of them exhibit different polarization factors.
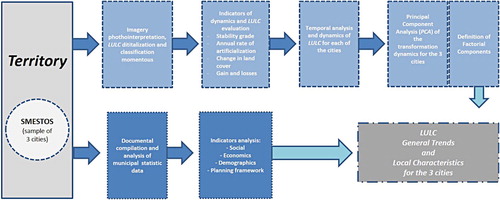
The main objective of this work is to evaluate and compare the spatial and temporal trajectories of land use over time in three small/medium-sized cities in the central of Portugal (), using the group of images created over about five decades (1958–2011). The research questions we want to answer are: What are the temporal and dynamic changes in land use and occupation? How do the selected indicators explain the temporal and spatial dynamics of losses and gains between classes? What are the general trends and the local characteristics that express the land-use changes for the three compared cities?
Figure 1. Graphical abstract of the present study.
2. Description of the study area
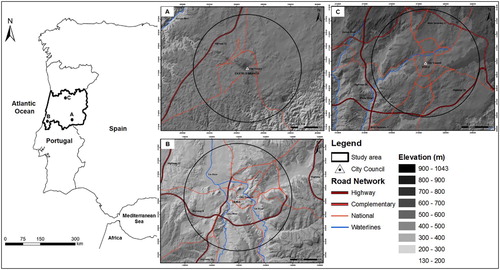
The study areas are located in the Central Region of Portugal and part of three different city areas: Castelo Branco, Leiria and Viseu (). The county of Castelo Branco is a district (administrative division of a regional scope that encompasses a set of municipalities), capital and centre of the NUTS III (Beira Baixa) and assumed a role of polarization in context of the region of which it is part. The county of Leiria is a distrito capital and centre of the NUT III (Região de Leiria) its location being a major element that contributes to the area’s growth and development. The county of Viseu is also a district capital and part of the NUT III (Viseu Dão-Lafões), and presents one of the highest population consolidations of inland Portugal.
Figure 2. Location of the three study areas: (a) Castelo Branco; (b) Leiria; (c) Viseu.
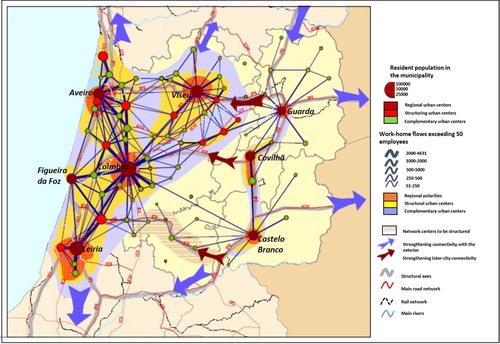
Although the study areas are an integral part of three medium-sized cities, their choice results from particularities intrinsic to each one and results in different dynamics and trajectories in terms of land use and occupation between 1958 and 2011. The city of Viseu is located in the Dão-Lafões sub-urban system that is characterized, in general terms, by the dispersion of its population clusters (CCDR-C, Citation2011). However, the city of Viseu appears in this sub-urban context as the main polarizing centre, adding around it a group of small cities, with which it maintains a relationship based on home–work–home mobilities and the use of commerce and services (). Viseu stands out for its diversified functional capacity, with strong commercial, industrial dynamism and its privileged location, driven by the A25 highway, which places the city in a prominent position with regard to the cross-border axis (link between the coastal and Spanish border). As far as Leiria is concerned, the city is part of the urban sub-system called Leiria – Marinha Grande/Pinhal Litoral (CCDR-C, Citation2011). This urban sub-system is structured according to Leiria, which stands out in the regional context because it is a centre of employment, administrative functions, commerce and services. It also highlights its importance at the industrial level, fundamentally linked to the glass industry and plastic molds. The development and expansion of the city of Leiria is explained by its privileged position in the regional and national context and by its location in a zone of high road network density, which encouraged the urban expansion of the city along this complex road system, allowing the creation of new polarities () (CCDR-C, Citation2011). Regarding Castelo Branco, the city is located in the innermost area of the central region, in the urban sub-system called Beira Interior where a standard of urban structure based on dispersion stands out. Castelo Branco is distinguished itself from the previous areas by dispersion in terms of population clusters surrounded by territories of low density. The area displays a general abandonment of traditional agriculture, and a demographic retreat and consequently by its aging population. Castelo Branco is the main sub-regional driver, standing out for its administrative functions, its industrial sector and activities related to the agro-food sector (CCDR-C, Citation2011). The development in the last decades of the road network, with emphasis on the A23 highway, has strengthened its dynamics with other cities, linking it to the Lisbon Metropolitan Area and the border regions.
Figure 3. Framing of study areas in the urban system of the central region. Source: Plano Regional do Ordenamento do Território do Centro PROT-C (CCDR-C, Citation2011).
In terms of geology and morphology, the three study areas possess different characteristics. The region of Castelo Branco consists largely of dissected schist outcrops and well-preserved granites, with a great sharpness in relief forms (Cupeto et al., Citation2005; Ribeiro, Teixeira, & Ferreira, Citation1967) with altitude values ranging from approximately 200 to 480 m. In the study area of Leiria, the sedimentary formations correspond to alluvial and bottom valley deposits, deposits of river terraces, sand and Pliocene sandstones, clays/silts and the Jurassic marl. The formations of magmatic origin correspond to domes and rock seams of predominantly magmatic dolerites (Teixeira, Zbyszewski, Torre de Assunção, & Manuppella, Citation1968; Veiga, Citation2011) with altitude values ranging from approximately 7 to 440 m. The geology of Viseu consists of essentially hercinic granite rocks, with small expressions of metasedimentary rocks and sedimentary and alluvial deposits preserved in tectonic depressions (Ferreira et al., Citation2010) with altitudes ranging from approximately 300 to 600 m.
In relation to the climate, the three study areas have a Mediterranean climate with a rainy winter and a dry, warm summer. However, Castelo Branco presents the highest annual temperature variations.
Regarding hydrology, the three study areas also have different characteristics. In relation to Leiria, the Lis River and its tributary Lena cross the city. In terms of regime, the rivers present a torrential character, registering a great variability in quantitative annual flows. As for Viseu, the Pavia River that presents high flow variability throughout the year crosses the study area. Both of those last cities have records of historical flooding processes with episodic human losses with long-lasting damages to their commercial and residential areas, especially to roads affecting social functions. For the two cities, flood mitigation structures were developed, channelizing the water streams, and either implemented spatial plans with restrictions on land occupation for the last 25 years. The Castelo Branco study area does not have similar hydrographic constraints.
In biogeographical terms, and in accordance with Costa, Aguiar, Capelo, Lousã, and Neto (Citation1998), the study areas of Castelo Branco and Leiria are located in the Mediterranean Region and the Viseu municipality presents characteristics of the Eurosiberian Region, namely the Galician-Portuguese Sector.
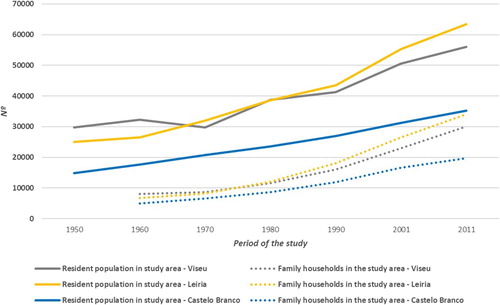
Regarding human occupation and according to the 2011 Census, the municipality of Castelo Branco has 56,109 inhabitants, Leiria has 126,897 inhabitants and Viseu has 99,274 inhabitants. In terms of population density, the municipality of Leiria stands out with 224.5 inhabitants km−2 (49% growth between 1958 and 2011), followed by Viseu with 195.6 inhabitants km−2 (growth of 24%) and Castelo Branco with 38.9 inhabitants km−2 (which shows a decrease of 20%). In relation to family households, it is worth mentioning that there was a growth in the three municipalities, with Leiria increasing by 236%, followed by Viseu with 153% and Castelo Branco with 95%.
The evolution of the resident population in the municipal areas for the period 1950–2011 are presented in the , where can be observe a slight, continuous decrease in the Castelo Branco municipality, but visibly increasing for the other cities from 1970. The number of family households presents continuous growth during the period 1950–2011 in the three cities. According to (INE, Citation2012) the study area belonging to the three cities contain the following numbers of inhabitants: Castelo Branco (35, 242), Leiria (63,399), Viseu (56,071). These indicators fit the characteristics of a medium-sized city in the national context (Costa, Citation2002), and a small-sized city according to the EC definition (Dijkstra & Poelman, Citation2012).
Figure 4. Comparison between resident population and family households in the three study areas.
To assess the land-use dynamics, and the progressive urban expansion, an equal study area was selected for each of the municipalities, presented in . It is centred on the City Council of each city and has a circular shape with a 4 km radius, and an area of 50.26 km2. The choice of the definition of the area of study is supported by previous studies (Barros, Tavares, Monteiro, & Santos, Citation2018; Monteiro & Tavares, Citation2015) and is justified by the fact that its centre is the oldest and most consolidated part of the cities analysed. On the other hand, the 4 km of radius allows covering areas that in 1958 (beginning of the analysis period) had very similar characteristics between the three cities, namely the importance of agriculture and forest areas in the areas farthest from the urban centre. Another characteristic is the fact that the three study areas are structured by internal circulars and framed between national roads that structure the territory. This fact allows a comparison of the temporal evolution of land use and occupation between the different areas considered. In the three study areas, those circles include the urban core and the peri-urban areas with a structured road network.
3. Materials and methods
3.1. Land cover data
The land-use change analysis was supported by a group of four photographic mosaics from different periods, between 1958 and 2011 (), from different sources. The images were processed and analysed, using the ArcGIS 10.2 software (ESRI®), following the procedures presented by Tavares, Pato, and Magalhães (Citation2012). To adjust the distinctive imagery scale some procedures were carried out as a single operator, a defined minimum unit of area and a reverse analysis was used. A supervised analysis was carried out in order to integrate images from different sources.
Table 1. General characteristics of data source.
A classification system was established based on the categories from the European Environment Agency (CLC, Citation1990) and organized according to numerical codes (Bossard, Feranec, & Otahel, Citation2000). With the intention of making them appropriate for use in the three study areas, and through work field validation, certain subclasses were defined and presented in , representing generalized patterns.
Table 2. Classes applied in the classification system and land-use classes used in the PCA.
A geographic information system project was developed incorporating the classification of polygons of land use from each group of images, applying the table of contents according to the previously defined classes (Skokanová et al., Citation2012; Tavares et al., Citation2012). This process was performed using a minimum unit of analysis of 1 ha. Each set of images produced a matrix of polygons encoded by six major classes: artificial areas, agricultural areas, forest areas, shrub vegetation areas, sparsely vegetated areas and inland waters.
3.2. Indicators evaluation of spatial and temporal changes in land use
Some previous studies (Long, Tang, Li, & Heilig, Citation2007; Tavares, Monteiro, Vargas, Pato, & Serra, Citation2014) identified four different indicators to appraisal the dynamics of land use, as presented in .
Table 3. Equations used to evaluate the dynamics in land use and occupation.
To define the transformation of land use and the calculation of the stability grade (SG) in each time period a comparison map method was done involving the group of successive images. Through the maps matrices were built for the periods 1958–1985, 1985–1995, 1995–2011, and 1958–2011. In order to obtain the land-use dynamics between two periods Equation (1) was used. To evaluate the conversion areas relative to gains and losses for a given year, relative to the year under comparison, Equation (2) was used. The transition percentage was obtained in comparison to the total land-use type.
The total area that has not undergone a possible transition to a different category of land use is called stability grade (SG) and represented in Equation (3). The indicator for annual rate of artificialization (AS) Equation (4) expresses the increase in urbanization, specifically related with peri-urban and rurbanization processes around the urban core of the three cities studied. In the present article, peri-urbanization is understood as consisting of the physical expansion of cities, but also of the dissemination of social, economic and cultural patterns inherent to the urban phenomenon (Duràn, Citation2006). The rurbanization process is understood as a process of exodus of people from the city to the rural environment, being, in most cases, related to the search for new and better conditions of life originated by the degradation of the quality of the urban spaces. This process is characterized by the emergence of large and discontinuous spaces in functional and spatial terms (Augé, Citation1994).
Decisive for interpretation of the land use and occupation trajectories is the planning framework. Plans were considered with municipal, city, local and special plans with the incidence in the three study areas (). It should also be noted that both Municipal Master Plans and the Legal Protection Regimes for non-urban areas (RAN and REN) were implemented at almost the same time (mid-1990s). Also highlighted is the implementation of the Polis Program in the year 2000 in the three cities, which allowed them to carry out works of urban requalification and creation of green spaces, namely in areas susceptible to flooding.
Table 4. Planning framework of the three cities.
As pointed out by Monteiro and Tavares (Citation2015), Pato et al. (Citation2016) and Padeiro (Citation2016) the planning framework typology and scale enforcement influence the land use and occupation changes particularly in the artificialization processes.
3.3. Principal component analysis for land-use change
In order to strengthen the analysis pursuant to understanding the land-use change, a principal component analysis (PCA) was performed for the following periods: 1958/1985; 1985/1995; 1995/2011, for a total of 27 classes of land use (). This type of analysis has been applied by a wide range of authors, in the most diverse settings (Barros, Tavares, & Santos, Citation2015; Schmidtlein, Deutsch, Piegorsch, & Cutter, Citation2008; Tavares, Barros, & Santos, Citation2016; Zhang, Wu, & Shen, Citation2011). The analysis was carried out for the three cities.
With the aim of analysing the dynamics of transformation, all possible combinations between the different classes of land use (e.g. CUF–DUF; CUF–ICU), were considered as well as the absence of change of land-use class over the periods under analysis (e.g. CUF–CUF; DUF–DUF). The set of possible dynamics between the different classes of land use considered allowed us to obtain a total of 729 dynamics of transformation of land use. However not all were considered for the analysis since the dynamics that did not have any transformation value were eliminated (minimum of 1 ha.) over the periods under analysis. This enables a reduction of the dynamics to a value of 478 transformations.
The PCA was performed following a set of assumptions, namely: the calculation and analysis of the Pearson correlation matrix; the implementation of Varimax rotation factor analysis; analysis of the variance rate parameters (should be greater than 60%) and the use of the (KMO) Kaiser–Meyer–Olkin sample measurement (should be greater than 0.6) with the elimination of redundant data (Comrey & Lee, Citation2009). The use of PCA allows the extraction of the main components (FAC) that result from the analysis, allowing one to group the different areas of study around the different components based on the respective loadings.
As mentioned previously, the PCA’s were carried out for the three study areas belonging to the cities. In the analysis, the following results were achieved: KMO of 0.771, with commonalities higher than 0.95 and a variance rate of 96%. From this analysis, a total of 4 main components resulted. Finally, for the selection of the variables that contribute to each FAC, only variables with loadings greater than 0.5 were considered, in order to strengthen the analysis.
4. Results
4.1. Temporal and dynamic analysis of changes in land use
Through the described methodology, a systematic analysis and classification of land use was produced for the four moments (1958, 1985, 1995, and 2011) in the three cities, as shown in . A total of 27 classes were identified in the entire area of study, some of them having casuistic representation (mineral extraction areas, dump site, construction sites, burnt areas, and water bodies).
Figure 5. Land use and occupation in the three cities, based on image classifications by year: (a–d) Castelo Branco; (e–h) Leiria; (i–l) Viseu.
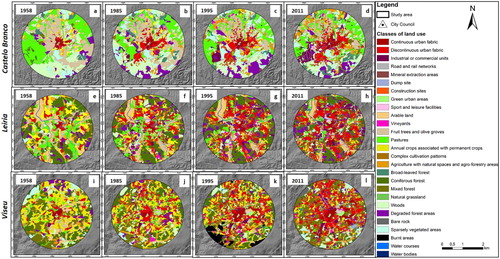
The cartographic outputs of the three cities presented in show differentiated changes in the different sectors of the area with a variety of trajectories. Generally, the analysis indicates some systematic transitions involving an increase in urban areas, namely in discontinuous urban fabric and industrial or commercial units and a decrease in agricultural areas with differences in the three study areas. In Castelo Branco stand out the losses related to fruit trees and olive groves and pastures. The same dynamics of loss is verified in Leiria, where losses are also highlighted in annual crops associated with permanent crops. Finally in Viseu the majority of losses are related to annual crops associated with permanent crops and arable land. It should also be noted that all the areas analysed show gains relative to the complex cultivation patterns class. We also identify transformations in forest areas, where the increase in mixed forest and degraded forest areas stand out, along with a decrease in coniferous forest, with the exception of Castelo Branco that presents gains in this class (). The analysis of also allows verifying a growth of fragmentation of the study area, which is translated by the continuous increase in the number of polygons between 1958 and 2011 for each city (). This process of fragmentation is related to fast urban growth that is shown by the increase of 135% in the number of polygons between 1958 and 2011 () in Viseu, 118% in Castelo Branco and 109% in Leiria.
Table 5. Number of patches and areas for each class of land use in the three study areas, according to the Corine Land Cover classification.
However, through comparison of each city, it is possible to verify that Castelo Branco presents a smaller number of polygons when compared with Leiria and Viseu. This fact demonstrates a greater fragmentation of the landscape in the cities of Leiria and Viseu, expressing a rapid urban expansion in both contrasting with Castelo Branco, which shows a lower diversity on the landscape during the period 1958–2011. The fragmentation verified in Viseu and Leiria is fundamentally related with the increase of residential areas, the industrial growth and afterwards, tertiary growth.
Looking to the outputs of , it is possible to perceive the growth of pattern number that reveals a general increase of the artificial areas from the central part of the study area to the periphery, contrasting with a continuous decrease of the agricultural parts. These facts illustrate the peri-urbanization and rururbanization processes.
The conversion matrices created for 1958–1985, 1985–1995, 1995–2011, and 1958–2011 allowed for a detailed study of the dynamics of land use in four periods of analysis and to calculate the stability grade (SG). The values of the SG for each period in the three cities are presented in . This table contains this indicator for the calculated matrices with all the 27 land-use classes and the matrices with the 6 aggregated classes of land use. The contrasting values of the SG indicator in the 2 types of matrices are due to the fact that the level of detail is greater in the matrices with 27 classes, as opposed to the matrices with only 6 major classes. All the matrices present in this study are built based on the 6 aggregated classes. Looking to , it is possible to verify that Castelo Branco is the city that presents a higher SG in the four periods of analysis. Moving in the opposite direction are the results for Leiria () and then Viseu (). Analysing period by period based in the land-use aggregated classes, from 1958–1985 to 1985–1995, we observe an increase of the SG in the three cities which represent a general trend. From 1985–1995 to 1995–2011 there was an increase in the SG in the city of Castelo Branco namely associated with the maintenance of the agricultural, forest and pasture areas related with the approval of Special Regulatory Protection Regimes (RAN and REN). In Viseu and Leiria we assist to a decrease in the SG demonstrating some local characteristics, namely related with a urban sprawl, with emphasis on the increase in areas related to the construction of residential neighbourhoods, creation and development of new commercial and industrial zones, and the increasing density of the road network. The land use aggregated areas for the three cities demonstrated a continuous land-use change process where less than one-third of the areas remain with the same classification.
Table 6. Comparison between the stability grade using land-use classes and land-use aggregated classes.
Table 7. The conversion matrix for changes in land use and occupation from 1958 to 2010 in Castelo Branco.
Table 8. The conversion matrix for changes in land use and occupation from 1958 to 2010 in Leiria.
Table 9. The conversion matrix for changes in land use and occupation from 1958 to 2010 in Viseu.
In order to analyse the individual behaviour of each of the 27 identified classes, was created, which presents the individual evolution of each class in each study area. On the other hand an internal transition matrix was created, for the period 1958–2011 for each city (), with the objective of identifying the gains and losses more clearly for the six major classes of land use In general, the results show gains in artificial areas in the three study areas, as well as the loss of agricultural areas. In all three cases this is a general trend, showing that the large gains in artificial areas come mainly from agricultural areas ().
Table 10. Evolution of the land-use classes over the time.
Table 11. Transformations in land use and occupation in the three cities (%).
Looking in a more detailed way, it is possible to verify that the cities of Leiria and Viseu present a similar dynamic of transitions evidenced by the gains in artificial areas and losses in agricultural, and forest zones. The interventions in the rivers margins with flooded areas also mark the dynamics of transformation for these cities. On the other hand, the city of Castelo Branco shows a different trajectory, with gains in artificial areas, but also in forest areas, and with losses in agricultural areas and sparsely vegetated areas. The gains in forest areas come mainly from areas of shrub vegetation (). This fact is related with biophysical characteristics of the soil, the abandoned of agricultural areas and cattle grazing activity.
In the analysis of the evolution of each of the classes () allows one to find local characteristics between the analysed areas. Regarding the classes belonging to the artificial areas, the discontinuous urban fabric class stands out as the most representative class in the three areas analysed. However, in relation to agricultural areas, it can be seen that, despite its overall decreasing tendency, allows one to differentiate Castelo Branco by the increase in arable land and agriculture crops with natural spaces and agro-forestry areas and Viseu and Leiria by the increase in vineyards. Also noteworthy was the transverse increase in relation to the areas affected by complex cultivation patterns. As regards the forest areas, the most significant loss occurred in Leiria and Viseu, as far as the coniferous forest is concerned, in contrast to its increase in Castelo Branco. In terms of shrub vegetation areas, the increase observed in Castelo Branco and Leiria, mainly driven by gains in degraded forest areas, contrasts with the global decline observed in Viseu, influenced by significant losses in the same areas (). In the sparsely vegetated areas, the trend is the same as previously mentioned, losses in Castelo Branco and Leiria and increase in Viseu mainly driven by bare rock areas. In terms of inland waters, there is an increase in Castelo Branco related to the application of urban requalification plans, which contrasts with the losses in Viseu and Leira, related to the application of protection and mitigation measures for the flood risk in the Lis River and its tributary the Lena (Leiria) and in the Pavia river (Viseu).
4.2. Land-use change
In order to analyse the different dynamics of land-use transformation, a PCA was performed for the entire study area. For the PCA at the city level, the matrix of components (), allowed identification of a set of four main components (FAC) with a rate of variance of 96.2% (). The remaining main components were not considered as contributing residual values for the total variance and include explanatory variables that are also present in the most representative FACs.
Table 12. Rotative component matrix (city level).
Table 13. City level components.
4.2.1. Castelo Branco city land-use change (FAC 1)
FAC 1 represents 54.5% of the total variance and is related to land-use change in the city of Castelo Branco. The variables that contribute to this FAC are the three time periods considered for the analysis: 1958/1985; 1985/1995; 1995/2011 (). This fact demonstrates that the study area of the city of Castelo Branco presents a continuous process of land-use change throughout the three periods under analysis. This continuous process is represented by the increase of urban fabric, the decrease of pastures and arable lands, coexisting with the new areas of woods, and sparsely vegetated areas. It should be noted, however, that this continuous urban growth of the analysed area (4 km radius) is accompanied by a continuous increase of the population from 1958 to 2011 (+137%), a fact that is different from what happened with the totality of the municipalities that have had constant losses since 1958 (INE, Citation2012).
4.2.2. Leiria city land-use change (FAC 2)
Regarding FAC 2, it represents 27.3% of the variance, being constituted by the three time periods under analysis for the study area belonging to the city of Leiria (). This fact demonstrates the same behaviour identified in FAC 1, that is, a continuous process of land-use change in Leiria for the different periods under analysis. The process of land change is generally supported by the growth of the urban discontinuous fabric and the reduction of pastures and arable lands.
4.2.3. Viseu city land-use change previous Municipal Master Plan (FAC 3)
The FAC 3 represents 8.3% of the variance, being constituted by the periods 1958/1985 and 1985/1995 () for the study area belonging to the city of Viseu. This fact makes it possible to distinguish Viseu’s land-use change processes from other areas under study. In this way, the FAC 3 emphasizes a differentiation of the processes of land-use change until the approval of the first Municipal Master Plan (1995) and the following period, with a clear change of the land-use paradigm. Previous to the Master Plan, a dynamic was observed with increasing discontinuous urban areas and complex cultivation patterns.
4.2.4. Leiria and Viseu land-use change post Municipal Master Plans and Ecological Regime Protection (FAC 4)
This FAC represents 6.1% of the variance and presents as variables the period of 1995/2011 for the study area of Viseu and Leiria (). In this way, FAC 4 illustrates the importance of applying Master Plans (1995) and Ecological Regime Protection (1996) throughout the study area, which corresponds in both cities to an increment of urban fabric, the reduction in the arable lands and annual crops/permanent crops, and some maintenance of forest areas.
5. Discussion
Through the present study, it is possible to observe that the sum of the artificial areas have generally been increasing for the three cities for the different periods of analysis. This increasing is essentially related with the conversion of forest and agricultural areas into artificial areas. These results are in consonance with other studies reported by Kasanko et al. (Citation2006), Jones, de Graaff, Rodrigo, and Duarte (Citation2011), Bodesmo, Pacicco, Romano, and Ranfa (Citation2012), Araya and Cabral (Citation2010), Russo, Tomaselli, and Pappalardo (Citation2014), Aguilera-Benavente, Botequilha-Leitão, and Díaz-Varela (Citation2014) and Abrantes et al. (Citation2016). This transformation process is influenced by a multiplicity of driven forcers. First of all, the demographic factor is emphasized, being that the study areas are characterized by a centripetal dynamics in relation to their peripheral areas, becoming centres of concentration of population. The gradual loss of profitability linked to the primary sector and the consequent abandonment of rural areas led to a process of pressure on urban areas. In economic and social terms, the tertiarization of the historic centre, the densification of the road network and the banalization of the car and the economic growth of the country (Padeiro, Citation2016), highlighting in particular the entry of Portugal to the European Economic Community in 1986, led to the emergence of new centralities in peripheral areas. During the analysis period, we assist the emergence of residential and leisure areas in the peripheral areas, as well as the relocation of activities related to the secondary and tertiary sectors in these same areas giving rise to peri-urbanization and rurbanization processes (Marques, Citation2003; Pinhal, Citation2016).
However, some local characteristics express the dynamics of land-use change. The lower, but continuous process, occurs in the city of Castelo Branco. For this city, a general duplication of the discontinuous urban areas was observed between the periods. An increasing stabilization process during the 1985–1995 period occurs for the city of Leiria after a sharp change for the period 1958/1985, with the triple amount of the discontinuous urban fabric. The stabilization process for the city of Viseu, namely for the discontinuous urban areas, was observed for the last period (1995–2011).
The agricultural areas demonstrated a global decrease for the three cities, with an impressive local reduction in fruit trees and olive groves for the outer areas of Castelo Branco, and for the annual crops associated with permanent crops for the outer urban areas of Viseu. This fact is a result of a set of factors, namely the exodus that arose in the 60s, the consequent aging of the rural population, the loss of incomes of agricultural activity, caused the progressive abandonment of rural areas. The decline in agricultural areas is also strongly influenced by the entry of Portugal into the EEC and the subordination to European policies, in particular the Common Agricultural Policy (CAP), which, through price regulation and subsidization, led to profound changes. This is exemplified by the 1992 CAP reform which launched a set of measures to encourage the abandonment of agricultural and agro-forestry areas (DGT, Citation2014).
For the forestry and shrubs and vegetation areas, they present some maintenance for the three cities, with great forest representation for Leiria and Viseu, and shrubs and woods for the Castelo Branco city area. The sparsely and vegetated areas are especially relevant for Castelo Branco and Viseu cities, with the casuistic burned areas relevant in Viseu.
The trajectory of land use in Viseu and Castelo Branco reflect the geological substratum, and the biogeographical characteristics, namely the association between forest, shrubs, and natural grassland. In the case of the city of Leiria it is worth mentioning the appearance of associations relating the quaternary deposits with alluviums with the agricultural lands.
The general results also reflect similar changes in Portugal as a whole (Mantas et al., Citation2016; Monteiro & Tavares, Citation2015; Teixeira et al., Citation2014). The data representation shows a general increase in the number of patches recognized for the different study areas, similar to the observations made by Hara, Takeuchi, and Okubo (Citation2005), Sherestha, York, Boone, and Zhang (Citation2011), Pôças, Cunha, Marcal, and Pereira (Citation2011) and Tavares et al. (Citation2012) especially with regard to the number of discontinuous urban fabric and industrial and commercial units as well as agro-forestry areas in the three study cases. They represent the structure of the polycentric urban system, very common for small and medium-sized cities, supporting the dissemination of functions and the performance of the economic growth (Camagni et al., Citation2015; Dijkstra et al., Citation2013).
The analysis of the stabilization grade (SG) for the three areas during the total period under analysis points to a similar level in the cities of Leiria and Viseu (44.05% and 43.06%) and a higher SG in Castelo Branco (51.59%) demonstrating that the dynamics of the changing classes are more relevant in Leiria and Viseu. This reflects more systematic land-use change trajectories for the latter cities and a delay of about 15 years in the transformation processes for the Castelo Branco city area. The city of Leiria presents a continuous increase in the percentage of the stability grade, which may be associated with driver factors such as the importance of agricultural areas in the alluvial watercourse banks and the subsequent application of environmental and agricultural protection regimes. It is also possible to consider the importance of Master Plans as a driving force to foment land-use change processes in Castelo Branco and Viseu in the period 1995–2011, with a break in land-use SG, as referenced in Monteiro and Tavares (Citation2015), Pato et al. (Citation2016) and Barros et al. (Citation2018).
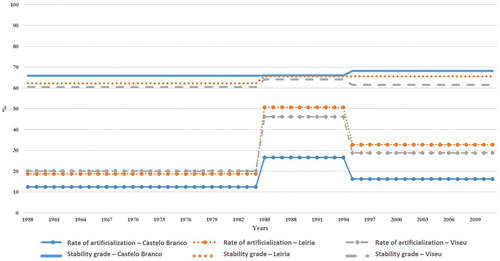
The planning framework acts for those cities as activators of land-use transformation processes. In the first phase, plans with enforcement in the city area emerge in order to respond for urban pressure fundamentally related to the development of new residential areas, expansion of the road network and the search for new areas for commerce and industry. In the early 1990s, the first generation of master plans with a municipal scope appeared to promote planning of the municipal territory. The entry into force of the master plan allied to the approval of the special regimes for plans (REN and RAN) incorporating constraints, results in a new reorganization of the urban limits, seeing a more contained growth compared to previous periods, with the clear objective to limit the diffuse, ordering the expansive growth verified up to that time. The results for the rate of artificialization can still be considered more as clarifiers on the influence of planning on land-use trajectories. If one evaluates the impact of the various plans, it is possible to verify that they existed from the beginning of the 1990s, with the implementation of municipal Master Plans, not partial urbanization plans. With the regulatory environmental and agricultural protection regimes (REN and RAN), artificialization fell sharply in the period 1995–2011 for the three cities (). This means that the land-use change processes in the three cities go beyond artificialization, with changes in agro-forestry spaces, with processes of landscape fragmentation, forest rotation, and the emergence of complex cultivation patterns, as pointed out by Tavares et al. (Citation2014) or Turcu (Citation2014).
Figure 6. Comparison between the stability grade (%) and the rate of artificialization (%) in the three cities: Castelo Branco, Leiria and Viseu.
The dynamics of land-use change based on the economic forces can be observed in the period 1985/2011, where an increase in the industrial and commercial units is observed. The road infrastructure areas representation have two steps, in the period 1985–1995, representing the first level of European Community accession support for the national network, and the period 1995–2011 representing the consolidation process of the national infrastructures and the city rings completion (Pinhal, Citation2016).
The results also show that trajectories of occupation are responding to disturbance processes, and potentially hazardous flooding susceptibility and territorial vulnerability. The inundated areas of Leiria and Viseu cities demonstrated the presence of green areas on the urban margin, infrastructure or embankments for reducing vulnerability in the core of the city and the maintenance of agricultural areas (arable lands or pastures) in outer urban areas, especially visible in the city of Leiria.
The evaluation of the different dynamics of land-use transformation using the PCA for the total study areas of the three cities, underline some general trends supported by local forces or the planning expression.
The results for the city of Castelo Branco show some uniqueness of its geographical context, but essentially the fact is that there a more recent process of artificialization and fragmentation of the landscape. This early continuous process is represented by the increase in urban fabric, the decrease in pastures and arable lands, co-existing with the new areas of woods, and sparsely vegetated areas. The city of Leiria also has its own dynamic of transformation in which the growth of the discontinuous urban fabric is relevant.
A very important expression for interpretation of the transformation processes seems to be what occurred in the period 1995–2011 in the cities with the greatest transformation dynamics – Leiria and Viseu. This stems directly from the specific geographical conditions, presence of a river with flood episodes, which determined interventions in the urban core and forms of ecological and agricultural protection in the alluvial spaces. The period 1995–2011 for these cities can still be interpreted as one in which the processes of municipal planning induced a dynamic of greater complexity in urban and rural relations, as stressed by Bragagnolo and Geneletti (Citation2014), Monteiro and Tavares (Citation2015) and Pinhal (Citation2016).
6. Conclusions
The research cartographic outputs highlight the general decrease of the agricultural areas and the main increase on artificial areas over the period 1958–2011. This kind of continuous process over that time is presented in other contexts (Abrantes et al., Citation2016; Debolini et al., Citation2015; Kasanko et al., Citation2006; Su, Jiang, Zhang, & Zhang, Citation2011), where the agriculture disintensification (van Vliet, de Groot, Rietveld, & Verburg, Citation2015) is discussed as a result of the shift from a rural to an urban society, or represent the capacity to deal with the consequences of land-use dynamics (Verburg et al., Citation2010).
The observed land-use transformation for the three cities underlines some of the topics from the EU Sustainable Development Strategy and European Research Area Green Paper and the EU concerns (Wehrli, Herkendell, & Jol, Citation2010) namely supporting environmental and agriculture areas protection and the establishment of the constraints for hazard susceptibility areas occupation. The increase of recent local spatial plans are related with new trend for urban spatial planning, with detailed scale, and the approval of European funding programmes promoting urban rehabilitation and the establishment of corridors for environmental and mobility. The results for the three study areas demonstrated some general trends for the systematic trajectories for land-use change.
The temporal dynamics of land-use classes for the small and medium-sized cities reveals distinct transformation phases with loss and gain conversions, justifiable by the territorial forcers as pointed out from studies in other geographical contexts (Long et al., Citation2012; Monteiro & Tavares, Citation2015; Serra, Pons, & Saurí, Citation2008). The aspects highlighted in this study are the local synergies and the territorial assets, integrating the development in cities, rural and specific regions, supporting the temporal processes of peri-urbanizaton and rurbanization.
One of the interesting of monitoring the three cities is understand the land substitution process, namely the internal processes within urban boundaries (Shahraki et al., Citation2011), which can represent perceiving the local characteristics, far beyond the passage of the agricultural areas to the urban ones. The intensification or disintensification of land-use changes, namely related with agricultural use, illustrated the effects of planning and policy measures, in their contextual setting and causality drivers, as presented by van Vliet et al. (Citation2015). It should be noted that there are triggering factors (biophysical, demographic, economic) representing the uniqueness of each city, along with general trends based on the planning framework and the infrastructural capacity, dependent on non-local funding.
The methodology used has as main advantage of the comparison in different study areas with respect to their dynamics of land-use change. The introduction of the PCA methodology allowed the identification of different patterns and trajectories in land use between the different areas of study, allowing also a temporal identification of them, in order to highlight the local characteristics of each area and the identification of the different associated forces.
This type of study of medium/small cities and their specific patterns and processes of artificialization are important to understand their evolution from the past until the present, and to improve the spatial planning in the future. As pointed by Nijkamp and Perrels (Citation2014) the evolution of the urban systems is related with socio-economy and co-evolution with environmental and energy interests where the land changes in is the key bone for sustainability.
Disclosure statement
No potential conflict of interest was reported by the authors.
Additional information
Funding
References
- Abrantes, P., Fontes, I., Gomes, E., & Rocha, J. (2016). Compliance of land cover changes with municipal land use planning: Evidence from the Lisbon metropolitan region (1990–2007). Land Use Policy, 51, 120–134. doi: 10.1016/j.landusepol.2015.10.023
- Aguilera-Benavente, F., Botequilha-Leitão, A., & Díaz-Varela, E. (2014). Detecting multi-scale urban growth patterns and processes in the Algarve region (Southern Portugal). Applied Geography, 53, 234–245. doi: 10.1016/j.apgeog.2014.06.019
- Araya, Y., & Cabral, P. (2010). Analysis and modeling of urban land cover change in Setubal and Sesimbra, Portugal. Remote Sensing, 2, 1549–1563. doi: 10.3390/rs2061549
- Augé, M. (1994). Não-Lugares. Introdução a uma Antropologia da Sobremodernidade. (L. Mucznik, Trans.). Lisboa: Betrand Editora.
- Balsas, C. J. L. (2000). City center revitalization in Portugal: Lessons from two medium size cities. Cities (london, England), 17(1), 19–31. doi: 10.1016/S0264-2751(99)00049-9
- Bandeira, J. M., Coelho, M. C., Sá, M. E., Tavares, R., & Borrego, C. (2011). Impact of land use on urban mobility patterns, emissions and air quality in a Portuguese medium-sized city. Science of the Total Environment, 409(6), 1154–1163. doi: 10.1016/j.scitotenv.2010.12.008
- Barros, J. L., Tavares, A. O., & Santos, A. (2015). Fonte, A. Territorial vulnerability assessment supporting risk managing coastal areas due to tsunami impact. Water, 7, 4971–4998. doi: 10.3390/w7094971
- Barros, J., Tavares, A., Monteiro, M., & Santos, P. (2018). Peri-urbanization and rurbanization in Leiria city: The importance of a planning framework. Sustainability, 10(7), 2501. doi: 10.3390/su10072501
- Bodesmo, N., Pacicco, L., Romano, B., & Ranfa, A. (2012). The role of environmental and socio-demographic indicators in the analysis of land use changes in a protected area of the Natura 2000 Network: The case study of Lake Trasimeno, Umbria, Central Italy. Environmental Monitoring and Assessment, 184, 831–843. doi: 10.1007/s10661-011-2004-z
- Bossard, M., Feranec, J., & Otahel, J. (2000). Corine land cover technical guide – Addendum ( Technical report no 40). Copenhagen: EEA.
- Bragagnolo, C., & Geneletti, D. (2014). Dealing with land use decisions in uncertain contexts: A method to support strategic environmental assessment of spatial plans. Journal of Environmental Planning and Management, 57(1), 50–77. doi: 10.1080/09640568.2012.735990
- Camagni, R., Capello, R., & Caragliu, A. (2015). The rise of second-rank cities: What role for agglomeration economies? European Planning Studies, 23(6), 1069–1089. doi: 10.1080/09654313.2014.904999
- Catalan, B., Saurí, D., & Serra, P. (2008). Urban sprawl in the mediterranean? Patterns of growth and change in the Barcelona metropolitan region 1993–2000. Landscape and Urban Planning, 85(3–4), 174–184. doi: 10.1016/j.landurbplan.2007.11.004
- CCDR-C. (2011). Comissão de Coordenação de Desenvolvimento regional do Centro. Coimbra: PROT-Centro, Plano Regional de Ordenamento Territorial do Centro.
- CLC. (1990). Corine land cover (CLC1990) 100m – version 12/2000. European Environment Agency. Retrieved from http://www.eea.europa.eu/data-and-maps/data
- Comrey, A., & Lee, H. (2009). A first course in factor analysis. New York: Physiology Press.
- Costa, E. (2002). Meddium cities – Contribution to their definition. Finisterra, 74, 101–128.
- Costa, J. C., Aguiar, C., Capelo, J., Lousã, M., & Neto, C. (1998). Biogeography of continental Portugal. Quercetea, 0, 5–56.
- Cupeto, C., Alberto, D., Quinta-Nova, L., Jacinto, P., Figueiredo, J., Rodrigues, M., et al. (2005). Castelo Branco local agenda XXI. Diagnosis for sustainability. Castelo Branco: City Council.
- Debolini, M., Schoorl, J. M., Temme, A., Galli, M., & Bonari, E. (2015). Changes in agricultural land use affecting future soil redistribution patterns: A case study in southern Tuscany (Italy). Land Degradation & Development, 26(6), 574–586. doi: 10.1002/ldr.2217
- Dempsey, J. A., Plantinga, A. J., Kline, J. D., Lawler, J. J., Martinuzzi, S., Radeloff, V. C., & Bigelow, D. P. (2017). Effects of local land-use planning on development and disturbance in riparian areas. Land Use Policy, 60, 16–25. doi: 10.1016/j.landusepol.2016.10.011
- DGOTDU. (2002). Sistema urbano nacional: Rede complementar. Lisboa: Ministerio das Cidades, Ordenamento do Territorio e Ambiente.
- DGT. (2014). Uso e Ocupação do solo em Portugal Continental: Avaliação e Cenários Futuros. Projecto LANDYN, eds, Direção Geral do Território, Lisboa.
- Dijkstra, L., Garcilazo, E., & McCann, P. (2013). The economic performance of European cities and regions: Myths and realities. European Planning Studies, 21(3), 334–354. doi: 10.1080/09654313.2012.716245
- Dijkstra, L., & Poelman, H. (2012). Cities in Europe: The new OECD-EC definition. Brussels: European Commission.
- Duràn, F. (2006). Difusión Urbana y Cambio social en los Territorios Rurales: Un estudio de casos en la provincia de Granada. Revista de Estudios Regionales, 3, 179–203.
- EC. (1999). ESDP European spatial development perspective. Towards balanced and sustainable development of the territory of the European Union. Luxembourg: Euroepan Comission.
- ET2050, ESPON. (2014). Territorial scenarios and visions for Europe.
- EU. (2007, May 24–25). Territorial agenda of the European Union. Proceedings of the Agreed on the Informal Ministerial Meeting on Urban Development and Territorial Cohesion, Leipzig, Germany.
- Fahmi, F. Z., Hudalah, D., Rahayu, P., & Woltjer, J. (2014). Extended urbanization in small and medium-sized cities: The case of Cirebon, Indonesia. Habitat International, 42, 1–10. doi: 10.1016/j.habitatint.2013.10.003
- Ferreira, N., Godinho, M. M., Neves, L., Pereira, A., Sequeira, A., Castro, P., & Bento dos Santos, T. (2010). Explanatory notice of 17-A sheet of the geological map of Portugal (1:50,000). Lisbon: National Laboratory for Energy and Geology.
- Hara, Y., Takeuchi, K., & Okubo, S. (2005). Urbanization linked with past agricultural landuse patterns in the urban fringe of a deltaic Asian mega-city: A case studying Bangkok. Landscape and Urban Planning, 73, 16–28. doi: 10.1016/j.landurbplan.2004.07.002
- Henríquez, C., Azócar, G., & Romero, H. (2006). Monitoring and modeling the urban growth of two mid-sized Chilean cities. Habitat International, 30, 945–964. doi: 10.1016/j.habitatint.2005.05.002
- Hersperger, A. M., & Bürgi, M. (2009). Going beyond landscape change description: Quantifying the importance of driving forces of landscape change in a central Europe case study. Land Use Policy, 26, 640–648. doi: 10.1016/j.landusepol.2008.08.015
- INE. (2012). Censos 2011 Resultados Definitivos e Portugal. Lisbon: National Institute of Statistics.
- Jones, N., de Graaff, J., Rodrigo, I., & Duarte, F. (2011). Historical review of land uses changes in Portugal (before and after EU integration in 1986) and their implications for land degradation and conservation, with a focus on Centro and Alentejo region. Applied Geography, 31, 1036–1048. doi: 10.1016/j.apgeog.2011.01.024
- Kasanko, M., Barredo, J. I., Lavalle, C., McCormick, N., Demicheli, L., Sagris, V., & Brezger, A. (2006). Are European cities becoming dispersed? A comparative analysis of 15 European urban areas. Landscape and Urban Planning, 77, 111–130. doi: 10.1016/j.landurbplan.2005.02.003
- Liu, J., Hull, V., Luo, J., Yang, W., Liu, W., Viña, A., … Zhang, H. (2015). Multiple telecouplings and their complex interrelationships. Ecology and Society, 20(3):44. doi:10.5751/ES-07868-200344.
- Long, H., Tang, G., Li, X., & Heilig, G. K. (2007). Socio-economic driving forces of land-use change in Kunshan, the Yangtze river delta economic area of China. Journal of Environmental Management, 83, 351–364. doi: 10.1016/j.jenvman.2006.04.003
- Long, Y., Gub, Y., & Han, H. (2012). Spatiotemporal heterogeneity of urban planning implementation effectiveness: Evidence from five urban master plans of Beijing. Landscape and Urban Planning, 108, 103–111. doi: 10.1016/j.landurbplan.2012.08.005
- Mantas, V. M., Marques, J. C., & Pereira, A. J. (2016). A geospatial approach to monitoring impervious surfaces in watersheds using Landsat data (the Mondego Basin, Portugal as a case study). Ecological Indicators, 71, 449–466. doi: 10.1016/j.ecolind.2016.07.013
- Marques, T. S. (2003). Dinâmicas Territoriais e as relações urbano-rurais. Revista da Faculdade de Letras: Geografia, 19, 507–521.
- Meneses, B. M., Reis, E., Pereira, S., Vale, M. J., & Reis, R. (2017). Understanding driving forces and implications associated with the land use and land cover changes in Portugal. Sustainability, 9(3), 351. doi: 10.3390/su9030351
- Monteiro, M., & Tavares, A. (2015). What is the influence of the planning framework on the land use change trajectories? Photointerpretation analysis in the 1958–2011 period for a medium/small sized city. Sustainability, 7, 11727–11755. doi: 10.3390/su70911727
- Moreira, F., Fontes, I., Dias, S., e Silva, J. B., & Loupa-Ramos, I. (2016). Contrasting static versus dynamic-based typologies of land cover patterns in the Lisbon metropolitan area: Towards a better understanding of peri-urban areas. Applied Geography, 75, 49–59. doi: 10.1016/j.apgeog.2016.08.004
- Nijkamp, P., & Perrels, A. (2014). Sustainable cities in Europe. London: Routledge.
- Oueslati, W., Alvanides, S., & Garrod, G. (2015). Determinants of urban sprawl in European cities. Urban Studies, 52(9), 1594–1614. doi: 10.1177/0042098015577773
- Padeiro, M. (2016). Conformance in land-use planning: The determinants of decision, conversion and transgression. Land Use Policy, 55, 285–299. doi: 10.1016/j.landusepol.2016.04.014
- Patacchini, E., & Zenou, Y. (2009). Urban sprawl in Europe. Brookings-Wharton Papers on Urban Affairs, 2009(1), 125–149.
- Pato, R., Castro, P., & Tavares, A. (2016). The relevance of physical forces on land-use change and planning process. Journal of Environmental Planning and Management, 59(4), 607–627. doi: 10.1080/09640568.2015.1035773
- Pinhal, A. F. P. (2016). Território da Urbanização Extensiva: Processos, Lógicas e Formas de Transformação Urbana em Leiria (PhD thesis). Porto University, Porto.
- Piorr, A. (Ed.). (2011). Peri-urbanisation in Europe: towards European policies to sustain urban-rural futures (Synthesis report; PLUREL [Sixth framework programme]). Forest & Landscape, University of Copenhagen.
- Pôças, I., Cunha, M., Marcal, A. R. S., & Pereira, L. S. (2011). An evaluation of changes in a mountainous rural landscape of Northeast Portugal using remotely sensed data. Landscape and Urban Planning, 101(3), 253–261. doi: 10.1016/j.landurbplan.2011.02.030
- Ravetz, J., Fertner, C., & Nielsen, T. S. (2013). The dynamics of peri-urbanization. In Peri-urban futures: Scenarios and models for land use change in Europe (pp. 13–44). Berlin: Springer.
- Ribeiro, O., Teixeira, C., & Ferreira, C. (1967). Geological map of Portugal at 1/50 000 scale. Explanatory notice of 24-D sheet (Castelo Branco). Lisbon: Geological Services of Portugal.
- Romano, B., & Zullo, F. (2013). Models of urban land use in Europe: Assessment tools and criticalities. International Journal of Agricultural and Environmental Information Systems, 4(3), 80–97. doi: 10.4018/ijaeis.2013070105
- Rounsevell, M. D. A., Reginster, I., Araújo, M. B., Carter, T. R., Dendoncker, N., Ewert, F., … Tuck, G. (2006). A coherent set of future land use change scenarios for Europe. Agriculture, Ecosystems & Environment, 114, 57–68. doi: 10.1016/j.agee.2005.11.027
- Russo, P., Tomaselli, G., & Pappalardo, G. (2014). Marginal periurban agricultural areas: A support method for landscape planning. Land Use Policy, 41, 97–109. doi: 10.1016/j.landusepol.2014.04.017
- Salvati, L., & Sabbi, A. (2011). Exploring long-term land cover changes in an urban region of Southern Europe. International Journal of Sustainable Development & World Ecology, 18(4), 273–282. doi: 10.1080/13504509.2011.560453
- Schmidtlein, M., Deutsch, R., Piegorsch, W., & Cutter, S. (2008). A sensitivity analysis of the social vulnerability index. Risk Analysis, 28, 1099–1114. doi: 10.1111/j.1539-6924.2008.01072.x
- Serra, P., Pons, X., & Saurí, D. (2008). Land-cover and land-use change in a mediterranean landscape: A spatial analysis of driving forces integrating biophysical and human factors. Applied Geography, 28(3), 189–209. doi: 10.1016/j.apgeog.2008.02.001
- Servillo, L., Atkinson, R., Smith, I., Russo, A., Sýkora, L., Demazière, C., & Hamdouche, A. I. (2013). TOWN: Small and medium sized towns in their functional territorial context.
- Shahraki, S. Z., Sauri, D., Serra, P., Modugno, S., Seifolddini, F., & Pourahmad, A. (2011). Urban sprawl pattern and land-use change detection in Yazd, Iran. Habitat International, 35(4), 521–528. doi: 10.1016/j.habitatint.2011.02.004
- Sherestha, M., York, A., Boone, C., & Zhang, S. (2011). Land fragmentation due to rapid urbanization in the Phoenix metropolitan area: Analyzing the spatiotemporal patterns and drivers. Applied Geography, 31, 522–531. doi: 10.1016/j.apgeog.2011.04.004
- Skokanová, H., Havlíček, M., Borovec, R., Demek, J., Eremiášová, R., Chrudina, Z., … Svoboda, J. (2012). Development of land use and main land use change processes in the period 1836–2006: Case study in the Czech Republic. Journal of Maps, 8, 88–96. doi: 10.1080/17445647.2012.668768
- Su, S., Jiang, Z., Zhang, Q., & Zhang, Y. (2011). Transformations of agricultural landscapes under rapid urbanization: A threat to sustainability in Hang-Jia-Hu region, China. Applied Geography, 31, 439–449. doi: 10.1016/j.apgeog.2010.10.008
- Tavares, A., Monteiro, M., Vargas, M., Pato, R., & Serra, R. (2014). Land use change and forest routing in a rural context: The relevance of the community-based management and planning framework. Applied Geography, 52, 153–171. doi: 10.1016/j.apgeog.2014.05.008
- Tavares, A. O., Barros, J. L., & Santos, A. (2016). Multidimensional approach for tsunami vulnerability assessment: Framing the territorial impacts in two municipalities in Portugal. Risk Analysis. doi: 10.1111/risa.12678
- Tavares, A., Pato, R., & Magalhães, M. (2012). Spatial and temporal land use change and occupation over the last half century in a peri-urban area. Applied Geography, 34, 432–444. doi: 10.1016/j.apgeog.2012.01.009
- Teixeira, Z., Teixeira, H., & Marques, J. C. (2014). Systematic processes of land use/land cover change to identify relevant driving forces: Implications on water quality. Science of the Total Environment, 470-471, 1320–1335. doi: 10.1016/j.scitotenv.2013.10.098
- Teixeira, C., Zbyszewski, G., Torre de Assunção, C., & Manuppella, G. (1968). Geological map of Portugal at scale 1/50,000. Explanatory notice of 23-C sheet (Leiria). Lisbon: Geological Services of Portugal.
- Tian, L., Ge, B., & Li, Y. (2017). Impacts of state-led and bottom-up urbanization on land use change in the peri-urban areas of Shanghai: Planned growth or uncontrolled sprawl? Cities (london, England), 60, 476–486. doi: 10.1016/j.cities.2016.01.002
- Turcu, C. (2014). Re-thinking sustainability indicators: Local perspectives of urban sustainability. Journal of Environmental Planning and Management, 56, 695–719. doi: 10.1080/09640568.2012.698984
- Turok, I., & Mykhnenko, V. (2007). The trajectories of European cities, 1960–2005. Cities (london, England), 24(3), 165–182. doi: 10.1016/j.cities.2007.01.007
- van Vliet, J., de Groot, H. L., Rietveld, P., & Verburg, P. H. (2015). Manifestations and underlying drivers of agricultural land use change in Europe. Landscape and Urban Planning, 133, 24–36. doi: 10.1016/j.landurbplan.2014.09.001
- Veiga, A. (2011). Geotechnical characterization of the Terraines of Parceiros-Leiriatyphonic valley (Ph.D. thesis). Coimbra University, Coimbra, Portugal.
- Verburg, P. H., van Berkel, D. B., van Doorn, A. M., van Eupen, M., & van den Heiligenberg, H. A. (2010). Trajectories of land use change in Europe: A model-based exploration of rural futures. Landscape Ecology, 25(2), 217–232. doi: 10.1007/s10980-009-9347-7
- Verburg, P., Schot, P., Dijst, M., & Veldkamp, A. (2004). Land use change modelling: Current practice and research priorities. GeoJournal, 61, 309–324. doi: 10.1007/s10708-004-4946-y
- Wehrli, A., Herkendell, J., & Jol, A. (2010). Mapping the impacts of natural hazards and technological accidents in Europe ( EEA technical report 13/2010, p. 144). Copenhagen: European Environment Agency.
- Wu, K., & Zhang, H. (2012). Land use dynamics, built-up land expansion patterns, and driving forces analysis of the fast-growing Hangzhou metropolitan area, eastern China (1978–2008). Applied Geography, 34, 137–145. doi: 10.1016/j.apgeog.2011.11.006
- Yüzer, M. A., & Yüzer, AŞ. (2014). Changes in land-use preferences of small-, medium-and large-scale industries located in metropolitan areas (case study in Istanbul). European Planning Studies, 22(6), 1127–1142. doi: 10.1080/09654313.2013.764156
- Zhang, X., Wu, Y., & Shen, L. (2011). An evaluation framework for the sustainability of urban land use: A study of capital cities and municipalities in China. Habitat International, 35(1), 141–149. doi: 10.1016/j.habitatint.2010.06.006