
 ?Mathematical formulae have been encoded as MathML and are displayed in this HTML version using MathJax in order to improve their display. Uncheck the box to turn MathJax off. This feature requires Javascript. Click on a formula to zoom.
ABSTRACT
Our study explores research avenues that can help policymakers to assess regional capabilities for ‘green’ economic restructuring. After reviewing the relevant literature, and envisioning research paths which consider both market transactions and externalities, we propose possible ways to translate past research findings into novel statistical tools. Our point of departure is the ‘skill relatedness’ among economic sectors in Norway, as inferred from intersectoral labour flows (years 2008–2014). Then, on the basis of the industrial composition in each of the 161 Norwegian labour market areas, candidate regions that could benefit the most from a ‘green’ restructuring policy, aimed at photovoltaics in our empirical example, are brought forward.
1. Introduction
This paper develops an approach to help assess the potential for regions to move into emerging industries. We use firm-linked labour- and trade-data to address the question of how regions may successfully diversify into technological areas that have evolved rapidly, and whose relatedness to existing activities is not self-evident. We aim to better understand the mechanisms for diversification and to suggest ways for decision-makers to navigate it.
Where would a new sector stand the best chances to grow up and to contribute to a regional economy, given the distribution of skills already present locally? To pull this challenge into perspective, let's consider the sustainable development goals of the United Nations (Citation2015) including the challenge to secure affordable, reliable, sustainable and modern energy for all. Policymakers have to address how and where their economies best can deploy resources efficiently? Here, policymakers face a range of difficulties as they have to to prioritize when addressing such ‘societal challenges’ (see Foray, David, & Hall, Citation2009; Mowery, Nelson, & Martin, Citation2010).
Noting the need for a theoretically grounded and empirically robust way to direct public policy interventions in a ‘smart’ way, we develop an approach to help direct policy attention as it pursues this aim. We focus particularly on the role that labour flows may play as decision-makers try to identify which regions to concentrate on. In order to promote ‘green’ economic restructuring in this sense, the approach builds on insights (e.g. on industrial branching and related variety) and tools (particularly network analysis of the labour flows) from economic geography. Following Boschma and Gianelle (Citation2014), the smart specialization framework is used to consider ways to stimulate new industries to connect to inter-related industries within regions, particularly in cases where growth paths may be hindered by ‘cognitive constraints’. The availability of skilled workforce at the regional level is a crucial consideration.
We utilize regional trade-flow data to illustrate increasing inputs and outputs associated with the emerging sector, while our focus is primarily directed towards how labour-market microdata can be used to investigate the skill-relatedness of the emerging sector and sectors already found in different regions of the country. To illustrate our novel approach, we use the example of Norway and its improbable but relatively successful bid to diversify into photovoltaics. The diversification of a top-ten petroleum exporter into this sector, where natural endowments are lacking, will act as an illustration of the challenges and the potentials that policy makers face as they try to promote diversification in apparently unrelated fields.
The second section surveys the policy-oriented literature centred on smart-specialization and the empirically oriented literature of economic geography. The third section defines the empirical approach of this paper and the fourth section describes the methodology, while the fifth section shows how the method applies to the example of photovoltaics in Norway. The sixth section discusses findings and caveats, and presents paths to further develop the approach especially in light of policy endeavours to bring about a green restructuring.
2. Literature
2.1. Industrial branching and related variety
We start by positioning our work in relationship to two main strands of the innovation literature. The first centres on the regional branching and related variety literature. This more theoretical strand of literature builds on earlier literature on the relationship between technology, trade and economic restructuring (see Fagerberg, Verspagen, & von Tunzelmann, Citation1994). The current quest to better understand what drives successful diversification into emerging sectors and activities and what success would mean here (see Pinheiro, Alshamsi, Hartmann, Boschma, & Hidalgo, Citation2018) is a starting point. Policy has a potentially important role to play in setting the direction of the restructuring processes, going much further than traditional policy of market failure fixing, and smart specialization strategies (Mazzucato, Citation2016). The second strand of literature that we focus on is the more policy-oriented literature of smart-specialization and constructed regional advantage (Asheim, Boschma, & Cooke, Citation2011; Boschma, Citation2014; Foray et al., Citation2009). Boschma and Gianelle (Citation2014) draw the relationship between regional branching and smart specialization policy into focus. The issue of ‘capability constraints’ will be particularly important as we move towards looking into the distribution of related skills at the regional level, in Section 4.
Pinheiro et al. (Citation2018) draw on a rash of recent findings to point to a stable conjecture (a ‘principle of relatedness’) from the related-variety literature. The conjecture is that regions (or countries) tend to develop into activities that are related to pre-existing activities. An important question that emerges from this literature, then, is how regions (countries) might manage to diversify not only into technologies (industries) that are related to those that they already are engaged in but also into those that are not immediately related. In brief,
a key goal for the literature on diversification of territories is to understand the ability of countries or regions to defy the principle of relatedness and enter relatively unrelated and sophisticated economic activities. Yet, we know little about unrelated diversification. (Pinheiro et al., Citation2018, p. 5)
Let's first consider what a region would need to diversify. Two channels are primarily discussed in the literature. The first involves the transfer of goods (trade) where imports of new (primary or intermediate) goods and technologies are recombined in new ways. This recombination between existing labour and capital inputs with the new goods and services is one channel to help lay the basis for diversification.
The second channel involves knowledge spillovers. The economic growth in given industries is recognized to hinge on the ability to promote the production, distribution and use of knowledge within and across regional economies (Antonelli, Patrucco, & Quatraro, Citation2011). However, industrial sectors can easily absorb and implement external knowledge from other sectors when it is close to their own knowledge base: ‘related variety’ in the regional economic composition can thus favour local knowledge spillovers (Boschma & Frenken, Citation2012; Frenken, Van Oort, & Verburg, Citation2007).
Here, we highlight a number of points from the regional branching and related variety literature that inform choices in our study. These are notably:
that the variety of industries within a region may affect knowledge spillovers in terms of useful recombination (Jacobs, Citation1969), given that these are technologically related;
that the potential for regional growth in an industry depends to a significant degree on the number of industries that are technologically related (Frenken et al., Citation2007);
that industrial diversification depends on the accumulation of technological competences at the regional level (Tanner, Citation2014); and
that extra-regional knowledge may be important for targeting regions where there is a requisite level of relatedness between originators and recipients (Boschma & Iammarino, Citation2009).
Drawing further on Boschma and Iammarino (Citation2009), the ability of the region to benefit from the inflow of external knowledge sources seems to be contingent on that knowledge neither being too close to nor too far away from the current practice of domestic industry. Following earlier work by Nooteboom (Citation2000), the implication is that learning and recombination of knowledge may be enhanced when the balance is not too tilted in the one or the other direction. Knowledge-sources outside the region and the knowledge that can already be found within it need to be in balance in terms of ‘cognitive proximity’, for them to successfully combine and for unrelated diversity to succeed.
The element of knowledge space that we are interested in – and which we use to define economic sectors in the paper – involves the skill-sets of the workforce. In short, a main channel to help affect the diversification of regional economies into relatively unrelated fields involves the crucial ability to draw on new knowledge in the form of the skills of new employees. While proximity could be measured in technological terms, for instance through an analysis of patenting (see, e.g. Balland, Boschma, Crespo, & Rigby, Citation2018; and Tanner, Citation2014), we assume that proximity depends mainly on skill-relatedness across sectors (in line with Neffke & Henning, Citation2013). This raises the question of the mechanisms through which new industries may be stimulated to connect to technologically related industries at the regional level. The next subsection will explore the role of policymakers and other decision makers to try to promote diversification into emerging sectors.
2.2. Policy inflected literature: smart-specialization and constructed regional advantage
The second strand of literature that we focus on is the more policy-oriented literature on smart-specialization and constructed regional advantage, where renewed appreciation of the important restructuring role that the policy frame can play has been sparked by Mazzucato (Citation2016) and other recent work (Schot & Steinmueller, Citation2018). Boschma and Gianelle (Citation2014) elaborate the relationship between regional branching and smart specialization policy explicitly, focusing on the role policy can play to promote regional diversification. This is ‘understood as an emerging process through which new activities develop out of existing ones, but the scope and outcome of this process are fundamentally affected by technological and cognitive constraints’ (Boschma & Gianelle, Citation2014, p. 5). Here, recent policy approaches (Coenen, Hansen, & Rekers, Citation2015; Klein Woolthuis, Lankhuizen, & Gilsing, Citation2005; Weber & Rohracher, Citation2012) suggest the importance of policy for example to address capability and directionality failures (Schot & Steinmueller, Citation2018).
Smart specialization involves a general public policy focus on domains that ‘complement the country's other productive assets to create future domestic capability and interregional comparative advantage’ (Foray et al., Citation2009, p. 1). This entails prioritising public investments in knowledge-based assets via a combination of bottom-up and top-down processes at the regional level. The framework is designed to focus public investments on particular activities so as to enhance the strengths of the capabilities already found there (Foray, Mowery, & Nelson, Citation2012). The overall goal is to promote ‘structural change in the economy through investments in knowledge-based assets and better governance in STI policy making’ (OECD, Citation2013, p. 14).
As the OECD (Citation2013) indicates, the smart specialization framework assumes that the public policy frame has at its disposal three types of capabilities, namely:
the capacity to identify local strengths;
the ability to align policy actions and to build critical mass; and
the ability of regions to develop a vision and implement the strategy.
The Smart Specialisation approach is very clear about the potential risk that policymakers face if they try to develop growth paths into specified activities and industries. In general, smart specialization insists that policymakers resist the urge to try to ‘pick winners’. However, the promotion of environmental technologies in addressing ‘societal challenges’ provides a separate policy issue (Foray et al., Citation2009; Mowery et al., Citation2010; Schot & Steinmueller, Citation2018). It is not restricted to a response to ‘market failure’. Instead, the government starts from a set of priorities and the question is how to best focus resources on the achievement of specific objectives in support of policy goals. Policymakers need to understand mechanisms that may shape the new growth paths into these technologies based on existing activity and assets, and they need a way to diagnose points in the system where there are apparent strengths or weaknesses. Notably, they need to understand where policy-relevant sectors can contribute best to local knowledge flows, given the increasing need of aligning policies across different geographic levels (Wanzenböck & Frenken, Citation2018).
3. Defining the empirical approach
In the light of the literature review, we develop a diagnostic system focusing on Norway; this section defines our empirical approach. An industrial policy which encompasses regional restructuring should be based on knowledge about the capabilities embedded in the current economic composition of regions. Economic capabilities – in terms of technology, skills and natural resources – are integral to how sectors emerge across regions – in terms of firms and employment – and, ultimately, how regional economies perform over time. Thus, the sectoral composition of the region stands out as an ideal starting point for the policy-maker (to think about restructuring). Each economic sector can be depicted as a different circle in a region's economic set, ideally circumscribing the firms and employees operating in the sector. Some capabilities may not correspond to only one sector, especially at higher levels of aggregation, but there are always capabilities that are sector-specific; therefore, a first rough approach to the capabilities of the region would entail some measurement of the current activities that a region has within each sector, as proxied, for instance, in terms of employment or turnover.
A second reason to use economic sectors as the units of our regional analysis lies in the channels that the regional policy will ultimately be able to utilize. If the policy instruments are going to affect different firms (incumbents or entrants), a first way to group the target firms is by the type of products and processes they deal with, which in turn defines roughly the economic sector to which the firms belong. The economic sector (old or new) can represent the best unit for a policy target in that it indicates a function within the regional supply chains. The level of aggregation at which sectors should be considered is closely linked to the level of aggregation at which we want the policy to act. illustrates how individual economic activities may be grouped into subsets (i.e. the circles) once they are associated with specific economic sectors. Each subset can then be construed to be a node in a network, where two nodes are seen to connect if the knowledge exchange between them is deemed to contribute to innovation and growth based on established criteria. Adopting a geographic terminology, we qualify as ‘proximate’ any two economic sectors between which a knowledge exchange can be fruitful. Our simplifying assumption that proximity depends mainly on skill-relatedness across sectors (in line with Neffke & Henning, Citation2013) is based upon the idea that a transfer of knowledge across sectors can be fruitful if the skills employed in the two sectors partially overlap, and captures an important aspect of the regional innovation processes. Moreover, it allows us to refer to practical examples of possible empirical research, without undermining our general theoretical framework. A direct consequence of the assumption is to utilize data on past cross-sectoral labour flows to infer skill-relatedness across sectors and, in network terms, to build connections among nodes. Once the connections are built, the visualization of the potential knowledge flows across the economic sectors in the region allows a first assessment of how a regional policy, targeted at a particular sector, can spread its effects throughout the whole economy, in terms of innovation and, consequently, of growth. Moreover, the analysis of the network, and the construction of indicators of the centrality of each node within the network, may give an indication as to which nodes can be considered strategic for keeping knowledge flowing throughout the economy.
Figure 1. Network representation of a regional economy. Network nodes (depicted as circles) represents subsets of regional economic activities, as associated with specific economic sectors. Network connections (depicted as arrows) represent potential intersectoral knowledge flows (for each arrow, the receiving node is the one closer to the arrowhead). In this directed network, the bottom-right ‘striped’ node contributes to the network's knowledge flows more than the bottom-center ‘chequered’ node.

In , the connections between nodes, in terms of skill-relatedness, are depicted as arrows. Recent empirical works on regional innovation systems (see, e.g. Fitjar & Timmermans, Citation2017) have indeed depicted directed networks to represent knowledge flows among economic sectors. At the same time, Boschma (Citation2017) has mentioned the explicit consideration of asymmetric relations across economic sectors as a pillar for new strands of scientific literature in regional studies. We argue that the move from undirected to directed networks in the representation of regional economies would force policymakers to refine the boundaries of their goals, since a sector in a strategic position for its own growth may not appear any longer as a sector in a strategic position for the growth of the region as a whole.
A question addressed by a regional policymaker might be ‘which sector would most benefit the region’ rather than ‘which sector would most benefit from the region’. Therefore, when pondering the strategic relevance of an economic sector, we should not focus simply on the possibilities of growth of the target sector, but we should apply equal, if not higher, weight to the contribution of that sector to growth in other sectors of the regional economy. A researcher could argue that the two goals, even if separate from a political point of view, could be achieved by the same policy in many practical cases, given that a node which occupies a central position in a network is usually supposed to benefit from many different flows across the network. However, this is not the case when networks are directed. For the case of , a policymaker might well decide to invest in the bottom-right ‘striped’ economic sector instead of the ‘chequered’ economic sector, whose position would seem to be strategic (‘central’) within an undirected network, but not in a directed network.
The authorities may also want to consider the economic consequences, for the region, of the satellite activities gravitating around the target sectors. In the same way that a target sector may attract a factor of production like labour from other economic sectors present in the region, the same target sector could attract intermediate goods from within the region, either directly through immediate suppliers, or indirectly, and from all the other actors situated upstream along the supply chain. Input-output analysis should arguably be used to measure the induced effects of a restructuring policy from the upstream sectors of the supply chain, on the basis of the quantity of intermediate goods that are supposed to be requested in order to satisfy the increased sector-specific activity pushed by the policy. In some cases, they may overlap with the knowledge relations (depicted through solid segments), and in other cases they may not, due to the fact that buyers can be distant from suppliers in terms of skills and technology, while knowledge flows may not depend on market transactions (Dietzenbacher & Los, Citation2002; Martin, Citation2017; Montresor & Marzetti, Citation2009). However, input-output tables may not include new economic sectors or can be obsolete when a sector is characterized by a high innovation activity (possibly spurred by the policy itself). In the following, we show a methodology for how customs data on international trade can provide complementary information to infer potential input-output linkages.
4. Methodology
4.1. Objective
Suppose that a national government wants to promote the production of a particular type of goods, and wants to consider regions where several layers of the corresponding supply chain could be located. Moreover, the policy should be applied in a region where the activities could contribute well to the knowledge flows in the region, including those knowledge interchanges among sectors which do not occur through market transactions. In connection with the literature discussed in the previous sections, we suggest a two-step procedure for choosing the best regions to implement such industrial policy. In particular, we operationalize our policy goals through an Input-output restriction, bringing a focus on the regions where local supply chains can be envisioned, and a Knowledge centrality ranking, to understand which regions could benefit the most from the policy-target sector in terms of contribution to intraregional knowledge flows.
The procedure relies, at the same time, on linked employer-employee data and on firm-level international trade data. The contemporaneous use of different types of quantitative data can bring to the surface regional features which would otherwise remain undetected.
4.2. Preliminary analysis of firm-level international trade data: identification of firms in the emerging industry
In order to elaborate a regional policy connected to an emerging industry, we want to understand which inputs may be important for developing the desired policy-relevant products. Looking at the imports of firms involved in the industry can provide a hint at important inputs required. However, to detect which firms are involved in the emerging industry is itself a challenge: we need to circumscribe a set of firms having a similar bundle of output goods, which would appear at least partially as exports in the international trade data, in order to give meaning to an analysis of their inputs. The question we face is: which output good to focus on, as a typical output of the emerging industry?
A starting point can lie in an analysis of the recent empirical literature about the same emerging industry, which can provide information about some of the firms already active in the industry, and about their current classification in the NACE (Nomenclature of Economic Activities) ‘traditional’ industry categories.
Afterwards, a transaction-level international trade dataset can be used to isolate the export transactions of goods classified by the same 4-digit CPA (Classification of Products by Activity) product codes corresponding to the NACE codes of the emerging industry (a one-to-one association exists between 4-digit CPA codes and 4-digit NACE industry codes). If we additionally suppose that the trade dataset also includes product code descriptions at a finer level of product disaggregation, as for the case of the 8-digit ‘tariff code’ level often set by customs duties, then the additional information can be used to further restrict the attention on the export of particular ‘policy-relevant’ goods (the ‘tariff code’ is an 8-digit extension of the 6-digit HS, Harmonised System, product code). In particular, the dataset would allow to check which HS/tariff product codes (at a lower level of aggregation) have been associated to the export transactions classified by the CPA code (at a higher level of aggregation). The retrieved HS/tariff codes can, in turn, be used when scanning the firm-level international trade data to identify all the firms which have exported the ‘policy-relevant’ goods. Those are the firms which we will focus on, in order to infer possible input-output relations in the emerging industry: the past international trade transactions will indeed suggest which inputs have been imported in order to export the ‘policy-relevant’ goods, i.e. to export goods in the retrieved HS/tariff categories. Such input-output inference will be described in Section 4.4; before then, however, an additional analytical step is needed, as described in the next subsection.
4.3. Preliminary analysis of employer-employee data: sectoral skill-relatedness and regional economic composition
This subsection is based on the assumption that an ‘employer-employee’ dataset is available, i.e. a dataset associating, within a country, each employee to each employer. Even when data are anonymised, as is usually the case, this type of dataset allows to track the labour flows between industrial sectors, given that each employer is classified also according to an industrial categorization (in the following, we assume a NACE industry categorization, at 4-digit, is available at establishment-level). Then, for a number of recent years (the choice is subjective, based on for how many years we consider the industry-skills association sufficiently stable), we can register all employees who moved from one employer to another from one year to the next, e.g. from 2008 to 2009, and we cross-classify them by the industry they left in the previous year and the industry they entered in the subsequent year. We include here movements within the same industry. Then, we add up all these inter and intra industry flows for each of these consecutive pairs of years, to make up a total of inter (and intra) industry labour flows for the whole time span considered.
The observed flows of persons between industries are compared to the flows which would have been expected if flows between industries were random, i.e. if no pair of industries were more tightly connected in terms of labour flows than other pairs of industries. The expected number of persons moving from industry i to industry j is calculated as the total number of persons moving out of industry i (to any industry) multiplied by the total number of persons entering industry j (from any industry), divided by the total number of movers (from any industry to any industry):
For the flow of employees between any pair of industries i and j, we may define a relatedness ratio as the ratio between observed and expected flow of employees:
If this ratio is above 1, the flow between the two industries is larger than what we would have expected if the labour flow among industries were random.
This ratio varies from 0 to infinity and is thus highly skewed. This may be normalized to vary between −1 and 1 through the following transformation:
The same standardization is used in the section ‘Regional Skill Relatedness’ of Fitjar and Timmermans (Citation2017), where two sectors are considered as skill-related when the standardized measure of skill-relatedness (Rationorm in our wording) is higher than 0.25. However, we apply additional restrictions for qualifying two sectors as skill-related. In particular, to get a rough impression of whether the difference between the observed frequency in a given cell and the expected frequency given a null hypothesis of statistical independence (H0) is statistically significant, we use the adjusted residuals test for each cell, as suggested by Alan Agresti (see p. 31 in Agresti, Citation1996). The adjusted residuals are defined as:
According to Agresti, ‘an adjusted residual that exceeds about 2 or 3 in absolute value indicates lack of fit of H0 in that cell’, i.e. lack of fit with a null hypothesis of statistical independence; in our analysis, we will use a threshold of 3. This test is only valid for ‘large samples’, and Agresti suggests that a ‘large sample’ in this connection is one where the expected frequency in the cell in question is at least 5. However, for our purposes, the use of a higher threshold is recommendable: if a few employees have moved between sectors which usually employ a very small percentage of the working population, the corresponding labour flow might not have a ‘skill-relatedness’ meaning. Instead, it could be ascribed entirely to purely personal motivations or to unskilled types of occupations: even if this inferential problem is always present, its relevance becomes much larger when we consider a labour flow consisting of a few people, given the discrete nature of labour flows. In our empirical analysis, we will double the threshold value suggested by Agresti and thus use a threshold of 10 (a robustness check, on different values, will be described at the end of the next section). Summing up, we will consider two sectors i and j as skill-related when all the following three conditions are satisfied:
We should also note that no account is taken here of the problem of clustering in the data. People do not just work individually in this or that industry. In most cases they work in firms together with several other people. For different reasons and in different ways, they will often also move together with other people. This emphasizes the point that the adjusted residuals measure here only should be taken as a rough indicator of statistical significance.
To have a view of the industrial composition of each region in the country, we can compute the distribution of employees across industries in all regions for the most recent year. For the definition of regions, we suggest to use a disaggregation level below NUTS3, possibly to a labour market scale. We calculate the number of employees in each industry in each region we would have expected if the distribution of employees across industries were the same in each region as it is in the country as a whole. For industry i in region j it is calculated as:
If the observed number of employees is higher than this expected number, then this particular industry is overrepresented in this region; if it is lower, the industry is underrepresented. In exactly the same way as with the labour flows, we construct a ratio between observed and expected, and we normalize this ratio to get a measure which varies between −1 and 1. Unlike for the inference of skill-relatedness described before, we do not evaluate a significance measure of the ratio: we will simply consider a sector i as overrepresented (underrepresented) in a region j if the corresponding normalized ratio (we may call it a ‘normalised sectoral representation ratio’) is higher (lower) than zero.Footnote1
4.4. Input-output restriction
After the preliminary analyses described in the previous subsections, a step of our procedure aims at answering the question: which regions are best suited to provide inputs for the emerging industry? An input-output restriction can be applied through the following five sub-steps:
For each year in the same recent time span considered previously, we identify, in the firm-level external trade data, all the firms that have exported at least one of the ‘policy-relevant’ goods, i.e. the goods belonging to the product categories (HS/tariff codes) retrieved according to Section 4.2. We thus obtain a list of firm-year observations: ‘which firm has exported the considered goods in which year’.
We exclude all the firm-year observations where, in the corresponding year, the value of the exports of the corresponding firm, for the two tariff codes above, has been lower than 50% of the value of all exports, by the same firm in the same year.Footnote2 This way, we focus on firms that have had the considered goods as main exports, narrowing the risk of studying unrelated imports afterwards.
For the remaining firm-year observations, we isolate the five import categories, defined according to a 4-digit CPA index, which weigh the most, in terms of value, among all the 4-digit CPA categories of imports of the same firm in the same year. We thus get, for each firm-year observation, a list of five 4-digit CPA categories, which we see as likely inputs used by the firm for the production of the considered goods during the year.
We pool together, across all firm-year observations, the lists of five 4-digit CPA categories, and we obtain a list of 4-digit CPA categories, ordered from the most recurrent across the firm-year observations to the least recurrent. We focus on the most recurrent categories in the list, which we consider as possible strategic input categories for the production of the considered goods.
We select all the regions where at least two of the 4-digit NACE sectors mentioned above are overrepresented with respect to the whole country. In particular, following the procedure in Section 4.3, we keep only the regions where at least two of the 4-digit NACE sectors, mentioned above, show an observed number of employees higher than expected, given both the regional total employment and the nation-wide industry employment.
Following the previous five procedure steps, we are left with a short list of ‘focus’ labour market regions, where we assume that a local process of import substitution could gradually take place if a regional policy aimed at the production of the considered goods were implemented.
4.5. Knowledge centrality ranking
In each region, we consider as nodes of a ‘potential knowledge network’ all the 2-digit NACE sectors that are overrepresented in the region in terms of employment, i.e. for which the normalized sectoral representation ratio, as defined above in Section 4.3, is higher than zero. To these existing nodes, we add another node: a ‘policy target’ sector, even when currently underrepresented. As ‘policy target’ sector, we consider the 2-digit version of the 4-digit NACE sector which has previously been associated with the production of the considered goods (see Section 4.2). A stimulated production of the goods would indeed represent a boost to the ‘policy target’ 2-digit NACE sector; we want to know, for each of the ‘focus’ regions defined at the end of the previous subsection, what position the ‘policy target’ sector in question occupies, or would occupy, in an ideal network of local knowledge flows among sectors.
The network connections among the nodes are inferred on the basis of the sectoral skill-relatedness (see Section 4.3). On this constructed network, which is different for each region because each region has different ‘overrepresented’ sectors, we assess the potential centrality of the ‘policy target’ sector node. This is because we want to understand, for each of the regions which have satisfied the input-output restriction, how the local intersectoral knowledge flows would be affected by a stimulated production of the considered goods.
For simplicity, in this paper we use as a measure of centrality the original ‘betweenness centrality index’ described in the seminal article by Freeman (Citation1977). However, more refined measures could be advised as well, depending on the context of application. For instance, a ‘flow betweenness’ measure, as in Freeman, Borgatti, and White (Citation1991), would be especially useful when a weight can be assigned to each connection in the network. If, instead, the network nodes were divided into subgroups, e.g. on the basis of their sector code first digit, then the ‘brokerage role’ of the target sector could be analysed, as in Gould and Fernandez (Citation1989), to understand whether the target sector could assume a special function by connecting different node groups.
The ‘focus’ regions are then ranked according to the centrality of the ‘policy target’ sector. Such ‘knowledge centrality ranking’ constitutes the final output of our procedure: the information summarized in it covers both input-output and knowledge flow considerations, and thus represent an empirical ground on which policymakers can start to assess possible fits between regional capabilities and industrial policies.
5. Empirical application: the photovoltaic industry in Norway
5.1. Motivation for focusing on the photovoltaic industry
Why have we selected the photovoltaic industry as a case for our empirical example of green economic restructuring? First, solar photovoltaics has contributed to an increasing share of renewable energy capacity installed in the world. Second, Norwegian companies have represented a major share of the global photovoltaic industry, also after the financial crisis which contributed to the closure of many other Western PV companies. Third, Norwegian companies have been located in different regions of Norway (Northern Norway, Central Norway, Capital region and Southern Norway), often close to hydropower plants, and have connected to existing competencies in pre-existing processing industries. Fourth, close trade links have been established to foreign markets: through import of machinery and equipment from Europe for the automated production lines of the Norwegian PV companies, through the delivery of silicon grade from subsidiaries in the U.S. to wafer companies in Norway, and through the export of solar cells to European and Asian countries. Fifth, the largest Norwegian PV companies are still located in Norway, but their relations have swung to Asia, especially to China and Singapore, through ownership structures and through international deliveries between subsidiaries.
However, the use of photovoltaics to showcase this particular use of data faces a number of obstacles. These obstacles are related to the complex structure of the value chain of photovoltaics and to how photovoltaic products are defined in the trade data (see the next subsections). There exist many different intermediary products which may be traded in the value chain, either domestically or internationally. Since Norwegian firms may have been involved in providing these products, there are potentially many domestic transactions that cannot be traced to the international trade data.
As a result, the definition of the photovoltaic products becomes somewhat blurred and requires fine tuning. We acknowledge these obstacles, but we think that such obstacles can be addressed and would probably also be found for other industries. An alternative would be to start with an industry that has few or no intermediate products and just a few final products to be traded. But this would rather be an exception than the rule.
5.2. Data
We use firm-level external trade data of Norway from Statistics Norway (Citation2017a) where, for anonymity purposes, enterprises with less than 5 employees have been excluded; the firm identifier is available at enterprise level (the same firm identifier can thus cover several firm establishments). The data cover the time span between years 2009 and 2015, and includes product identifiers for each exported good, according to the 8-digit HS/tariff codes (‘varenummer’, in Norwegian) and the 4-digit CPA code. The NACE industrial code of the exporting firm is also available.
To infer the skill-relatedness of industrial sectors, we use linked employee-employer data from Statistics Norway (Citation2017b). The data at the individual employee level cover all persons in Norway between the age of 15 and the age of 75. Furthermore, the data include an employer variable in the form of a unique firm identifier where the employee works; the firm identifier is available at establishment level (thus, at a finer level of disaggregation than for the trade data). If a person is employed by more than one firm, the person is registered as employed by the firm where he or she works most hours a week.
The Statistics Norway data register the situation in one given reference week each year. We can thus register if an employee has moved to a different firm from this particular week in a given year to the reference week 12 months later. We do not know if there have been any further movements within this 12-month period.
For the 6-year period 2008–2014, we register all employees who moved from one firm to another from one year to the next, e.g. from 2008 to 2009, and we cross-classify them by the industry they left in the previous year and the industry they entered in the subsequent year. We include here movements within the same industry. Lastly, all these inter and intra industry flows are added up for each of these six consecutive pairs of years to make up a total of inter (and intra) industry labour flows for the whole 6-year period 2008–2014.
Industry is here defined by the NACE classification system, and the labour flows are tallied at the 2-, the 3- and the 4-digit NACE levels.Footnote3 Firms are here defined at the individual plant or establishment level, rather than at the enterprise level. The enterprise is here the legal unit, and may comprise several establishments. The definition of industry is also related to the establishment level.
To have a view of the industrial composition of Norwegian regions, we compute the distribution of employees across industries in all regions in Norway for year 2014. For the definition of regions, we use the 161 labour market regions constructed in Juvkam (Citation2002). The classifications are made both at the NACE 2-digit, 3-digit and 4-digit levels; we will first use 2-digit and then 4-digit in our analysis. Only employees between 18 and 65 years of age, who worked at least 20 h a week, are included.
5.3. Results
The key players in Norway's photovoltaic industry, as described in Klitkou and Coenen (Citation2013), have been characterized by the 4-digit NACE code ‘2013’ (NACE description: ‘Manufacture of other inorganic basic chemicals’), which can be associated with the production of silicon. Therefore, exploiting the one-to-one association between 4-digit CPA codes and 4-digit NACE codes, we checked which tariff codes were associated with the export transactions classified by the CPA 2013 code. It resulted that, in the years under consideration, a high share of the value of exports in CPA 2013 coded goods (40% of the total in year 2011) was associated with the tariff code 28046900 (i.e. ‘Silicon, containing pure silicon for less than 99,99% of the weight’). We decided then to concentrate our analysis on the production of silicon, with the focal tariff codes of 28046100 and 28046900.
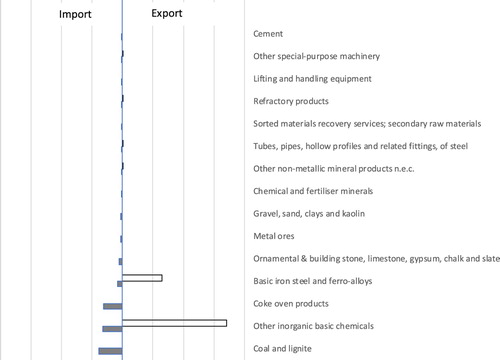
shows the volume of export and import for all Norwegian companies which have exported the two types of silicon products in year 2011: silicon with a content of at least 99.99% weight silicon (CPA 28046100) and silicon with a content of less than 99.99% weight silicon (CPA 28046900). The actual values are not so important here, since we use this information only to show how the information about the firms’ exports can be traced back to the information about the imports of the same firms.
Figure 2. Imports and exports of all Norwegian firms exporting two types of silicon products in 2011.
Note: The two product codes are silicon with a content of at least 99.99% weight silicon (product nr. 28046100) and silicon, with a content of less than 99.99% weight silicon (product nr. 28046900).
We now aim at answering the question: which Norwegian regions are best suited to provide inputs for a nascent photovoltaic industry? For the definition of regions, we use the 161 Norwegian labour market regions. For each year between 2009 and 2015 included, we identify in the firm-level external trade data of Norway (Statistics Norway, Citation2017a) all the firms that have exported at least one of the two goods. We thus obtain a list of firm-year observations: ‘which firm has exported silicon in which year’.
We then exclude all the firm-year observations where, in the corresponding year, the value of the exports of the corresponding firm, for the two tariff codes above, has been lower than 50% of the value of all exports, by the same firm in the same year. For the remaining firm-year observations, we isolate the five import categories, defined according to a 4-digit CPA index, which weigh the most, in terms of value, among all the 4-digit CPA categories of imports of the same firm in the same year. We thus get, for each firm-year observation, a list of five 4-digit CPA categories, which we see as likely inputs used by the firm for the production of silicon during the year.
We pool together, across all firm-year observations, the lists of five 4-digit CPA categories, and we obtain the following list of eight 4-digit CPA categories, ordered from the most recurrent across the firm-year observations to the least recurrent: 0500, 0811, 1910, 2013, 2445, 2410, 2790, 2890. If we had obtained a longer list, we would focus only on the most recurrent categories in the list. With the short list we obtained, instead, it looks that the firm-year observations in our data do not differ too much among themselves; we will then consider all the eight CPA categories as possible strategic input categories for the production of silicon.
In , we can read on the right column the description of the corresponding 4-digit NACE code (at 4-digit, there is a precise correspondence between CPA and NACE), which provides a suggestion of the industrial sectors which have provided the imported inputs. Notice the presence of sector 2013, which is also the sector which would be often associated to the exports we consider.
Table 1. Recurrent import categories (4-digit CPA) among firm-year observations of silicon exporters (left column) and corresponding NACE industrial sectors (right column).
The categories 0500 and 2890 correspond to categories that could have been narrowed down according to the fourth digit, but have not been narrowed down in the firms’ trade declarations. For 0500, we decide to consider both the two 4-digit subcategories 0510 (NACE: ‘Mining of hard coal’) and 0520 (NACE: ‘Mining of lignite’). Instead, we decide to exclude the categories 0811 and 2890, since the many subcategories of ‘Ornamental and building stone, limestone, gypsum, chalk and slate’ (0811) and ‘Special-purpose machinery’ (2890) constitute extremely heterogeneous sets.
We select all the labour market regions where at least two of the 4-digit NACE sectors mentioned above are overrepresented with respect to Norway as a whole, and we are thus left with four labour market regions, where we assume that a local process of import substitution could gradually take place if a regional policy aimed at silicon production were implemented. shows, in the left column, the names of the four regions and, in the central columns, the NACE codes of sectors that are both possible input providers and already overrepresented in the region.
Table 2. Labour market areas in Norway where at least two industrial sectors are present which might, in the future, provide inputs for the photovoltaic industry.
In each region, we consider as nodes of a ‘potential knowledge network’ all the 2-digit sectors that are overrepresented in the region in terms of employment, i.e. for which the normalized sectoral representation ratio, as defined above in Section 4.3, is higher than zero. To these existing nodes, we add another node: a ‘policy target’ sector, even when currently underrepresented. In our example, the ‘policy target’ sector is the NACE sector ‘20’ (chemicals sector), chosen as the 2-digit version of the 4-digit sector ‘2013’ which has previously been associated to the silicon production (see Section 5.3). A stimulated production of silicon would indeed represent a boost to the NACE sector 20; we want to know, for each of the four regions, what position the ‘policy target’ sector occupies, or would occupy, in an ideal network of local knowledge flows among sectors.
As shown in the right column of , the Kristiansand labour market area shows, among the four regions, the highest centrality of sector 20 in the regional ‘potential knowledge network’. In other words, a policy stimulating the production of chemicals could, in Kristiansand, contribute best to bridge knowledge among the industrial sectors of the region.
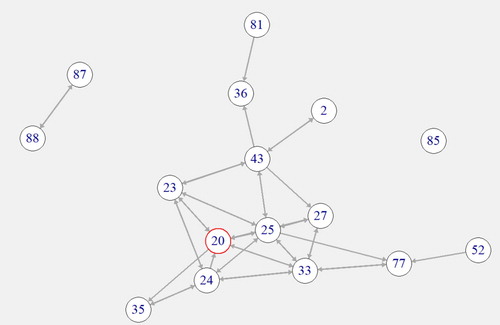
To better grasp an intuition of the ranking, it is interesting to give a look at the potential knowledge network in the regions of Odda and Sauda, ranked as second and fourth according to the centrality index (shown on the right column of ). The two labour market areas of Odda and Sauda share a solid industrial tradition, and both their economies are less diversified than in Kristiansand. Their potential knowledge networks are shown respectively in and and show many similarities; however, the ‘policy target’ sector 20 would have a much higher centrality in Odda than in Sauda. Why is this the case? Notice that both in Odda and in Sauda Manufacture of chemicals (20) could connect with Production of electricity (35), but only in Odda could Production of electricity (35) connect with Civil engineering (42). Analogously, notice how in Odda Manufacture of chemicals (20) is an important connector for the knowledge coming from Manufacture of fabricated metal products (25), while, in Sauda, Manufacture of fabricated metal products (25) occupies a more central position in the potential knowledge network. These small differences in the network topology lead to a much higher centrality of the chemicals sector in Odda, and could give one argument for preferring Odda over Sauda as a target region for a policy aimed at silicon production.
Figure 3. Potential knowledge network for the Odda labour market region. Source: own calculations based on data from Statistics Norway (Citation2017b). Legend (NACE code numbers and sector abbreviated names – partial list): 20 chemicals; 22 rubber and plastic products; 24 basic metals; 25 fabricated metal products; 33 repair and installation of machinery; 35 electricity, gas, steam; 38 waste-related activities; 42 civil engineering; 71 architecture and engineering.
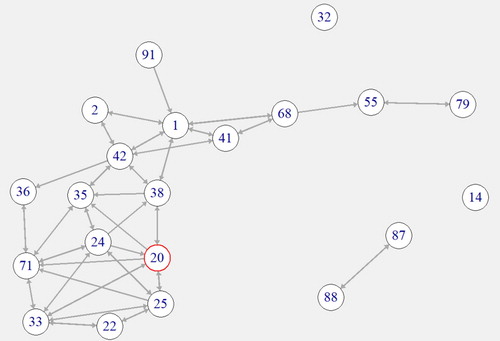
Figure 4. Potential knowledge network for the Sauda labour market region. Source: own calculations based on data from Statistics Norway (Citation2017b). Legend (NACE code numbers and sector abbreviated names – partial list): 20 chemicals; 23 other non-metallic mineral products; 24 basic metals; 25 fabricated metal products; 27 electrical equipment; 33 repair and installation of machinery; 35 electricity, gas, steam; 43 specialized construction.
In order to check the robustness of our results, and the sensitivity of the method, to variations in the adjusted residual threshold (see Section 4.3), we have repeated the procedure adopting, subsequently, all threshold values between 0 and 40. For thresholds higher than 30, the centrality index of Sector 20 is equal to zero for all four regions, since the high threshold makes all network connections disappear in all regions. Already for thresholds higher than 23, so many network connections disappear that the centrality index of Sector 20 is zero for all regions but Kristiansand. Odda exhibits a higher centrality index than Sauda for all threshold values below 17. Kristiansand has the highest centrality also for all threshold values higher than 4. The robustness check thus seems to confirm that low threshold values alter the networks by adding spurious connections (i.e. by inferring skill-relatedness between sectors when labour flows are negligible), while high threshold values erase important connections in the networks (i.e. they make sectors look isolated even when affected by strong labour flows). At our level of sector disaggregation (2-digit), the threshold value we adopted, equal to 10, seems reasonable; for future purposes, we advise to adapt the procedure to the sector disaggregation level chosen.
6. Conclusion
6.1. Smart specialisation in the context of prioritized industries
Our mapping procedure identifies activities where there are potential areas for recombination of complementary assets that could be used to encourage regions to branch into new activities. The approach demonstrates a promising way to use data resources available in Norway as well as in other European countries, specifically using firm-linked trade-data (to help map embodied capabilities) and linked employment data (to help map technological capacities) to create a foundation for such a ‘diagnostic system’. The example we have shown, of a fast ‘semi-automatic’ selection of candidate regions for a photovoltaic-industry policy, indicates the potential of international trade transaction data as a signal of input-output relations in an emerging policy-relevant sector. We want to emphasize that, through our approach, we are able to grasp information about current value and availability of both natural resources and intermediate goods, describing economic elements which go beyond the technological relations among sectors. Not only international transactions show what firms need: they also show the financial burden of acquiring what firms need. When evaluating the economic feasibility of an industrial policy for economic restructuring, this information may become extremely valuable. It allows policymakers to understand possible new growth paths based on existing activities and assets. Further policy analysis has to complete the picture.
6.2. Caveats
We bear in mind that a quantitative empirical method cannot alone provide an ultimate answer about how to purse a policy goal, since qualitative considerations and theoretical models are essential for a deep understanding of sectoral co-evolution. We advocate the use of a quantitative empirical method to restrict the researcher's attention to a smaller set of sectors and regions, so that a smaller amount of costly time and efforts would be needed by a complementary focused research.
A difficulty we encounter, when developing a methodology based on a sectoral classification, lies in the relation between manufacturing and service activities. Services retain a strong importance in the regional economies not only through their direct employment weight and value creation, but also by supporting the manufacturing activities in the region. Such support can occur by means of labourers operating service activities while employed by firms mainly devoted to manufacturing. As a consequence, there is a bias in our inference of sectoral skill-relatedness among sectors: some labour flows between manufacturing sectors could be due to the movement across firms of employees performing service activities, and thus would not witness a particular skill relatedness among manufacturing sectors.
Defining the border of a region, from a socio-economic perspective, also remains a difficult task. In our examples, we have used the borders of labour market areas to bound local knowledge flows, but knowledge can of course spill over into other regions. A possible way to cope with such difficulty is introducing, in the automatic procedures for data analysis, also elements of spatial econometrics, for instance to allow for some form of spatial dependence in the regional knowledge base.
Similarly, better ways should be found to redefine, for the purposes of the analysis, the borders between goods categories. For each good under consideration in industrial policy planning, whether an input or an output for the industrial sector of interest, the level of category aggregation should be under examination. When using international trade data, a proper reflection should precede choosing the appropriate number of digits in the good's CPA or tariff code, and/or grouping together all goods that could fulfil the same function in the value chain.
6.3. Potential extensions and further research
There are several possible refinements in the current set up. The knowledge flows can be enriched by a better knowledge of the research and innovation patterns of the industries in which complementary assets are identified. R&D activity, innovation intensity and use of intellectual property rights can be associated with the different activities to better understand the types of employment flows and how they link with the innovation intensity of the different activities. A promising data source here is the link between the employment data and the R&D surveys connected to the Community Innovation Survey. Moreover, the intersection between international trade data and regionalized patent activities in related technology fields constitutes a promising line of study. Patent applications in a technological area can be seen as indicative of ongoing RD&I activities that have a presumptive commercial value. Studying patent activities connected to a policy-relevant technology thus represents one important avenue for assessing the regional potential in an industrial sector.
Additional data about the location of firms (and of plants belonging to firms) could provide information about the inputs available to a particular region even when not produced in the region. A suggestion for further research is then: in order to choose where to implement an industrial policy, it is worth considering not only where to create local value chains, but also where to connect to existing international value chains. In other words, it would be useful to identify a set of regions that are internationally connected to a strategic input, because of the existing presence of local importers. More generally, the existing international trade in a strategic input, if associated with a particular region, could qualify the same region as a target location for a national industrial policy.
Finally, additional input-output considerations could develop from viewing regional-level maps of natural resources. For instance, maps built on the basis of previous studies about forest localization and wind strength could be used as additional ‘layers’ for the input-output restriction, to suggest local supply chains in respectively wood-based and wind-power industries.
Acknowledgement
We thank Pierre-Alexandre Balland, Christian Binz, Filippo Bontadini, Tom Brökel, Rikard Eriksson, Pasquale Marcello Falcone, Jens Grøgaard, Jutta Günther, Sverre Herstad, Muhamed Kudic, Sergi Lozano, Trond Løyning, Jannika Mattes, Piergiuseppe Morone, Svein Olav Nås, Angelo Secchi, Bram Timmermans, Frank van der Wouden and all the participants to the NIFU workshop on Industrial Dynamics (NIFU, Norway, September 2017), to the FORINNPOL Reference Group meeting (Research Council of Norway, Norway, November 2017), to the 3rd EAEPE Research Area [X] ‘Networks’ workshop (University of Bremen, Germany, November 2017), to the Bioeconomy in Transition seminar (Unitelma Sapienza University of Rome, Italy, December 2017) and to the Economic Geography research seminar (Utrecht University, the Netherlands, March 2018), for useful comments and suggestions.
Disclosure statement
No potential conflict of interest was reported by the authors.
ORCID
Marco Capasso http://orcid.org/0000-0003-2057-299X
Eric James Iversen http://orcid.org/0000-0001-8143-5118
Antje Klitkou http://orcid.org/0000-0002-3593-8272
Additional information
Funding
Notes
1 Similar approaches have been used in the literature on ‘economic base analysis’ (see, e.g. Haig, Citation1927; Hoyt, Citation1961) and ‘revealed comparative advantage’ (Balassa, Citation1965).
2 There is some degree of arbitrariness in the thresholds considered in this subsection. To help the reader getting an operational idea of the method, we mention here the same thresholds that we will use for our empirical example. Different thresholds can be adopted in different contexts; more in general, human supervision is supposed to support the whole procedure, and we do not envision a fully automatized procedure.
3 This system is hierarchical: the 4-digit categories are sub categories of the 3-digit categories, which in turn are sub categories of the 2-digit categories.
References
- Agresti, A. (1996). An introduction to categorical data analysis (Vols. 135). New York: Wiley.
- Antonelli, C., Patrucco, P. P., & Quatraro, F. (2011). Productivity growth and pecuniary knowledge externalities: An empirical analysis of agglomeration economies in European regions. Economic Geography, 87(1), 23–50. doi: 10.1111/j.1944-8287.2010.01104.x
- Asheim, B. T., Boschma, R., & Cooke, P. (2011). Constructing regional advantage: Platform policies based on related variety and differentiated knowledge bases. Regional Studies, 45(7), 893–904. doi: 10.1080/00343404.2010.543126
- Balassa, B. (1965). Trade liberalisation and “revealed” comparative advantage. The Manchester School, 33(2), 99–123. doi: 10.1111/j.1467-9957.1965.tb00050.x
- Balland, P.-A., Boschma, R., Crespo, J., & Rigby, D. L. (2018). Smart specialization policy in the European Union: Relatedness, knowledge complexity and regional diversification. Regional Studies, 1–17. doi: 10.1080/00343404.2018.1437900
- Boschma, R. (2014). Constructing regional advantage and smart specialisation: Comparison of two European policy concepts. Scienze Regionali, 13(1), 51–68. doi: 10.3280/SCRE2014-001004
- Boschma, R. (2017). Relatedness as driver of regional diversification: A research agenda. Regional Studies, 51(3), 351–364. doi: 10.1080/00343404.2016.1254767
- Boschma, R., & Frenken, K. (2012). Technological relatedness and regional branching. In H. Bathelt, M. P. Feldman, & D. F. Kogler (Eds.), Beyond territory. Dynamic geographies of knowledge creation, diffusion and innovation (pp. 64–81). Milton Park: Routledge.
- Boschma, R., & Gianelle, C. (2014). Regional branching and smart specialization policy. Publications office of the European Union.
- Boschma, R., & Iammarino, S. (2009). Related variety, trade linkages, and regional growth in Italy. Economic Geography, 85(3), 289–311. doi: 10.1111/j.1944-8287.2009.01034.x
- Coenen, L., Hansen, T., & Rekers, J. V. (2015). Innovation policy for grand challenges. An economic geography perspective. Geography Compass, 9(9), 483–496. doi: 10.1111/gec3.12231
- Dietzenbacher, E., & Los, B. (2002). Externalities of R&D Expenditures. Economic Systems Research, 14(4), 407–425. doi: 10.1080/0953531022000024860
- Fagerberg, J., Verspagen, B., & von Tunzelmann, G. N. (1994). The dynamics of technology, trade and growth. Cheltenham: Edward Elgar Publishing.
- Fitjar, R. D., & Timmermans, B. (2017). Regional skill relatedness: Towards a new measure of regional related diversification. European Planning Studies, 25(3), 516–538. doi: 10.1080/09654313.2016.1244515
- Foray, D., David, P. A., & Hall, B. (2009). Smart specialisation–the concept. Knowledge Economists Policy Brief, 9(85), 100.
- Foray, D., Mowery, D. C., & Nelson, R. R. (2012). Public R&D and social challenges: What lessons from mission R&D programs? Research Policy, 41(10), 1697–1702. doi: 10.1016/j.respol.2012.07.011
- Freeman, L. C. (1977). A set of measures of centrality based on betweenness. Sociometry, 40, 35–41. doi: 10.2307/3033543
- Freeman, L. C., Borgatti, S. P., & White, D. R. (1991). Centrality in valued graphs: A measure of betweenness based on network flow. Social Networks, 13(2), 141–154. doi: 10.1016/0378-8733(91)90017-N
- Frenken, K., Van Oort, F., & Verburg, T. (2007). Related variety, unrelated variety and regional economic growth. Regional Studies, 41(5), 685–697. doi: 10.1080/00343400601120296
- Gould, R. V., & Fernandez, R. M. (1989). Structures of mediation: A formal approach to brokerage in transaction networks. Sociological Methodology, 19, 89–126. doi: 10.2307/270949
- Haig, R. M. (1927). Regional survey of New York and its environs. New York: Regional Planning Committee. (U.S.A.).
- Hoyt, H. (1961). The utility of the economic base method in calculating urban growth. Land Economics, 37(1), 51–58. doi: 10.2307/3159349
- Jacobs, J. (1969). The economy of cities. New York: Random House.
- Juvkam, D. (2002). Inndeling i bo- og arbeidsmarkedsregioner. Oslo: NIBR - Norsk institutt for by- og region-forskning. Retrieved from https://www.regjeringen.no/globalassets/upload/kilde/krd/red/2004/0024/ddd/pdfv/176119-nibrrapport200220baregioner.pdf.
- Klein Woolthuis, R., Lankhuizen, M., & Gilsing, V. (2005). A system failure framework for innovation policy design. Technovation, 25(6), 609–619. doi: 10.1016/j.technovation.2003.11.002
- Klitkou, A., & Coenen, L. (2013). The emergence of the Norwegian solar photovoltaic industry in a regional perspective. European Planning Studies, 21(11), 1796–1819. doi: 10.1080/09654313.2012.753691
- Martin, R. (2017). Cumulative causation, endogenous growth, and regional development. In International encyclopedia of geography: People, the earth, environment and technology (pp. 1–13). Hoboken: John Wiley & Sons, Ltd. doi: 10.1002/9781118786352.wbieg0702
- Mazzucato, M. (2016). From market fixing to market-creating: A new framework for innovation policy. Industry and Innovation, 23(2), 140–156. doi: 10.1080/13662716.2016.1146124
- Montresor, S., & Marzetti, G. V. (2009). Applying social network analysis to input-output based innovation matrices: An illustrative application to six OECD technological systems for the middle 1990s. Economic Systems Research, 21(2), 129–149. doi: 10.1080/09535310902940228
- Mowery, D. C., Nelson, R. R., & Martin, B. R. (2010). Technology policy and global warming: Why new policy models are needed (or why putting new wine in old bottles won’t work). Research Policy, 39(8), 1011–1023. doi: 10.1016/j.respol.2010.05.008
- Neffke, F., & Henning, M. (2013). Skill relatedness and firm diversification. Strategic Management Journal, 34(3), 297–316. doi: 10.1002/smj.2014
- Nooteboom, B. (2000). Learning by interaction: Absorptive capacity, cognitive distance and governance. Journal of Management and Governance, 4(1-2), 69–92. doi: 10.1023/A:1009941416749
- OECD. (2013). Innovation driven-growth in regions: The role of smart specialisation. Paris: OECD Publications.
- Pinheiro, F. L., Alshamsi, A., Hartmann, D., Boschma, R., & Hidalgo, C. J. (2018). Shooting low or high: Do countries benefit from entering unrelated activities?
- Schot, J., & Steinmueller, W. E. (2018). Three frames for innovation policy: R&D, systems of innovation and transformative change. Research Policy, 47(9), 1554–1567. doi: 10.1016/j.respol.2018.08.011
- Statistics Norway. (2017a). External trade data (2004–2015) [database]. Oslo: Statistics Norway.
- Statistics Norway. (2017b). Firm-linked AA-data: Full count register data of employees at all Norwegian firms (2008–2014) [database]. Oslo: Statistics Norway.
- Tanner, A. N. (2014). Regional branching reconsidered: Emergence of the fuel cell industry in European regions. Economic Geography, 90(4), 403–427. doi: 10.1111/ecge.12055
- United Nations. (2015). Transforming our world: The 2030 agenda for sustainable development. New York: United Nations, Division for Sustainable Development Goals. Retrieved from https://sustainabledevelopment.un.org/index.php?page=view&type=400&nr=2125&menu=1515
- Wanzenböck, I., & Frenken, K. (2018). The subsidiarity principle: Turning challenge-oriented innovation policy on its head.
- Weber, K. M., & Rohracher, H. (2012). Legitimizing research, technology and innovation policies for transformative change – combining insights from innovation systems and multi-level perspective in a comprehensive ‘failures’ framework. Research Policy, 41(6), 1037–1047. doi: 10.1016/j.respol.2011.10.015