
ABSTRACT
Situated in northern Europe, the capital regions of Helsinki, and Oslo have many similar premises concerning urban development. However, the structure of the two regions differs by many measures. We explore the differences in urban density and its development in the both regions and the policy instruments that have affected them. Differences are identified by comparing the population densities of urban settlements and the mean distances from residents and workplaces to the city centres of Oslo and Helsinki using GIS methodology and existing literature. In the Oslo region, the population density shifted from a decreasing trend to an increasing one in the late 1980s. In contrast, the Helsinki region only started to densify in the 2010s. Also, the mean distance of residents and workplaces from the city centre is farther in Helsinki. The long period of low-density housing development and the creation of jobs outside centres in Helsinki is related to weaker political steering towards a compact urban form. In Oslo, regulations such as a greenbelt policy but also physical factors, led to densification relatively early. Lagging in densification policies, Helsinki could learn from the experiences of steering land use and mobility in Oslo, which would need additional research.
1. Introduction
In the twentieth century, and especially after World War II, urban development in most European cities was dominated by outward expansion. In some parts of Europe this is still the case (Guastella, Queslati, and Pareglio Citation2019; Mustafa and Teller Citation2020), and as late as 2006 the European Environmental Agency characterized urban sprawl in Europe as ‘the ignored challenge’ (EEA Citation2006). However, in many parts of Europe outward expansion has increasingly been combined with densification within existing built-up areas (OECD Citation2012), and in some countries (notably in Norway and Sweden) densification has become the predominant form of urban development. Construction of new dwellings and offices in former industrial and harbour areas vacated due to global relocation processes has been an important part of the new densification trend. The densification of inner-city areas in Finnish cities, however, only began much more recently.
Some authors have interpreted processes of outward expansion and densification as different stages of more-or-less cyclical trajectories of urban development, evolving from urbanization via suburbanization to counter-urbanization to reurbanisation, before starting over again (Hall Citation1971; van Den Berg, Burns, and Klaassen Citation1987; Champion Citation2001). Others have described the dispersion of urban population over spatially extended urban regions with lower-density settlements as the inevitable outcome of the expressed location preferences of people and firms (Breheny Citation1995; Bruegmann Citation2005). However, during recent decades new arguments have emerged in favour of urban containment in addition to the classical ones related to the loss of farmland, natural areas and biodiversity (Beatley Citation2000; Du, Shi, and van Rompaey Citation2014) caused by urban sprawl. Several studies have shown that low-density suburban development increases the need for motorized travel, including two recent in-depth studies done in the Oslo region. Suburban residents as well as employees at suburban workplaces tend to travel longer distance for commuting as well as intra-metropolitan non-work purposes and carry out higher proportions of their travel by car (Næss et al. Citation2019a, Citation2019b). Similar results have been found in the Helsinki region (Czepkiewicz et al. Citation2018; Ristimäki et al. Citation2013; Ristimäki, Kalenoja, and Tiitu Citation2011), although the study on workplace location (Martamo Citation1995) is rather old. With a stronger focus on climate change mitigation and objectives of limiting car traffic being of increasing importance for the urban agenda, densification is expected to play an important role in reducing transport-related environmental problems. Together with stronger cultural preferences for urban living and sustainability concerns regarding land consumption, this may increase the acceptance of higher densities, postponing and reducing future urban spatial expansions.
In this article, we compare the regions of Oslo and Helsinki as a means of understanding the differences in the development of urban density in Nordic cities and underlying policies. We chose Helsinki and Oslo because both are Nordic capital regions with similar population size but have adopted quite different policies to govern urban development. By analysing the spatial development of the two regions, we aim to answer the following research questions: (1) What are the basic differences in urban density (population and workplaces) and its development in the Helsinki and Oslo metropolitan regions? (2) What local conditions, planning objectives and policy instruments have contributed to the differences in densities, and what can be learned for the future?
2. Materials and methods
We used GIS methodology to analyse the differences in the densities of the two metropolitan regions. First, we defined the outer border of the two metropolitan regions (section 2.1). Second, we delineated the urban settlements for each region and created a finer-scale spatial classification to better differentiate the densities within different kinds of areas (section 2.2.). Finally, data on population and workplaces was analysed and aggregated into the spatial classifications (section 2.3). All the GIS analyses were conducted using ArcGIS software version 10.7.1. The background factors, with a particular interest on planning objectives and policy instruments in the two regions, were identified with a literature review of available academic literature and planning documents.
2.1. Spatial dimension of the metropolitan regions
The starting point for identifying spatial differences in urban densities is to define the reach of the metropolitan regions of Oslo and Helsinki. No commonly agreed upon definition exists for how to demarcate a functional urban region. Often, demarcations based on the proportion of workforce participants commuting to the main regional centre are used (Davoudi Citation2008), where the functional urban region is defined as consisting of municipalities where, for example, at least ten per cent of the workforce participants commute to the core municipality. Another way of demarcating it is to include the areas from which the core city centre can be reached within a given commuting time by car. Usually, these kinds of demarcations include all parts of those municipalities that are considered to have met the criteria. For municipalities that cover a large area, this gives rise to inaccuracies. An alternative, more simplified way of demarcation is to define the functional urban region as the area covered by a circle with a chosen radius around the centre of the core city. This is the approach used in the present study. Based on information from previous studies and data on commuting in the Oslo and Helsinki region (Juvkam Citation2002; Engebretsen and Gjerdåker Citation2012; YKR Citation2019), we have chosen a circle with a radius of 50 km (as the crow flies) to demarcate the regions of Oslo and Helsinki (). This demarcation may somewhat underestimate the actual size of the commuting hinterland of Oslo to the north and north-east, while overestimating its size somewhat in the south-eastern and south-western direction (see Engebretsen and Gjerdåker Citation2012, 40). In the Helsinki region, the fact that nearly half of the area covered by a 50-km-radius circle is open sea might suggest that the circle should be drawn with a somewhat wider radius in this region. However, the actual commuting patterns and other spatial interactions in the region based on the national YKR database (Citation2019) indicate that the 50 km radius is adequate for the Helsinki region as well. Such a common demarcation also makes it easier to compare the development between the two regions.
Figure 1. The classification of urban settlements used in this study.
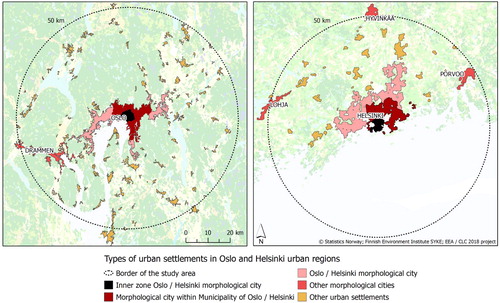
In the Helsinki region, the centre point was defined as the same point that was used to define the diverse pedestrian-oriented area in the dataset travel-related urban zones (Finnish Environment Institute Citation2017). According to the methodology, the centre is defined as the centre point of the 250-m grid cell with the most jobs in industries that usually gravitate to the city centre. The number of jobs is calculated as a focal sum of adjacent grid cells. The resulting point was located 500 m southwest of the central railway station of Helsinki. Since we were not able to conduct a similar analysis for Oslo, the centre point of Oslo was defined as the square in front of the central railway station. All urban settlements touching the boundary of the 50-km buffer zone were included in the analysis.
It should be noted that spatial demarcations of urban regions, like the distance-based demarcation used in this study, disregard other relevant ways of conceptualizing urban regions. Among the three societal processes mentioned by Onsager and Selstad (Citation2004) as important for the generation of regions (interaction, identification and institutionalizing factors), our demarcation is based on the first aspect.
2.2. Definitions for urban settlements
According to a common Nordic definition, a cluster of buildings forms an urban settlement if the cluster contains at least 200 persons (OECD Citation2007). Statistics Norway (Citation2019) also defines that the distance between the buildings in urban settlements shall not exceed 50 m. Deviations are allowed for areas that are not be occupied, for example parks, sport facilities, industrial areas or natural barriers such as rivers or arable land. Agglomerations that naturally belong to the main urban settlement up to 400 m from its outer border are included. The official demarcation of Finnish urban settlements, i.e. localities, is based on a statistical grid dataset with a spatial resolution of 250 m (YKR Citation2019). The criteria for localities are the number and floor area of buildings as a GIS-based focal statistics analysis, population (at least 200 inhabitants) and the relations between all the variables measured in distance (Finnish Environment Institute Citation2019).
Prior to conducting the comparative analysis of urban settlements in Helsinki and Oslo, the densities of different types of urban settlement delineations for the Helsinki region were tested. First, we demarcated urban settlements for the Helsinki region in accordance with the above Norwegian definition by processing the Finnish Building and Dwelling Register (BDR) (Population Register Centre Citation2018). The procedure was carried out following the exact criteria used in Norway as much as possible. The methodology still had some uncertainties related to different building classifications in Norway and Finland. Second, the resulting delineations were compared to two existing national Finnish spatial classifications for urban settlements: (1) the localities and (2) the so-called densely built locality settlements (Finnish Environment Institute Citation2019). The second dataset consists of localities with an area efficiency of at least 0.02, and to match the common Nordic criterion, we only included in the calculation settlements with at least 200 inhabitants. We found that the density values of the settlements demarcated by the Norwegian methodology were very much in line with the density values of the Finnish densely built locality settlements (2) with at least 200 inhabitants, the values deviating by only 3% in the Helsinki central locality. The densely-built locality settlements dataset did not recognize so much small settlements at the outer edge of the region compared to the delineation produced by following the Norwegian method. Nevertheless, we chose to use densely-built locality settlements to compare urban settlements between Helsinki and Oslo. The reasoning for this choice was the similar densities and that the Finnish building register data (that the Norwegian method needs) only dates to the year 2000. With the chosen spatial classification, we were able to analyse urban settlements from the 1980s onwards using the same spatial definition for urban settlements.
The data for the spatial extension of urban settlements for Oslo was available in a coarse version starting in 1982 (based on a point sampling method applied to aerial photographs), with data from 1955 onwards. The existing, more accurate version (based on cadastral and registry data) was introduced in 2000 (Dysterud and Engelien Citation2000). The urban settlement delineations for both Oslo and Helsinki are geographical areas with dynamic boundaries. Their borders change yearly depending on construction intensity and population dynamics.
For a more detailed spatial analysis, the urban settlements were divided into smaller spatial units (). The six most central administrative units of Oslo were classified as the inner zone of Oslo. The land area of that zone was calculated, and the corresponding land area surrounding the city centre of Helsinki was calculated and classified as the inner zone of Helsinki. The spatial coverage of the inner zones is approximately 4 km from the centre point. The continuous, most central urban settlements in the two regions were classified as the morphological city of Oslo and Helsinki. Also, the largest other urban areas in the two metropolitan regions (Drammen in the Oslo region, and Hyvinkää, Lohja and Porvoo in the Helsinki region) were classified as independent morphological cities.
2.3. Data on population and workplaces
Comprehensive and high-accuracy annual data for population and area coverage of Norwegian urban settlements are available only for the period since 2000. The following description of spatial development within the Oslo region is based mainly on data from Statistics Norway (Citation2019).Footnote1 As a supplement, we have used information from the Municipality of Oslo (Citation2019) on population development within different intra-municipal geographical zones. The Finnish data on population and jobs was based on the Monitoring System of Spatial Structure and Urban Form, YKR (YKR Citation2019). Along with a variety of other socioeconomic variables, the dataset includes the population and number of jobs in a 250-m grid. YKR data is available from 1980 onwards. The population data is fully compatible with the delineations of urban settlements, since the delineation criteria for settlements are based on YKR data.
The data on jobs in the Oslo metropolitan region was retrieved from Statistics Norway (Citation2018). The data was grid-based with a spatial resolution of 250 m, and it included information on the total number of employees and Euclidean distance to the city centre of Oslo in 2017. The spatial coverage of the data used in this study was 50 km from the city centre. The average distance of jobs was calculated for both regions to assess the spatial urban development of workplaces. To assess the workplaces’ potential for walking, cycling and public transport-oriented mobility, we used dimensional circles of 2, 5 and 8 km proposed by Newman, Kosonen, and Kenworthy (Citation2016).
3. Historical background and drivers of urban development
3.1. Description of the Oslo and Helsinki metropolitan regions
The metropolitan region of Oslo as we have defined it had a population of 1.5 million in 2018, of which 1.44 million resided in urban settlements. Just above one million (1,000,500) lived in the morphological city of Oslo. The Oslo region has a predominantly monocentric urban structure, with downtown Oslo as the main centre, supplemented by a limited number of second-order centres and many local centres. The city centre is situated at the end of the Oslo fjord, from which the city branches out in three distinct ways: inland north-eastwards, and southwards along both sides of the fjord. The second-order centres are connected to the main city centre by commuter trains. In addition, a quite extensive metro system established in the 1960s connects many of the local centres with the downtown area, and there is also a metro ring connecting radial metro lines with each other. To the north, east and west, forested hills (Marka) surround the city.
Like Oslo, the metropolitan region of Helsinki had 1.5 million inhabitants in 2017. Approximately 1.43 million persons lived in urban settlements and approximately 90,000 outside of them. Almost 1.2 million inhabitants (1,164,000), or 77% of the inhabitants, lived within the morphological city of Helsinki. Helsinki metropolitan region is located by the coastline of the Baltic Sea, which has directed the city to grow northwards and along the coastline. The inner city of Helsinki has a tram network along with two metro lines that also extend to the inner subcentres and suburbs. The commuter trains operate in various directions connecting peri-urban centres with Helsinki and its subcentres. The Helsinki region is the most extensive commuting area in Finland. The majority of the largest subcentres are connected to the city centre by rail.
3.2. Planning objectives and policy instruments used for steering urban development
In the Oslo Metropolitan Area, the discourses supporting compact city development have converged into a doctrine for urban development (Faludi and Van der Valk Citation1994). The doctrine comes close to what is often termed a ‘hegemonic discourse’ within a field of society (Hajer Citation1995). In the Oslo region, an urban containment doctrine, motivated particularly by the desire to protect the Marka forest areas surrounding the city, prevailed for a long time before the transportation impacts of outward urban expansion entered the Norwegian planning agenda (Næss Citation1981; TOBIAS Citation1998). Today, there is also a widespread understanding among participants in the Norwegian land-use-planning discourse that densification rather than sprawl is preferable in order to reduce car travel (Næss, Næss, and Strand Citation2009; Næss, Næss, and Strand Citation2011a; Hanssen, Hofstad, and Saglie Citation2015). Cultural, economic and political conditions are therefore important circumstances that have facilitated Oslo’s densification policies. Within the Norwegian profession of spatial planners, the compact city model has obtained hegemonic status as a model for sustainable urban development (Hoftun Citation2002; Næss, Næss, and Strand Citation2011a). In a Norwegian context, the compact city is widely understood as a densely developed city clearly demarcated against its surroundings, consisting of urban districts connected by public transportation services, and where residents can reach jobs and service facilities within a short distance from the dwelling (Hanssen, Hofstad, and Saglie Citation2015, 15). These characteristics are similar to the ones mentioned by OECD (Citation2012) in their publication on compact city policies. Oslo has had a road pricing system since 1990. In the beginning, 80% of the revenues were used for road construction, but increasingly, the revenues are used for public transport improvements, now accounting for nearly three quarters of the spending within the Oslo region and 93% within the municipality of Oslo.
The municipalities forming the Oslo Metropolitan Area (in particular the Municipality of Oslo) have used the planning legislation actively to prevent urban sprawl. National Policy Provisions for Coordinated Land Use and Transport Planning and a ministerial directive requiring affected municipalities to incorporate the Marka border in their master land use plans have both been important instruments for implementing national goals in the plans of the municipalities of the Oslo region. The possibility for county authorities to object to municipal plans violating these national provisions has also been important. In 2009, the Marka forest areas were protected by a national law, making it even more difficult for municipalities to expand their urban areas beyond the Marka border. Moreover, a joint land use and transportation plan for the municipality of Oslo and the neighbouring county of Akershus was adopted in 2015. This plan opens for a more polycentric development, still with an emphasis on densification in the morphological city of Oslo as well as in the other urban settlements of the region.
Within the zone set aside for development, the master plans have been more flexible, leaving considerable room for negotiation between the municipal authorities and developers about the content and design of development at specific sites. An important case in point is, however, that the limited possibilities for urban expansion ensured through the master plans have increased the motivation of developers for embarking on brownfield transformation projects.
The Helsinki metropolitan region is planned at the regional scale (Helsinki-Uusimaa regional plan) and at the local scale (municipal master plans). Since 2000, regional planning has been guided by national land use guidelines drawn up by the government (Ministry of the Environment Citation2017), which aim at, e.g. reducing municipal and transport emissions and preserving biodiversity. The consolidating of urban form has been emphasized in the national guidelines since 2000 but implementing the objective as part of practical planning has been slow and difficult (Maijala and Sairinen Citation2009). Further, the Finnish concept of compact city policies of ‘coherent urban structures’ is slightly different from the idea of densification or ‘more compact’ cities (OECD Citation2012). The key idea in planning ‘coherent urban structures’ is the development within existing infrastructure and land use with no particular emphasis on inner-city densification.
The master plan 2002 of Helsinki made inner-city densification possible by enabling the transforming of vast port areas for housing. Even though the freighter port was already zoned outside the city centre in the master plan of 1992, the housing construction in the area only began after 2010. The objective of the 2002 plan was to direct growth into inner-city areas but also surrounding areas as a polycentric structure (City of Helsinki Citation2002). Already in the master plan of 1970, the essential goal was to direct population growth as ribbon city along the rail corridors (City of Helsinki Citation2012) indicating polycentricity. Polycentricity and spatial balance have also been on the agenda of the regional planning strategies since 2000 and the national guidelines for the region (Helsinki-Uusimaa Regional Council Citation2007; OECD Citation2012).
There is no administrative body or statutory plan to govern the land use in the Helsinki at a city-region-scale, but since 2008, there has been a governmental tool to steer urbanization and promote integrated planning of land use, housing and transport in the region: the so-called MAL letters of intent. They are agreements between the state and city-region municipalities aiming at enhanced cooperation and, for example, the construction of a certain number of dwellings per year to support new investment in public transport. However, the tool has been insufficient to fully solve problems related to the lack of integrated, inter-municipal planning, such as urban sprawl in the peri-urban municipalities due to competition of tax-payers and investments (Mäntysalo, Kangasoja, and Kanninen Citation2015; Hytönen et al., Citation2016). In the Nordic countries, the municipalities have a powerful position in land use planning, but even in the Nordic context, the Finnish municipalities have a great deal of power and autonomy from the state (Maijala and Sairinen Citation2009; Granqvist, Sarjamo, and Mäntysalo Citation2019), which make them key actors in densification policies.
Densification has become a predominant objective in the most recent planning processes at different scales in the Helsinki region. The objectives in the new master plan of Helsinki include continuing to develop housing in the inner-city brownfield areas, developing light-rail connections, and transforming the motorway-like entry routes into city boulevards by 2050 (City of Helsinki Citation2016). To reach its goal of carbon neutrality by 2035, the City of Helsinki needs to reduce traffic-sector greenhouse emissions by 69% (City of Helsinki Citation2018). The action plan includes several actions for sustainable transport modes, and trials with road pricing, which nonetheless requires a governmental decision before being implemented. At the city-region scale, the Helsinki region has adopted a non-statutory MAL 2019 plan drawn up by the actors of the City of Helsinki and the other 13 surrounding municipalities, including projected population numbers and jobs until 2050 (Helsinki Region Transport Citation2019). The plan also includes a list of means to achieve its goals (‘low-emission, attractive, vital, and healthy’) by, for example, major investments in rail transport and cycling. However, the plan is based on voluntary cooperation between the municipalities, and it is not legally binding.
4. Urban density
4.1. Development of population density in the morphological cities of Oslo and Helsinki
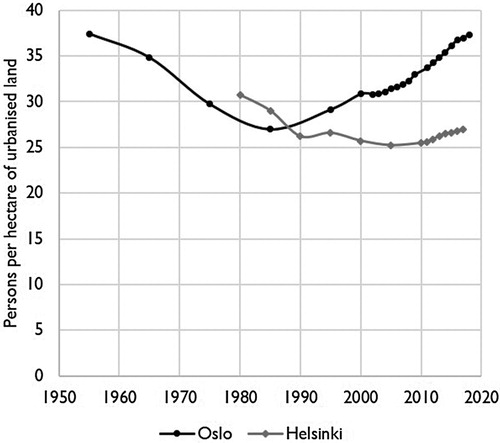
The metropolitan region of Oslo has undergone a remarkable transition from suburbanization and exurbanisation during the first four decades after World War II to reurbanisation since the 1990s. The reurbanisation trend started already in the 1980s. After several decades of urban sprawl and reduced population densities, the outward urban expansion was significantly reduced in the mid-1980s (). Population density within Oslo morphological city increased by 38% from 27.0 to 37.3 persons per hectare between 1985 and 2018 (Engebretsen Citation1993; Riksrevisjonen Citation2007; Statistics Norway Citation2019).
Figure 2. Changes in population density within the morphological cities of Helsinki and Oslo between 1955 and 2018 (sources: Engebretsen Citation1993; Riksrevisjonen Citation2007; Statistics Norway Citation2019; YKR Citation2019).
In addition to policy instruments promoting densification, several other conditions have facilitated such urban development. The rocky terrain of the Marka hills has counteracted spatial expansion of the city, which would require costly terrain levelling works. As part of globalization processes, industries had moved abroad and left large areas vacant for urban transformation. Strong economic growth and high in-migration to the city have contributed to a high pace of development, and hence, a rapid increase in urban population density. The densification has required renewed investments in technical and social infrastructure in the inner city. This has, in turn, made inner-city living and job locations more attractive, leading to a higher population base, facilitating further infrastructure improvements. Thus, it has been a self-amplifying process.
The Helsinki region has had a long period of urban sprawl, lasting as late as the 2010s, in terms of population density decrease in the urban settlements (). The urban sprawl was the most intense during the 1980s with the increase in overall affluence and motorization of society. During 1990–1995, the population density temporarily increased due to the economic downturn that held back the construction of housing into peri-urban areas. The implementation of the Domicile Act in 1994, which allowed students to be registered in the municipalities they study in, also increased the officially calculated density, since there are many academies and universities located in the morphological city of Helsinki. Compared to other European city regions, urban sprawl in the Helsinki region has been generally higher (EEA Citation2016). However, like several other European capitals, Helsinki exhibited a decline in sprawl between 2006 and 2009, during the economic downturn. The increase of the population density has continued ever since.
In addition to the economic fluctuations, the development of population density in the Helsinki region has been affected by the weak political steering at both national and city-region scale (see section 3.2). Concerning the demographic factors, the average household size in the municipality of Helsinki (1.88 in 2017) has been on a lower level compared to municipality of Oslo (1.99) throughout the 2000s (OSF Citation2019; Statistics Norway Citation2020), which also decreases the population density. Another factor lowering the densities is the housing space per person, which in the municipality of Helsinki increased steeply until the economic downturn in 2007, after which it has remained stable (around 34 m2/person) (OSF Citation2019). The increase in population density in the 2010s has been simultaneous with the strengthening inner-city densification policies.
4.2. Population density in the different urban settlements in the twenty-first century
In the Oslo region, the total population increased by 33% from 1.14 million to 1.50 million over the period 2000–2018. Population growth in the Helsinki region was more moderate, 20% between 2000 and 2017. The population living in urban settlements also increased by 35% by 2018 in the Oslo region, while in the Helsinki region only by 22%. The rural population has decreased slightly in both regions: by 3% in Oslo and by 5% in Helsinki.
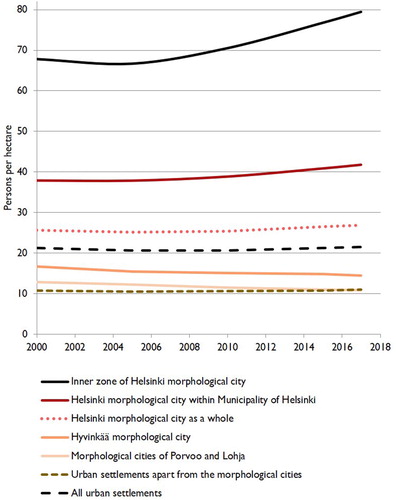
and show how the population densities of urban settlements within different parts of the Helsinki and Oslo regions have developed over the period 2000–2017/2018. In the Oslo region, the greatest part of new housing construction has taken place as densification, reflected in an overall increase in the population density for all urban settlements in the region by 14% from a weighted average of 25.1 to 28.7 inhabitants per hectare. The densification was most intense in the second half of the period. In the Helsinki region, the average density of urban settlements is lower, and it has remained rather the same during the whole period, increasing from only 21.3 to 21.5. However, the finer spatial classifications show crucial differences between the development of the inner zone of Helsinki and the rest of the region.
Figure 3. Changes in population densities of urban settlements within different parts of the Oslo region (and population densities within different parts of the morphological city of Oslo) over the period 2000–2018 (sources: Statistics Norway Citation2019; Municipality of Oslo Citation2019).
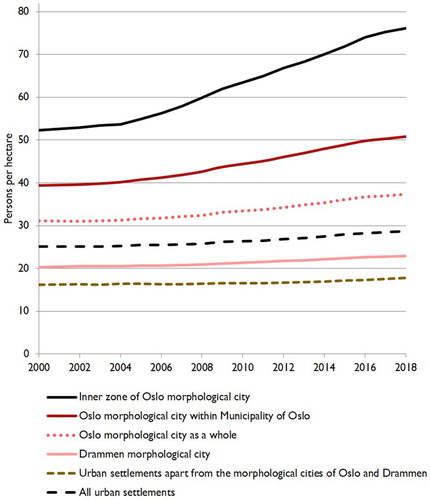
Figure 4. Changes in population densities of urban settlements within different parts of the Helsinki region (and population densities within different parts of the morphological city of Helsinki) over the period 2000–2017 (sources: YKR Citation2019).
Despite the considerable population growth in Oslo, there is hardly any tendency towards decentralization of the population from the inner to the outer parts of the region. The population’s average distance from dwelling place to the city centre of Oslo has remained nearly constant at about 16.0 km throughout the period. In the Helsinki region, residents’ mean distance to the city centre is longer and has had more variation between 2000 and 2017. In the 2000s, the average distance of the population from the centre increased by more than two kilometres, from 15.1 km to 17.4 km. From 2010 onwards, the distance has been on a slight decrease, still reaching 17.0 km in 2017.
The morphological city of Oslo increased its population from 773,500 in 2000 to 1,000,500 inhabitants in 2018. During the years 2000–2018, the share of the population of the Oslo morphological city living within the municipality of Oslo increased from 65% in 2000 to 67% in 2018. As mentioned above, the morphological city of Oslo has undergone substantial densification over the last three decades. Its population density increased from 27 to 37.3 persons per hectare over the period 1985–2018.Footnote2 From 2000 to 2018, the population density increased from 31.1 to 37.3 persons per hectare, i.e. by 18%. Whereas the population increased by 35% over the period, the size of the urbanized area increased by only 7%. The increase of the population density was particularly strong in the last ten years of the period. This strong population density increase must be seen in light of the rapid population growth that Oslo experienced during the period 2008–2018 (from 856,900 to 1,000,500 inhabitants). Without the high population growth rate, the strong population density increase would not have been possible, regardless of any strategy for compact urban development.
In the Helsinki region, the share of population of the morphological city living within the municipality of Helsinki decreased from 56% to 53% in 2000–2017. The population density of the morphological city of Helsinki slightly decreased between 2000 and 2010, while it started to increase after 2010, but only by 5% from 25.5 persons per hectare in 2010 to 26.9 persons in 2017. This leaves the overall population density of the Helsinki morphological city at a much lower level compared to Oslo. The urbanized area in the Helsinki morphological city has also increased more, by 16% in 2000–2017.
The population density has increased particularly in the inner zones of both regions. Since the spatial extent of the urbanized land in these zones remained constant, this implies a population density increase of 46% in Oslo and 17% in Helsinki. The inner zone of Helsinki is denser than Oslo in terms of population density, which was 79.5 persons per hectare in Helsinki (2017) compared to 76.0 in Oslo (2018). The inner zone of Helsinki started to densify after the mid-2000s, which is related to the economic downswing and the brownfield development of the vacant inner-city port areas.
Apart from Oslo morphological city, the Oslo region includes another morphological city: Drammen, with 117,500 inhabitants with increasing population and densification. The population density increase from 2000 to 2018 was 12%. The Helsinki region includes three morphological cities besides Helsinki: Hyvinkää, Porvoo and Lohja. These settlements do not show signs of densification: their population densities declined during 2000–2017 by 13% in Hyvinkää, and by 16% in Porvoo and Lohja.
The average population density of the urban settlements outside Oslo and Drammen increased by 10% during 2000–2018. This is clearly lower than the regional average of 14%. In the Helsinki region, population densities outside the morphological cities are at an even lower level than in Oslo: 11.0 persons per hectare in 2017. The density has remained almost constant since 2000.
4.3. Workplaces
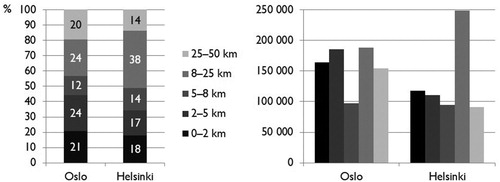
In 2015, the area covering 50 km from the city centre of Oslo had 789,600 jobs, while the corresponding area for Helsinki had 662,900 jobs. This means that there were 19% fewer jobs in Helsinki region than in Oslo region, even though the population of the regions are quite the same. This is probably due to the following facts: (1) The employment rate in 2015 was 72,9% in Finland and 79,1% in Norway (Eurostat Citation2020); (2) There are three large city regions (Tampere with 138,000 jobs; Turku 113,000; and Lahti 46,000 jobs) at a time distance of 1–2 h via rail to Helsinki region, which form a joint labour market; (3) The jobs whose exact location is unknown are not included in the analysis for the Helsinki region. There were 61,810 jobs, roughly 7% of the total number of jobs in the whole administrative region, in the administrative Helsinki-Uusimaa Region that reaches slightly further from the 50-km area, whose location is only known at the municipality-level. This did not allow us to take them into account in the distance-based calculation.
In 2015, 57% of the jobs in the Oslo region were located within 8 km of the city centre (). The share has remained basically the same from 2013 onwards. In the Helsinki region, 49% of the jobs were located within 8 km of the centre. Comparing the distribution of jobs in Helsinki and Oslo reveals that 44% of jobs within the Oslo metropolitan region are located within 5 km from the centre, whereas the share in Helsinki is only 34%. At a more detailed scale, the difference applies mainly to the zone between 2 and 5 km, where Helsinki has much fewer jobs. This distance signifies the fringe of the walking urban fabric, which also has the potential for cycling. In addition, the Helsinki region has many more jobs in the area between 8km and 25 km. The difference is greatest in the distance class of 10–15 km. This distance equals the zone surrounding Ring Road III, which has many large retail and industrial workplace agglomerations along it, mostly accessible by car, but also a few subcentres connected to the centre via railway. Beyond 25 km from the city centre, the share of jobs is larger in the Oslo region. The latter reflects the fact that the city of Drammen, which had 114,000 inhabitants in 2015 and is a significant centre, is located within this zone (see above). Like Oslo, the distribution of jobs at different distance classes has remained roughly the same in the Helsinki region throughout the 2010s.
Figure 5. The distribution of jobs into Euclidean-distance classes from the city centre in 2015: percentages (to the left) and absolute numbers (to the right) (sources: Statistics Norway Citation2018; YKR Citation2019).
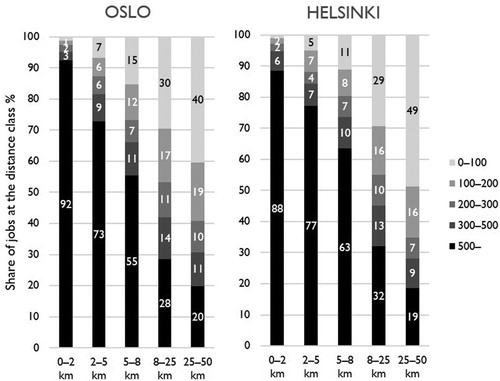
presents the shares (%) of areas with different numbers of employees at different distances from the city centre. The figures show that, overall, the more jobs that areas (250 × 250 m) have, the closer to the city centre they are located. Of the largest job concentrations with more than 500 jobs, 30% are located within 2 km of the city centre in Helsinki and 36% in Oslo. These largest job concentrations comprise approximately 90% of the all jobs near the city centres in both regions. Smaller job concentrations, grid cells with less than 100 jobs, are the most common in areas beyond 25 km of both the city centres. This describes the overall declining workplace density in relation to distance from the city centre in both regions.
Figure 6. Share (%) of 250-m grid cells with different numbers of employees at different distances from the city centre in 2015 (sources: Statistics Norway Citation2018; YKR Citation2019).
5. Discussion
In this study, we have compared the urban density of the Helsinki and Oslo metropolitan regions independently of administrative borders by using GIS methodology and investigated the background local conditions, planning objectives and policy instruments. This study brings new information on the characteristics and underlying factors of Nordic urbanization with two case regions, both of which share similar premises (the size of population, overall societal conditions), but whose development has been steered in a different manner.
The main difference in the urban densities of the two regions is that the structure of the Helsinki region is more decentralized in terms of population and jobs. The densification of the Oslo region started already in the 1980s: a decade with the most intense decline in the population density of the Helsinki region. According to a previous study (Tiitu Citation2018), the urban expansion of the Helsinki region in terms of developed land area in 2000–2012 was most widespread in the peri-urban area and its car-oriented locations. Until 2010s, urban sprawl in the Helsinki region continued irrespective of the policies promoting coherent or solid urban form. The morphological cities apart from Helsinki have not started to densify even in the 2010s. The planners of the cities of Hyvinkää and Lohja were interviewed about the consolidation of urban form in the 2000s (Maijala and Sairinen Citation2009). The interviewees found several reasons for unsuccessful consolidation: the land ownership conditions, different dwelling preferences compared to the supply of housing, the costs of construction (densification requires more purifying of polluted land) and the lack of support from decision-makers. In addition, the Finnish concept of consolidating urban form had negative associations: ‘consolidation’ was seen as resulting in unpleasant, dense areas with social problems, high noise levels, and so forth (Maijala and Sairinen Citation2009). In the 2010s, the infill development of cities has become a popular topic, especially within the context of the emerging new urbanism concept in Helsinki, as exemplified by, for example, the new master plan (Kortteinen and Vaattovaara Citation2018). In addition, urban living has gained in popularity among Finnish citizens (Strandell Citation2017).
Unlike the Oslo region, in the Helsinki region, compact city policies have long been accompanied by objectives of polycentricity both at municipal and regional planning. However, the actual content of ‘polycentric development’ remains vague and scale-dependent (e.g. Davoudi Citation2003), which may result in inconsistencies in planning urban development at multiple scales. Granqvist, Sarjamo, and Mäntysalo (Citation2019) exemplify the different ‘spatial imaginaries’ of polycentricity with the conflict that aroused by the intention to transform all arterial motorways into city-boulevards in the new master plan of Helsinki (2016). The plan seemingly aligned with the polycentricity goals, to which all the municipalities had committed to in both statutory regional and non-statutory city-regional plans. However, various actors of the region at different planning scales criticized the boulevards for working against the goal of polycentric development, and finally Regional Administrative Court overruled four out of seven boulevards of the plan (Granqvist, Sarjamo, and Mäntysalo Citation2019). Granqvist, Sarjamo, and Mäntysalo (Citation2019) argue that the weak institutionalization of city-regional planning has afforded a strategic leeway to individual municipalities to ‘forward their own land use interests under the seemingly shared imaginary of polycentricity’. Depending on the conception and implementation of polycentricity, it is not evident whether polycentric urban form is worth pursuing to promote sustainable mobility. Polycentric urban form has been argued to increase the proportion car travel compared to inner-city densification (e.g. Schwanen, Dieleman, and Dijst Citation2001; Næss et al. Citation2019a, Citation2019b).
The policy instruments that have been used to steer urban development in the Oslo region, but not (yet) in the Helsinki region, include, for example, traffic regulation (road pricing) and an urban growth boundary. In Oslo, the Marka border has limited urban expansion and boosted brownfield transformation projects. Similar experiences have been identified in, for example, England (Baing Citation2010). In some Western cities, greenbelt policies have not had the desired impacts on city region development (Jun Citation2008; Miller and Amati Citation2008). However, no universal greenbelt concept exists that is applicable to every city region. The policy must be adjusted to fit local circumstances and be flexible enough to accommodate changing conditions (Lee Citation1999; Kühn and Gailing Citation2008). Whether using an urban growth boundary would have prevented urban sprawl in the Helsinki region remains an open question, but it is one of the tools that could be used to steer development in the future. Tools to steer urban sprawl may still be needed, particularly since some scholars have stated that the densification of the Helsinki region might have mainly been due to the exceptionally long and difficult downswing of the economy and that such urban sprawl might well continue with a strengthening economy (Kortteinen and Vaattovaara Citation2018).
The Oslo region invested more heavily in its public transport infrastructure in the urban core areas at an earlier point than did Helsinki. The inner municipalities of the Helsinki region have only in the 2010s begun to heavily invest in rail-based public transport infrastructure, which has been simultaneous with a growing political shift favouring infill development (City of Helsinki Citation2016). In the Oslo region, improving public transport systems has been a strategy for a long time. This implies that infrastructure investments must be in line with strategies for densification. However, although Oslo has for a long time had a metro and good commuter train connections (along with tramcars and buses, which Helsinki too has), we cannot know for sure whether Oslo’s densification would also have occurred in the absence of the metro. It could also be phrased in the opposite way: if Helsinki and the state of Finland had not made large investments in automobile-oriented infrastructure, urban sprawl would probably have been less extensive.
Based on our empirical analysis, the spatial distribution of jobs is more dispersed in the Helsinki region compared to Oslo. In a comparative study between Stockholm and Helsinki, Söderström, H. Schulman, and Ristimäki (Citation2015) also found that in the 2000s, many of the jobs in the Helsinki region were positioned in car-oriented locations outside subcentres. One possible reason for this is taxation: in Finland, half of the income from corporation tax is channelled to municipalities, whereas in Sweden all the tax proceeds go to the state (Söderström, H. Schulman, and Ristimäki, Citation2015). This means that the municipalities were not competing in attracting companies within their borders, and the workplaces could be positioned in sustainable urban nodes regardless of the municipality. In Copenhagen, the new Finger Plan 2007, has been devised with sharpened regulation of the scheduling of development within areas set aside for urban development and with priority given to areas close to stations (Næss et al. Citation2011b). As a result, the pace of densification has been considerable during the last decade.
6. Conclusions
Our spatial analysis of the Oslo and Helsinki metropolitan regions revealed that despite the Nordic location and similar population size, the development of urban densities of Oslo and Helsinki regions has been very different. The densification in the Oslo region began in the 1980s, whereas the Helsinki region only started to densify in the 2010s, still mostly having lower densities and more dispersed workplace structure. The development of densities reflects different planning objectives in the two regions; strong compact city policies in Oslo, and weaker political steering with more focus on polycentricity in the Helsinki region. In addition to multiple-scale planning objectives and regulations, the development of urban density is a result of a complex mixture of physical, cultural, economic and demographic factors. In the Helsinki region, the densities increased particularly when the densification policies and economic downturns coexisted. However, in the morphological city of Helsinki, the densification has not been shown to decline despite the strengthening economy. In the Oslo region, high economic growth has been accompanied with densification for decades.
It would be important to further investigate the causal relationships between different policy instruments and their effects on urban structures in Nordic cities. In addition, it is probable that a city region catching up in terms of urbanization can benefit from lagging development by learning from others’ mistakes and by picking up the most effective policy instruments from other cities that have densified earlier. Which particular policy instruments should be selected for approaching sustainable urban form in different political, cultural and physical contexts still needs to be investigated.
Acknowledgements
Writing of this article has been funded by the Strategic Research Council (SRC) at Academy of Finland (BeMInE, project number 303556, and STYLE, project number 320402). Authors would like to thank Fitwi Wolday for pre-processing the data on Norwegian workplaces.
Disclosure statement
No potential conflict of interest was reported by the author(s).
Additional information
Funding
Notes
1 Statistics Norway changed their urban area demarcation criteria in 2013. In the present study, the area sizes prior to 2013 have been corrected by reducing the area size figures by the percentage of difference between the 2013 and 2012 measurements, adjusted for the estimated real urban settlement area growth from 2013 to 2013. The latter was estimated based on the mean annual changes from 2008 to 2012 and from 2013 to 2016.
2 The figures before 2000 are somewhat uncertain and may have exaggerated the density increase during that period to some extent.
References
- Baing, A. 2010. “Containing Urban Sprawl? Comparing Brownfield Reuse Policies in England and Germany.” International Planning Studies 15 (1): 25–35. doi:10.1080/13563471003736910.
- Beatley, T. 2000. “Preserving Biodiversity: Challenges for Planners.” Journal of the American Planning Association 66: 5–20. doi:10.1080/01944360008976080.
- Breheny, M. 1995. “The Compact City and Transport Energy Consumption.” Transactions of the Institute of British Geographers 20 (1): 81–101. doi:10.2307/622726.
- Bruegmann, R. 2005. Sprawl: A Compact History. Chicago: Chicago University Press.
- Champion, T. 2001. “Urbanization, Suburbanization, Counterurbanization and Reurbanization.” In Handbook of Urban Studies, edited by R. Paddison, 143–161. London/Thousand Oaks/New Delhi: Sage.
- City of Helsinki. 2002. Helsingin yleiskaava. Selostus (in Finnish). Helsingin kaupunkisuunnitteluviraston julkaisuja 2002:17. Accessed 7 July, 2020. https://www.hel.fi/static/ksv/www/YK2002_selostus 1.pdf
- City of Helsinki. 2012. Helsingin yleiskaavan lähtökohdat ja työohjelma 13.11.2012 (in Finnish). Helsingin kaupunkisuunnitteluviraston yleissuunnitteluosaston selvityksiä 2012:2. Accessed 7 July, 2020. https://www.hel.fi/hel2/ksv/julkaisut/yos_2012-2.pdf
- City of Helsinki. 2016. The Master Plan of Helsinki. City Plan – the New Master Plan of Helsinki (in Finnish). Reports of City Planning Department of Helsinki 2016:3, City of Helsinki, Finland. Accessed 19 September, 2019. https://www.hel.fi/hel2/ksv/liitteet/2018_kaava/YK_2016_Selostus_20160614_LISALEHDELLA.pdf
- City of Helsinki. 2018. The Carbon-Neutral Helsinki, 2035 Action Plan. City of Helsinki / Publications of the central administration. Accessed 27 September, 2019 from. https://www.hel.fi/static/liitteet/kaupunkiymparisto/julkaisut/julkaisut/HNH-2035/Carbon_neutral_Helsinki_Action_Plan_1503019_EN.pdf
- Czepkiewicz, M., J. Ottelin, S. Ala-Mantila, J. Heinonen, K. Hasanzadeh, and M. Kyttä. 2018. “Urban Structural and Socioeconomic Effects on Local, National and International Travel Patterns and Greenhouse Gas Emissions of Young Adults.” Journal of Transport Geography 68: 130–141. doi:10.1016/j.jtrangeo.2018.02.008.
- Davoudi, S. 2003. “Polycentricity in European Spatial Planning: From an Analytical Tool to a Normative Agenda’.” European Planning Studies 11: 979–999. doi:10.1080/0965431032000146169.
- Davoudi, S. 2008. “Conceptions of the City Region: A Critical Review.” Proceedings of the Institution of Civil Engineers - Urban Design and Planning 161 (2): 51–60. doi:10.1680/udap.2008.161.2.51.
- Du, S., P. Shi, and A. van Rompaey. 2014. “The Relationship between Urban Sprawl and Farmland Displacement in the Pearl River Delta, China.” Land 2014 (3): 34–51. doi: 10.3390/land3010034.
- Dysterud, M., and E. Engelien. 2000. Tettstedsavgrensing. Teknisk dokumentasjon 2000. Working Paper 2000/69. Oslo and Kongsvinger: Statistics Norway.
- EEA (European Environment Agency). 2006. Urban Sprawl in Europe: The Ignored Challenge. EEA report no. 10/2006. Copenhagen: European Environmental Agency.
- EEA (European Environment Agency). 2016. Urban Sprawl in Europe. Luxembourg: EEA Report Vol. 11. European Enviroment Agency EEA and Federal Office for the Environment FOEN.
- Engebretsen, Ø. 1993. Arealbruk i tettsteder 1955–1992. TØI Report 177/1993. Oslo: Institute of Transport Economics.
- Engebretsen, Ø, and A. Gjerdåker. 2012. Potensial for regionforstørring. TØI Report 1208/2012. Oslo: Institute of Transport Economics.
- Eurostat. 2020. Employment - Annual Statistics. Accessed 26 June, 2020. https://ec.europa.eu/eurostat/statistics-explained/index.php/Employment_statistics
- Faludi, A., and A. Van der Valk. 1994. Rule and Order: Dutch Planning doctrine in the 20th Century. Dordrecht: Klüver.
- Finnish Environment Institute. 2017. Yhdyskuntarakenteen vyöhykkeet 2017 (Travel-Related Urban zones 2017) Accessed 20 May, 2019. http://metatieto.ymparisto.fi:8080/geoportal/catalog/search/resource/details.page?uuid=%7BB374BBB2-1EDF-4CF6-B11B-04E0017E9A26%7D
- Finnish Environment Institute. 2019. Delineation of Localities (Densely Populated Areas). Accessed 20 May, 2019. https://www.ymparisto.fi/en-US/Living_environment_and_planning/Community_structure/Information_about_the_community_structure/Delineation_of_densely_populated_areas
- Granqvist, K., S. Sarjamo, and R. Mäntysalo. 2019. “Polycentricity as Spatial Imaginary: The Case of Helsinki City Plan.” European Planning Studies 27 (4): 739–758. doi:10.1080/09654313.2019.1569596.
- Guastella, G., W. Queslati, and S. Pareglio. 2019. “Patterns of Urban Spatial Expansion in European Cities.” Sustainability 11 (11): 2247. doi:10.3390/su11082247.
- Hajer, M. 1995. The Politics of Environmental Discourse - Ecological Modernisation and the Policy Process. Oxford: Oxford University Press.
- Hall, P. 1971. “Spatial Structure of Metropolitan England and Wales.” In Spatial Policy Problems of the British Economy, edited by M. Chisholm, and G. Manners, 96–125. Cambridge: Cambridge University Press.
- Hanssen, G., H. Hofstad, and I. Saglie, eds. 2015. Kompakt byutvikling – muligheter og utfordringer. Oslo: Universitetsforlaget.
- Helsinki Region Transport. 2019. MAL 2019: Land Use, Housing and Transport Plan 2019 Summary report. Accessed 6 November, 2019. https://www.hsl.fi/mal/julkaisut
- Helsinki-Uusimaa Regional Council. 2007. Uudenmaan maakuntakaava. Selostus (in Finnish). Uudenmaan liiton julkaisuja A 17 - 2007. Accessed 22 May, 2020. https://www.uudenmaanliitto.fi/files/6099/Uudenmaan_maakuntakaava_selostus.pdf
- Hoftun, S. 2002. “The Emergence of a Sustainable Urban Form: - A Study of the Different Factors Influencing What is Considered the Best Strategy for Urban Sustainability in Norway.” M.Sc. diss., University of Oslo/Aalborg University.
- Hytönen, J., R. Mäntysalo, L. Peltonen, V. Kanninen, P. Niemi, and M. Simanainen. 2016. “Defensive Routines in Land Use Policy Steering in Finnish Urban Regions.” European Urban and Regional Studies 23 (1)): 40–55. doi:10.1177/0969776413490424.
- Jun, M. 2008. “Are Portland’s Smart Growth Policies Related to Whom it May Concern: Reduced Automobile Dependence?” Journal of Planning Education and Research 28: 100–107. doi:10.1177/0739456X08319240.
- Juvkam, D. 2002. Inndeling i bo- og arbeidsmarkedsregioner. Rapport 2002:20. Oslo: Norwegian Institute for Urban and Regional Research.
- Kortteinen, M., and M. Vaattovaara. 2018. “A New Turn in the Development of the Region? Future Perspectives on the Settlement and Planning in the Helsinki Region.” In Confused Suburban Identities: A Case Study of Helsinki Region. Urban Studies and Planning / Master’s Programme of Urban Academy in Helsinki, edited by A. Joutsinniemi, H. Linkola, M. Puttonen, K. Swan, and M. Vaattovaara, 237–243. Helsinki: Urban Studies and Planning/Master's Programme of Urban Academy in Helsinki. Aalto University and University of Helsinki.
- Kühn, M., and L. Gailing. 2008. “From Green Belts to Regional Parks: History and Challenges of Suburban Landscapes of Berlin.” In Urban Green Belts in the Twenty-First Century, edited by M. Amati, 185–202. Hampshire and Burlington: Ashgate.
- Lee, C. 1999. “An Intertemporal Efficiency Test of a Greenbelt: Assessing the Economic Impacts of Seoul’s Greenbelt.” Journal of Planning Education and Research 19 (1): 41–52. doi:10.1177/0739456X9901900104.
- Maijala, O., and R. Sairinen. 2009. “Eheyttämisen toimintapolitiikka [The Policy of Consolidation].” In Yhdyskuntarakenteen eheyttäminen ja elinympäristön laatu. Yhdyskuntasuunnittelun tutkimus- ja koulutuskeskuksen julkaisuja B 96, edited by R. Sairinen, 231–265. Espoo: Teknillinen korkeakoulu.
- Martamo, R. 1995. Distance between Workplace and Residence in Finland (in Finnish). Helsinki: Miljöministeriet, Markanvändingsavdelningen.
- Mäntysalo, R., J. Kangasoja, and V. Kanninen. 2015. “The Paradox of Strategic Spatial Planning: A Theoretical Outline with a View on Finland.” Planning Theory & Practice 16 (2): 169–183. doi:10.1080/14649357.2015.1016548.
- Miller, C., and M. Amati. 2008. “The Green Belt That Wasn’t: The case of New Zealand from 1910 to the 1990s.” In Urban Green Belts in the Twenty-First century, edited by M. Amati, 83–104. Hampshire and Burlington: Ashgate.
- Ministry of the Environment. 2017. Government Decision on Finland’s National Land Use Guidelines. Issued on 14 December 2017. Accessed 22 May, 2019. www.ymparisto.fi/vat
- Municipality of Oslo. 2019. Folkemengde, ti soner. Oslo: Municipality of Oslo, Statistikkbanken. Accessed March, 2019 http://statistikkbanken.oslo.kommune.no
- Mustafa, A., and J. Teller. 2020. “Self-Reinforcing Processes Governing Urban Sprawl in Belgium: Evidence Over Six decades.” Sustainability 12 (12): 4097. doi:10.3390/su12104097.
- Næss, P. 1981. Boligbygging i Marka? Oslo og Omland Friluftsråd, Oslo.
- Næss, P., T. Næss, and A. Strand. 2009. The Challenge of Sustainable Mobility in Urban Planning and Development in Oslo Metropolitan Area, 47–53. TØI Report 1024/2009. Oslo: Institute of Transport Economics.
- Næss, P., T. Næss, and A. Strand. 2011a. “Oslo’s Farewell to Urban Sprawl.” European Planning Studies 19 (1): 113–139. doi:10.1080/09654313.2011.530395.
- Næss, P., T. Næss, A. Strand, and M. Nicolaisen. 2011b. “On Their Road to Sustainability? The Challenge of Sustainable Mobility in Urban Planning and Development in Two Scandinavian Capital Regions.” Town Planning Review 82 (3): 285–316. doi:10.3828/tpr.2011.18.
- Næss, P., A. Strand, F. Wolday, and H. Stefansdottir. 2019a. “Residential Location, Commuting and Non-Work Travel in Two Urban Areas of Different Size and with Different Center Structures.” Progress in Planning 128: 1–36. doi:10.1016/j.progress.2017.10.002.
- Næss, P., A. Tønnesen, and F. Wolday. 2019b. “How and Why Does Intra-Metropolitan Workplace Location Affect Car Commuting?” Sustainability 11: 1196. doi:10.3390/su11041196.
- Newman, P., L. Kosonen, and J. Kenworthy. 2016. “Theory of Urban Fabrics; Planning the Walking, Transit/Public Transport and Automobile/Motor Car Cities for Reduced Car Dependency.” Town Planning Review 87 (4): 429–458. doi:10.3828/tpr.2016.28.
- OECD. 2007. OECD Territorial Reviews: Norway. Paris: OECD Publishing.
- OECD. 2012. Compact City Policies: A Comparative Assessment. Paris: OECD Green Growth Studies, OECD Publishing.
- Onsager, K., and T. Selstad, eds. 2004. Regioner i utakt. Trondheim: Tapir akademisk forlag.
- OSF (Official Statistics of Finland). 2019. Dwellings and Housing Conditions [e-publication]. ISSN=1798-6761. Helsinki: Statistics Finland. Accessed 14 May, 2020. http://www.stat.fi/til/asas/2019/asas_2019_2020-05-20_tie_001_en.html
- Population Register Centre. 2018. Building Information. Accessed 14 May 2019. Population Register Centre http://vrk.fi/en/building-information
- Riksrevisjonen. 2007. Riksrevisjonens undersøkelse av bærekraftig arealplanlegging og arealdisponering I Norge (Dokument nr. 3:11 (2006–2007)). Oslo: Norwegian National Auditing Office.
- Ristimäki, M., H. Kalenoja, and M. Tiitu. 2011. Travel-Related Zones of Urban Form – Zone Criteria, Urban form Statistical Profiles, and Travel Habits (in Finnish). Publications of the Ministry of Transport and Communications, Vol. 15. Helsinki: Ministry of Transport and Communications.
- Ristimäki, M., M. Tiitu, H. Kalenoja, V. Helminen, and P. Söderström. 2013. Travel-Related Urban Zones in Finland – the Development of Pedestrian, Transit and Car-Oriented Zones from 1985 to 2010 (in Finnish). Reports of the Finnish Environment Institute 32/2013. Helsinki: Finnish Environment Institute.
- Schwanen, T., F. Dieleman, and M. Dijst. 2001. “Travel Behavior in Dutch Monocentric and Polycentric Urban Systems.” Journal of Transport Geography 9 (3): 173–186. doi:10.1016/S0966-6923(01)00009-6.
- Söderström, P., H. Schulman, and M. Ristimäki. 2015. Urban form in the Helsinki and Stockholm City Regions - Development of Pedestrian, Public Transport and Car Zones. Reports of the Finnish Environment Institute, 16/2015. Helsinki: Finnish Environment Institute. http://hdl.handle.net/10138/155224
- Statistics Norway. 2018. Kart og geodata. Accessed 7 January, 2019. https://www.ssb.no/natur-og-miljo/geodata
- Statistics Norway. 2019. Areal og befolkning i tettsteder, etter tettsted, tid og statistikkvariabel. Oslo/Kongsvinger: Statistics Norway. Accessed 3 March, 2019. https://www.ssb.no/statistikkbanken
- Statistics Norway. 2020. Families and Households. Accessed 14 May, 2020. https://www.ssb.no/en/statbank/table/06076/
- Strandell, A. 2017. Residents’ Barometer 2016 – Residents’ Survey on Residential Environments in Finland (in Finnish). Reports of the Finnish Environment Institute, 19/2017. Helsinki: Finnish Environment Institute. http://hdl.handle.net/10138/193009
- Tiitu, M. 2018. “Expansion of the Built-Up Areas in Finnish City Regions – The Approach of Travel-Related Urban Zones.” Applied Geography 101: 1–13. doi:10.1016/j.apgeog.2018.10.001.
- TOBIAS, No. 3. 1998. Information Magazine from the Municipal Archives of Oslo. Accessed June 2020. https://www.oslo.kommune.no/OBA/tobias/pdf_arkiv/Tob1998-3.PDF
- van Den Berg, L., L. Burns, and L. Klaassen, eds. 1987. Spatial Cycles. Aldershot: Gower.
- YKR. 2019. Finnish Monitoring System of Spatial Structure and Urban Form. Helsinki: Finnish Environment Institute (SYKE) and Statistics Finland.