
ABSTRACT
Progress in implementing circular solutions in European regions has so far been limited. This is partly due to the multifaceted territorial contexts characterizing the continent. Ultimately, the understanding of territorial dynamics is key to envisage a successful transition to a circular economy (CE). However, CE discussion from a regional standpoint is still limited and CE frameworks that can be applied to monitor and measure the CE potential in a specific territory remain at a rather theoretical level. This paper contributes to this research gap by (1) presenting a regional monitoring framework across three case studies; (2) analysing the respective territorial patterns from a CE perspective. The three case studies include the central cross-border Scandinavian area, Switzerland and Liechtenstein, and the Duchy of Luxembourg. The results reveal that circular initiatives are generally designed on the basis of available local resources and, depending on these, regional strategies seek to optimize the technical and/or biological cycles of local economies. Furthermore, the increasing levels of waste generation observed in all case studies challenge traditional waste policy approaches, generally centred on end-of-life management, in favour of more ambitious initiatives aimed at optimizing use of resources and preventing waste.
1. Introduction
The transition to a circular economy (CE) is increasingly seen as a supportive instrument to develop a sustainable, low carbon, resource efficient and competitive economy (European Commission Citation2020; Hartley, van Santen, and Kirchherr Citation2020; Mayer et al. Citation2019). A CE aims to preserve the natural resources of the environment while limiting waste production and energy consumption. At the same time, it offers the opportunity to lift local economies by creating new circular-oriented jobs and new markets for secondary raw materials (Ghisellini, Cialani, and Ulgiati Citation2016; Korhonen et al. Citation2018; Lahti, Wincent, and Parida Citation2018). Since 2014, the European Commission (EC) has actively supported the CE concept at various operations levels (European Commission Citation2014, Citation2020), also defining a CE monitoring framework to monitor the progress of the CE implementation at EU and country levels (European Commission Citation2018). This CE monitoring framework consists of 10 main indicators and several sub-indicators, addressing four main thematic areas: production and consumption, waste management, secondary raw materials, and competitiveness and innovation around CE businesses.
Unfortunately, national or supranational monitoring schemes like the one promoted by the EC are very often not suitable for regional and local policy makers for two reasons. First of all, national statistics often give a picture that is very distant from the territorial realities with which local authorities have to deal with (Avdiushchenko Citation2018; Bianchi, del Valle, and Tapia Citation2020). Understanding and knowing territorial metabolism is fundamental for the design of CE strategies, since they have an obvious spatial expression (Bahers, Durand, and Beraud Citation2017; Bassi et al. Citation2020). As an example, Tapia et al. (Citation2021) identified six main territorial factors – meant as spatially bound assets – having higher relevance from a CE perspective. These factors are: (1) land-based resources, (2) agglomeration factors, (3) accessibility conditions, (4) technical and technological capacity, (5) knowledge-related factors, (6) governance and institutional drivers. Similarly, Gonçalves, Galliano, and Triboulet (Citation2021) distinguish between place-based and extra-local factors. The first are local resources such as natural resource endowments, technological strengths and industrial composition, while the latter refer to institutional environments, i.e. public policies and regulations at different levels. It becomes clear that local authorities should identify and prioritize certain CE initiatives depending on the local availability of resources (Bačová et al. Citation2016; Dąbrowski, Varjú, and Amenta Citation2019; Heshmati and Rashidghalam Citation2021). In this context, national monitoring frameworks can offer limited help. The second reason concerns the scarcity of data generally affecting subnational contexts, which makes it rather difficult to replicate the indicators proposed at the national level (Avdiushchenko and Zając Citation2019; ESPON CIRCTER Citation2019).
Efforts have recently been made to develop and improve monitoring frameworks at the regional level. As an example, Avdiushchenko (Citation2018) provides a conceptual framework for evaluating key aspects of CE-based regional development, Smol, Kulczycka, and Avdiushchenko (Citation2017) propose a set of CE indicators at the regional level in relation to eco-innovation, while Elia, Gnoni, and Tornese (Citation2017) provide a list of macro-, meso-, and micro- indicators for the CE. Although these efforts have significantly contributed to the conceptual development of regional monitoring schemes, it is also true they remain at a purely theoretical level since they have not been applied in practice. Contrarywise, the few existing empirical applications generally rely on ad-hoc indicator schemes based on the availability of data for the areas under investigation (see for example Scarpellini et al. (Citation2019) for the Spanish region of Aragon, or Avdiushchenko and Zając (Citation2019) for the Polish region of Malopolska).
This situation has largely prevented carrying out comparative research between regions of different countries. Comparative research is critical for enhancing territorial development as it allows researchers to (1) learn from planning activities in different contexts and (2) develop an understanding of common planning problems (Bolger and Doyon Citation2019; Dąbrowski, Varjú, and Amenta Citation2019). This article addresses this research gap by exploring the territorial dimensions of CE with the aid of a CE monitoring framework applied to three regional case studies. Specifically, the article poses the following research questions:
How and which CE indicators can be used at the regional level to compare CE-related aspects, based on data available for European regions (NUTS 2 levelFootnote1)?
How the analysis of territorial evidences based on CE indicators at the regional level can inform CE policy planning?
What are the implications for a better selection and interpretation of CE indicators?
The article is structured as follows: Section 2 ‘Materials and methods’ introduces the case studies and the regional CE monitoring framework used in this research, including selected indicators and their description, data sources, and their relation with the CE. Section 3 reports the results of the application of the monitoring framework across three illustrative case studies, in particular highlighting territorial opportunities and constraints for progressing towards a CE. Finally, Section 4 discusses and summarizes policy contributions of the study and provides orientation for further research.
2. Materials and methods
2.1. Case studies
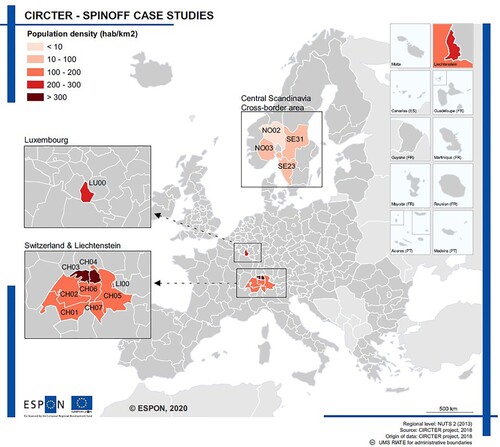
This work is mainly based on the results obtained from the CIRCTER ‘SPIN-OFF’ projectFootnote2 (ESPON CIRCTER Citation2019). Within the project, three case studies were analysed from a territorial perspective to understand barriers, opportunities and policy implications for a transition towards more circular production and consumption systems. These are (see ): (1) the central cross-border Scandinavian area, which includes West Sweden (SE23) and North Middle Sweden (SE31) on the Swedish side and Innlandet (NO02) and Viken (NO03) regions on the Norwegian side; (2) the Switzerland and Liechtenstein area (CH-LI); and (3) the Grand Duchy of Luxembourg (LU00).
Figure 1. Overview of the three regional case studies analysed in this article. Note: GEO NUTS 2 code: Innlandet (NO02), Viken (NO03), West Sweden (SE23), North Middle Sweden (SE31), Luxembourg (LU00), Switzerland (CH00), Lake Geneve region (CH01), Espace Mitteland (CH02), Northwestern Switzerland (CH03), Zurich (CH04), Eastern Switzerland (CH05), Central Switzerland (CH06), Ticino (CH07), Liechtenstein (LI00).
Despite having similar socioeconomic characteristics like high productivity, innovation and social well-being, these case studies exhibit very different territorial characteristics. For example, the highly urbanized region of Luxembourg relies almost exclusively on imports, while the sparsely populated areas of the central Scandinavia are very rich in natural resources. In this line, they represent interesting testbeds to apply a CE monitoring framework and understand how different territorial patterns can inform policy design. In addition, all the case studies are cross-border areas characterized by significant commuting flows, a critical aspect to consider for a correct interpretation of material and waste flow patterns.
It should also be noted that as the purpose of this article is to present a comparative research based on a harmonized CE monitoring framework, we limit ourselves to present and interpret only the indicators available across all the three regions. However, the results presented here are part of a larger research work in which each case study has been thoroughly analysed. In particular, alongside the territorial analysis based on a compilation of current and historical statistical data available, various strategic and regional planning documents have been revised, focusing on waste management and other relevant CE issues. In this context, this review was instrumental in validating the evidence emerging from the monitoring scheme in terms of priorities and strategic objectivesFootnote3 (Sánchez Levoso et al. Citation2020). Readers can refer to the supplementary material S1 for the list of all policy documents consulted, while for a comprehensive overview of the case studies they can refer to the respective technical reportsFootnote4 (ESPON CIRCTER Citation2019).
2.2. Regional CE monitoring scheme
A CE monitoring scheme was used to compare the three case studies. The proposed CE monitoring scheme includes CE-related indicators publicly available at the regional level that can be used for comparative analyses, i.e. data are harmonized and available for most of European regions (NUTS-2). The indicators were selected:
Considering the recent theoretical frameworks proposed for regional approaches, in particular by Avdiushchenko (Citation2018) and Smol, Kulczycka, and Avdiushchenko (Citation2017), and current international CE monitoring frameworks (ESPON CIRCTER Citation2019; European Commission Citation2018);
Checking in existing databasesFootnote5 the current availability of indicators for each aspect of evaluation.
provides an overview of the selected indicators, together with the existing studies or monitoring schemes that endorse the indicators, and the respective data sources. Note that the table only provides ‘aggregated’ indicators, i.e. it does not specify sub-indicators focusing on specific material/activity types (e.g. biomass consumption or type of waste treatment), which are instead provided in the results section (see ).
Table 1. Regional (NUTS-2) indicators used in this work for the CE territorial analysis.
Table 2. Indicator results of the CE monitoring framework for selected regions (summary).
We organized the CE indicators in four main areas: socioeconomic characteristics, resource efficiency, waste generation and management and competitiveness and innovation around CE businesses.
The ‘socioeconomic characteristics’ category aims to describe economic development trajectories and social aspects of interest. In this context, GDP per capita, measured in units of purchasing power standard (PPS) per inhabitant, and GDP growth (%) are indicators generally used to measure the prosperity level of an economy (Su et al. Citation2013). Employment rate and population density (habitant per square kilometre) inform on the social dimensions of territories, while location quotients (LQ), which are indexes measuring the economic specialization of a territory compared to a benchmark, are used to describe the structure of an economy.Footnote6
The focus area of ‘resource efficiency’ concerns the CE requirement of reducing input and use of natural resources (Elia, Gnoni, and Tornese Citation2017; Su et al. Citation2013). In this context, the Economic Wide-Material Flow Accounting framework (EW-MFA) is generally employed to assess the metabolism of territories (Haas et al. Citation2015; Mayer et al. Citation2019), or in other words, to investigate the relationship between the economy and the amount of natural resources that it consumes. Its main limitation lies in the fact that EW-MFA provides information about the quantity of materials actually ‘consumed’ (i.e. the weight of traded goods) and it does not consider the so-called hidden flows, i.e. the resources that are used upstream to produce a certain good (Wiedmann et al. Citation2015). In general, EW-MFA data are only collected at national basis under the regulation (EU) 691/2011 on European environmental economic accounts. However, recent advances in statistical downscaling techniques can provide sufficiently robust EW-MFA estimates for regional comparative purposes (Bianchi, Tapia, and del Valle Citation2020; ESPON CIRCTER Citation2019; Horta and Keirstead Citation2017).
Selected ‘resource efficiency’ indicators are: Domestic Material Consumption (DMC) per capita, which measures the amount of material consumed by a local economy per inhabitant (thousand tonnes/hab); Material intensity (i.e. DMC/GDP), which measures the amount of material required to generate one unit of GDP (kg/euro); Domestic Extraction (DE) per capita, which measures the amount of natural resource extracted from a territory per inhabitant (thousand tonnes/hab). DMC is also monitored in terms of change of DMC per capita, and disaggregated by the following material types: biomass, non-metallic minerals, metal ores.
Since a circular economy should strive for reducing the use of primary raw materials and for retaining value of materials in the economy, decreasing patterns of these indicators would be desirable, as this would possibly imply using less materials to achieve the same level of economic wealth and reducing environmental harms related to the direct consumption of resources (e.g. extraction and processing activities).
The ratio DE/DMC informs instead on the type of regional economy and the reliance on local natural resource or, conversely on imported goods. Therefore, a ratio below 100% would suggest a territory scarce in natural resources and, eventually, relying on imports from foreign countries. Contrarywise, a DE/DMC ratio higher than 100% would reflect a territory rich in natural resources, where material consumption is mainly due to the extraction and refining of raw materials to meet foreign demand.
‘Waste generation and management’ is the area addressing the CE requirement of ‘reducing valuable material losses’ (Elia, Gnoni, and Tornese Citation2017). The CE indicators include total waste generation (excluding major mineral waste) measured in kg per capita; waste intensity, which measures the kilograms of waste generated per thousand euro in PPS; the ratio waste generation/DMC, which is expressed in percentage (%) – as both terms are measured in the same unit (tonnes) – and it monitors the efficiency of regional material consumption by comparing the tonnes of waste generated to DMC; the generation of municipal solid waste (MSW) per capita (kg/hab); and the respective MSW shares for recycling and composting, incineration and landfilling.
Few remarks should be said on the indicators of the waste focus area. First, we distinguish between ‘total’ waste and ‘municipal’ waste generation as they have different connotations. Total waste includes industrial waste, i.e. waste generated by economic actors. These types of waste flows are, in general, regulated by specific national or supranational law, and economic actors are generally responsible for the correct End-of-Life treatment. On the other hand, municipal waste consists of waste collected by or on behalf of municipal authorities and it consists mainly of waste generated by households, although it also includes similar waste from sources such as shops, offices and public institutions. Therefore, municipal waste generally better reflects the quality of waste management systems in place and its monitoring is particularly relevant for local authorities. Second, waste intensity and waste/DMC indicators are especially relevant within the circular economy framework as they respectively indicate the ability of territories to decrease the generation of waste associated with a certain economic output (in the first case) or material input (in the second case). These indicators are indexes of relative intensity of raw material and waste ‘pressures’ of an economy on the environment and they are also included in the CE monitoring framework used by the European Commission (European Commission Citation2018).
The last focus area addresses ‘competitiveness and innovation around CE businesses’ and includes indicators informing on current employment, turnover and innovations associated with CE related activities already installed in the territory (Avdiushchenko Citation2018; Burger et al. Citation2019; Scarpellini et al. Citation2019). Arguably, these are the most difficult type of indicators to obtain on a large scale at the regional level. In this context, the CIRCTER project represents a prominent attempt to provide turnover and employment figures linked to CE activities for most of the European regions. However, as these indicators are not available for all the case studies analysed in this study, we have excluded them from the results section. Nevertheless, the reader can find further information about them in the supplementary material S2.
3. Results
3.1. Regional territorial analysis
shows the indicator results of the proposed regional CE monitoring framework across the three case studies. For the Scandinavian and Swiss case study, due to space limitation, we only display the average of the whole area of interest. Notwithstanding, selected indicators were collected and analysed for each NUTS-2 region within the areas of interest. The whole dataset can be accessed in the supplementary material S2.
The three case studies feature similar socioeconomic characteristics, which situate the analysed regions among the best performing in terms of productivity, innovation, and social well-being in Europe. All of them have among the highest GPD per capita in Europe and present a prosperous and modern market economy with low unemployment and a highly skilled labour-force.
As for the urban layout, the case studies are excellent examples of opposite territorial configurations. Luxembourg is one of the most urbanized and dense country in Europe with 215 hab/km2, while the Scandinavian area is one of the most sparsely populated with 21 hab/km2. Switzerland is in an intermediate range with 195 hab/km2, although it must be considered that at a lower territorial level the Swiss regions go from highly agglomerated areas up to 800 hab/km2 (as in the case of the Zurich region) to areas with just 100 hab/km2 (as in the case of Eastern Switzerland region). The level of urban agglomeration, and thereby, the availability of space has direct implications on the economic activities carried out in a territory. In general, denser regions are typically areas where material intensive activities, such as primary and secondary transformations of raw materials, are more rarely conducted (Weisz et al. Citation2006). On the one hand, these areas have often undergone an initial territorial development based on the exploitation of local resources, which, with the passing of time, have run out. In parallel, the lack of space generally rises the price of land, driving out economic activities with low added value such as the primary and secondary sectors. This territorial dynamic is reflected in regional economic specializations. Sparsely populated areas such as Innlandet in Norway and North Middle Sweden are highly specialized in agriculture and mining, respectively. By contrast, highly populated areas such as Luxembourg or the Swiss region of Zurich went increasingly specializing in the service and financial sector.
Territorial configurations and regional economic structures also have direct effects on material efficiency patterns (Bianchi, del Valle, and Tapia Citation2021). The Scandinavian area is made up of regions that have among the highest values of DMC (26.04 t/hab) and DE (35.31 t/hab) per capita in Europe. As the area relies mainly on resources mined domestically, the DE-to-DMC ratio is also among the highest in Europe (136%). The high availability of natural resources and space (all regions are sparsely populated) make the Scandinavian area a suitable place for primary and secondary activities, especially forestry and mining. This sectoral specialization on material-intensive, low added value economic activities also affect DMC intensity, which is, again, among the highest at European level (0.85 kg/euro).
Luxembourg and Swiss regions do not count with significant natural resources. This, in turn, limits the DE (4.02 t/hab for LU and 8,07 t/hab for CH-LI, respectively), and makes these areas principally relying on imported goods and imported raw materials. In the case of Luxembourg, the observed gap between the materials consumed by the domestic economy and the resources extracted from the territory is filled by significant imports, of which building material and metal ores are the largest inflows. Interestingly, the per capita DMC in Luxembourg appears to be among the highest in Europe (> 20 t/hab). This is somewhat an exception to European regional consumption patterns, which generally position service-based urban regions at the bottom of the per capita material consumption rankings (Bianchi, del Valle, and Tapia Citation2020). A closer look reveals that the Luxembourg economy relies heavily and increasingly on cross-border commuters (PNGD Citation2018). These are equivalent to 30% of the resident population and, approximately, to the 42% of the total workforce in Luxembourg. Although cross-border commuters generally spend most of the day in Luxembourg, thus clearly contributing to material consumption and waste production, they are not accounted for in the indicator, as they are not part of the resident population. As a result, territories characterized by significant commuting in-flows like Luxembourg or several regions of Switzerland, as well as Liechtenstein, may exhibit exceptionally higher material consumption per capita figures.
Regarding waste indicators, all case studies generate total waste per capita above European average (∼1000 kg/hab). In particular, Switzerland is the area that produces the largest quantities for both categories, total waste (2246 kg/hab) and MSW (729 kg/hab). This is true even though Switzerland is one of the European countries with the longest tradition in waste management policies and with a very efficient collection and recycling system in place. Indeed, the high Swiss waste generation rates are accompanied by recycling rates among the highest in Europe, i.e. 53%. It should also be noted that, while the total per capita waste seems to stabilize or even decrease over time, the amount of MSW is still rising, and, to a large degree (about 50%) directed to incineration facilities, in all case studies. On the positive side, landfilling seems to be a treatment option progressively phased-out and already banned in Switzerland.
Waste intensity indicators reflect the picture anticipated by DMC intensity, that is regions having economies very tied with the processing of raw material, as Scandinavian regions, present higher waste intensity values compared to more dematerialized economies based on services. In this context, waste/DMC indicator might better inform on the real efficiency of consumption-production systems as it relates material consumption and waste generation. Indeed, according to this indicator, the Scandinavian area is the most efficient region followed by Luxembourg and Switzerland (note that the rank is opposite according to waste intensity).
3.2. Implications for regional CE policies and monitoring frameworks
Based on the previous analysis, summarizes key findings and recommendations for the design of CE policies and monitoring frameworks at the regional level. The following sections discuss in detail territorial opportunities and constraints of each case study to progress towards more circular production and consumption systems.
Table 3: Overview of key results of the territorial analysis
3.2.1. Luxembourg
The scarce availability of natural resources on the one hand, and the presence of strong agglomeration economies, know-how and technology capacity on the other hand can be seen as the leading and reinforcing territorial factors currently supporting the Luxembourg transition towards a CE. In particular, the flow of metal waste appears to be well on its way to closing the loop.
Luxembourg is one of the biggest traders of metal waste in Europe and its metallic waste imports, mostly concerning iron and steel waste, amounts to more than 2 billion tons yearly. These imports are roughly threefold the total waste generated in Luxembourg. Apparently, this territorial evidence is somehow misaligned with the EU indicator ‘circular material use’ (CMU) (Eurostat Citation2018), which assigns Luxembourg a rate of 4% well below the European average (11%). Closer analysis reveals that Luxembourg’s underperformance is mainly due to the way the CMU indicator is defined rather than Luxembourg circularity performance. The CMU indicator rewards the effort of countries to collect waste generated internally for recovery purposes (either internally or abroad), while it subtracts the import of waste. This perspective rewards countries efforts to ‘internally collect’ waste for recovery, but it neglects the efforts to ‘internally reuse’ secondary material into the economy. In the case of Luxembourg this omission is crucial as Luxembourg relies on huge inflows of metal residues to supply its manufacturing industry. If the CMU indicator were estimated according to the alternative perspective, which credits the ‘use’ of secondary material recovered from former waste (Eurostat Citation2018), Luxembourg would score 31%. In other words, 31% of the total processed material in Luxembourg comes from secondary materials.
Even though the steel sector remains a strong player, Luxembourg’s economy, similarly to other European regions, has increasingly transitioned to the tertiary sector. Industrial areas in transition deserve particular attention from a CE perspective as brownfields should be dismantled and either sold for reuse or recycled.Footnote7 Returning abandoned land and buildings back into the economic cycle can also be an effective way to reduce urban sprawl and its environmental impacts and to keep neighbourhoods occupied and vital (Esposito, Tse, and Soufani Citation2018).
Urbanized regions like Luxembourg, characterized by remarkable economic and demographic development, also have high needs in terms of jobs and housing. These basic needs, when coupled with land shortage, can favour speculation in the real estate sector. Higher value of land and properties can hold back the setting up of ‘low-value’ circular activities such as recycling industry, regenerative urban forestry or urban farming (Williams Citation2019). However, these activities are essential for the preservation of the value of local resources and supporting cohesion goals through, for example, the creation of jobs. Local authorities have a key role in ensuring that housing and the territory remain linked to their social and environmental functions. The various issues mentioned above, such as the recycling of contaminated land, uncontrolled urban sprawl and high house prices, have been integrated in an effective way in Luxembourg in the pioneering Belval project (Glumac and Decoville Citation2020).
3.2.2. Cross-border Scandinavia area
The Scandinavian case study is the example of a territory abundant in natural resources endowments. As indicated by EW-MFA and economic indicators, these assets translated in economic structures mainly specialized in material-intensive activities. DE and DMC per capita, as well as the DE-to-DMC ratio, are among the highest across European regions. Consequently, most of the Scandinavian regions are export-oriented, regularly trading raw materials such as metal ores and biomass (e.g. wood, agriculture and food products). These territorial endowments offer excellent conditions for the optimization of biological cycles and the area is already on the way to become a bioeconomy leader.Footnote8 However, a bioeconomy not necessarily represents a more sustainable option compared to business-as-usual scenarios (Kretschmer et al. Citation2013), especially considering the increasing trends concerning natural resources consumption of these areas. In this sense, the consideration of circular principles can help to ensure that available (renewable) biomass-based resources are used in a regenerative way and in cascade, or that organic waste, co-products and by-products are treated as resources for the economy (Sherwood Citation2020; Venkata Mohan, Amulya, and Annie Modestra Citation2020).
The cascading use of biomass and waste resources also implies that burning such resources (even for energy recovery purposes) should be the second to last option to adopt according to the waste hierarchy, just before landfilling (European Commission Citation2012, Citation2017). Notwithstanding, according to the waste management statistics reported in , the Scandinavian area is the case study making the largest use of incineration capacity: 56% of municipal waste is directed to incineration facilities. From a circular perspective, the Waste-to-Energy (WtE) sector is often criticized not only because it represents the least desirable option of recovery, but also because it could disincentivise future efforts aimed at reducing waste generation.Footnote9 In fact, since these infrastructures require a stable amount of incoming material to be profitable, the very large capacity built in the Nordic countries, along with the long-term investments made to set up these facilities, caused a lock-in effect that is preventing the shift toward higher-level waste treatment options (Malinauskaite et al. Citation2017). However, the important contribution of the WtE sector in the district supply of energy and heat should also be recognized, especially in the Scandinavian case, as well as its key role in promoting and financing parallel circular investments (Savini Citation2021).
The case of WtE is not the only component producing technological lock-in and path-dependence patterns. The experience of the neighbouring municipality of Oslo, which has been guided by political strategies aiming at a recycling target of 50%, shows that these types of targets could neither counter growing trends in waste generation (Klitkou, Fevolden, and Capasso Citation2019). Instead, similarly to the incineration lock-in mechanisms, they represent a further technical specification that may prevent further leap forward in the waste management hierarchy. In this context, CE initiatives should be sought at exploring how to prevent in the first instance the production of waste, especially in those areas characterized by rapid urban expansion, such as the Akershus region within the Viken county (NO03).
Finally, it must be reported that the cross-border Scandinavia area benefits from an established and innovative ecosystem characterized by a consolidated stakeholder network, including industrial clusters, science parks, research institutes and universities. Thanks to a strong historical cross-border collaboration, the Scandinavian area is implementing new and targeted partnerships that facilitate communication and interaction between different actors in the territory. As an example, Innlandet (NO02) and Värmland, a Swedish county within North Middle Sweden (SE31), have recently established a strategic cooperation agreement within selected priority areas to promote joint regional development and growth.Footnote10
3.2.3. Switzerland and Liechtenstein
Swiss regions and Liechtenstein present mixed territorial facets. On the one side, the very urbanized regions of Zurich (879 hab/km2) and Northwestern Switzerland (592 hab/km2) present territorial characteristics similar to Luxembourg. In these areas, the reduced availability of natural resources (DE per capita is 3.04 t/hab in Zurich and 5.28 t/hab in Northwestern Switzerland) and the higher concentration of human capital led to economic structures mostly based on the tertiary sector. On the other side, Eastern Switzerland and Central Switzerland have territorial characteristics more specific for rural areas, like those analysed in the Scandinavian area (although more moderate). Therefore, similar conclusions for these regions can be drawn based on previous chapters. In addition, similarly to Luxembourg, the strategic location in the centre of Europe, the quality of life and working conditions and the very developed transport infrastructure make Switzerland and Liechtenstein also an appreciated destination for cross-border commuters. This, in turn, requires a more cautious interpretation of the CE per capita indicators, as commuting flows could inflate statistics as previously described.
The most important territorial pattern that characterizes the Swiss case study is the growing and extraordinary high level of MSW. In general, the MSW generation is closely related to the number of inhabitants and their economic well-being (Magazzino et al. Citation2021; Mazzanti and Zoboli Citation2009). The higher the population, the more waste is produced. Likewise, the greater the economic well-being, the greater the waste. These dynamics can, in part, explain the stark difference between Swiss MSW per capita (729 kg/hab) and European average (484 kg/hab). Hardly any other country generates as much municipal waste in relation to the resident population and, considering the steady growth of the population and increasing prosperity of this country, these figures are expected to increase in the future. These waste generation trajectories stand alongside with very high recycling rates. Indeed, thanks to a long tradition in waste management policies and a very efficient collection and recycling system in place, Switzerland and Liechtenstein are among the countries with the highest recycling rates in Europe. Notably, despite the MSW has grown overtime, the amount of waste directed to incineration seems to remain stable, suggesting therefore the prioritization of Switzerland towards higher-level waste management options.
However, this territorial evidence exemplifies, once again, that CE initiatives aimed at waste prevention should take priority over waste treatment options. Furthermore, if the final goal is to reduce consumption footprints (i.e. looking at impacts occurring along the global supply chain), a more systemic approach to resources management should be adopted. To this aim, a sound dialogue between product designers and end-of-life materials managers need to be at the heart of the discussion, as it will be a crucial step for the implementation of circular approaches within the production-consumption-disposal system. In this sense, Switzerland and Liechtenstein are among the European territories best positioned to take advantage of installed technological know-how for the deployment of circular systems. According to the Regional Innovation Scoreboard (RIS) (European Commission Citation2019), all Swiss regions are ‘innovation leaders’, i.e. they have an overall innovation performance 40% above the EU average. In particular, Zurich and Ticino are the first and second most innovative regions in Europe. With respect to the potential for circular-oriented innovations, Swiss regions like Ticino and Northwestern Switzerland seem to be better placed as they were those introducing a higher number of new products (goods or services) and processes compared to other Swiss or European regions. The same goes for organizational innovations: Ticino, Espace Mitteland, Eastern Switzerland and Zurich have the highest share of SMEs innovating through non-technological innovations across Europe (European Commission Citation2019).
4. Discussion and conclusion
Regional monitoring frameworks are key tools for territorial planning as they can inform policy decisions by identifying priority intervention areas and by monitoring and evaluating implemented initiatives. However, CE discussion from a regional standpoint is still limited and CE frameworks remain at a rather theoretical level (Avdiushchenko Citation2018; Elia, Gnoni, and Tornese Citation2017; Smol, Kulczycka, and Avdiushchenko Citation2017). This paper seeks to contribute to this research gap (1) by providing a CE monitoring framework based on publicly available data at the regional level (NUTS 2), and (2) by giving practical evidence of how the analysis of the proposed framework can provide guidelines for planning CE strategies at the regional level.
As a general rule, the distribution and combination of socioeconomic factors (e.g. population, businesses and urban configurations), together with the availability of natural resources, often determine the enabling conditions of circular systems. In the case of the Scandinavian area, the presence of large stocks of renewable resources has favoured the adoption of circular solutions based on the cascading use of biomass. Differently, the presence of a dense socioeconomic fabric and the lack of primary raw materials can favour the deployment of circular strategies based on the optimization of technical cycles through the recovery of materials. This is the case, for instance, of Luxembourg, one of the European countries with a cutting-edge manufacturing industry that already relies almost entirely on the reuse and recycling of metallic waste. The optimization of technical cycles, including strengthening secondary raw materials markets, often goes beyond the circularity goals as it also supports the resilience of local economies, especially in territories that depend on stable flows of imports such as Luxembourg, Switzerland and Liechtenstein.
The comparison between case studies also indicates a generalized growth in MSW generation. Evidence from Luxembourg and Switzerland shows that high waste management standards and highly efficient infrastructures in place do not stop the production of municipal waste. Lock-in mechanisms and path-dependence patterns might lead to a situation in which less preferable CE strategies such as recycling maintain a leading position compared to more ambitious strategies such as waste prevention and reuse, repair and remanufacturing of products. Moving from an incremental approach towards a more systemic change requires ambitious actions and investments at the level of political decision makers. In fact, more circular production and consumption systems are unlikely to be achieved by individual companies alone. Rather, the entire territorial ecosystem can close the circle. In this context, local authorities occupy a privileged position in comparison with the broader institutional context as they directly collaborate with local networks (Mukhtar-Landgren et al. Citation2019). Therefore, municipalities should go beyond traditional waste management policies and take advantage of their proximity to citizens, manufacturers, retailers, service providers and research institutions to channel local resources for the deployment of circular innovations along the value chain of priority sectors and products.
This article provided some critical insights for the definition of regional CE monitoring frameworks, including some recommendations for CE indicators selection. First, the use of ‘per capita’ indicators in small territories characterized by significant commuting in-flows, like Luxembourg or Liechtenstein, often generates a biased picture of the regional performance. In fact, commuting workforce does not count as resident population, notwithstanding it influences the overall consumption of resources and contributes to waste generation. Therefore, the impact of this foreign workforce is not accounted in per capita indicators. Ideally, the commuting workforce should be added to the residential population, or alternatively, ‘intensity’ indicators, which link resource consumption or waste generation to the size of the economy, might represent a better alternative for measuring material or waste efficiency. Second, the CMU indicator endorsed by the EC is constructed to rewards countries efforts to collect internally generated waste for recovery purposes, but it actually neglects countries efforts to reintroduce secondary raw material into the economy. Although most regions are not affected by this nuance as the interregional waste exchanges are limited, for some regions such as Luxembourg this prospect is severely penalizing. In this context, it is important to consider complementary metrics that include the import of waste for recycling.
To conclude, some limitations of the research should be highlighted. First, the document focused mainly on technical CE indicators, i.e. material and waste flows, which are directly available at the regional level (NUTS-2). However, material and waste indicators cover only some specific aspects of the CE (Avdiushchenko Citation2018). To ensure a just and inclusive transition, further indicators informing on environmental, social and economic sustainability aspects should also be included (Corvellec, Stowell, and Johansson Citation2021). In addition, there appears to be a gap in providing metrics that address the circular use of materials not only at the subnational level, but also at the national scale (Völker, Kovacic, and Strand Citation2020). Most waste management statistics inform about recycling/recovery rates. However, these normally measure the amount of materials entering the recycling facilities, without informing on the actual amount of secondary materials reintroduced in the economy. On top of this, the availability of waste statistics at the regional level remains the exception rather than the rule. Therefore, further research on these aspects, including the development of new time-efficient methods for providing data at the local level, would be of great benefit to regional studies.
Second, this research analysed three case studies which, despite having different territorial connotations, are among the richest countries in terms of GDP per capita in Europe. Therefore, this sample is far from being representative of a multifaceted territorial panorama like the European one. Future research could bring new evidence by considering additional case studies from, for example, regions of Eastern or Southern Europe. In this context, the monitoring framework provided in this work could represent the first step towards a consolidated and harmonized scheme for sub-national territories (also following the research orientations provided above).
Third, it must be recognized that circular systems often have a territorial deployment that goes beyond administrative borders. Although the spatial resolution of regional monitoring frameworks certainly allows for better adaptation to the boundaries of a circular system, it remains a manmade delimitation that can induce to think about regions or cities as ‘islands’ rather than areas embedded and interlinked with a broader territorial environment. Favoured by agglomeration economies, cities, and more in general urban areas, seem to have benefited much more from the circular economy discourse (Corvellec, Stowell, and Johansson Citation2021). However, cities are massively dependent on hinterland regions where industries for majority of the products are located. Similarly, some regions host vast natural reserves in their respective jurisdiction (e.g. the case of forests in Innlandet, Norway, or arable land in Värmland, Sweden), whose productions are directed to urban areas for final consumption. To avoid the risk of increased polarization between urban and rural areas, the design of CE strategies should be better based on the definition of ‘functional’ areas that recognize these interdependencies. Therefore, further research should aim to better understand the functional connectivity between different areas, including the development of indicators capable of measuring and relating the impact of circular solutions encompassing different territorial levels.
Supplemental_material_S1new1.docx
Download MS Word (24.1 KB)Acknowledgements
The authors appreciate the comments received from the policy advisory group: Marjan van Herwijnen (ESPON EGTC), Frederick-Christoph Richters, Paul Schosseler (Ministry of Energy and Spatial Planning, Luxembourg), Jan Edøy (Ministry of Local Government and Modernisation, Department of Regional Development, Norway), Erik Hagen, Bjørn Terje Andersen (Innlandet County Authority, Norway), Béla Filep (State Secretariat for Economic Affairs SECO, Switzerland), Marco Kellenberger (Federal Office for Spatial Development (ARE), Switzerland) and Henrik Caduff (Office of construction and infrastructure, Principality of Liechtenstein), and from the European Regional Science Association (ERSA) conference audience on the results of the case studies.
Disclosure statement
No potential conflict of interest was reported by the author(s).
Additional information
Funding
Notes
1 The Nomenclature of Territorial Units for Statistics (NUTS) is a geocode standard for referencing the subdivisions of countries for statistical purposes. The standard is developed and regulated by the European Union, and thus only covers the member states of the EU in detail. The analysis covers all the EU and most European Free Trade Area (EFTA).
2 CIRCTER is the project acronym for ‘Circular Economy and Territorial Consequences’.
3 The results were also presented to a policy advisory group (i.e. local decision makers such as planners, municipal authorities, etc.) who reviewed, gave feedback, and finally endorsed the technical reports (see the acknowledgements section).
5 In addition to the Eurostat and ESPON databases, we also searched for regional data (NUTS 2) within the respective national statistical databases.
6 In this case the benchmark is Europe. Therefore, if a location quotient is equal to 1 it means that the territory has a concentration in sector ‘X’ equal to the European average. While if the LQ is equal to 2, the territory will be twice more concentrated in sector X than the European average.
7 In Luxembourg, brownfield sites cover 537 ha, which equates to around 16% of all the land available for building according to local development plans (Glumac and Decoville Citation2020).
9 Waste incineration is also at the centre of the purely environmental debate due to dubious trade-off between energy efficiency gains and environmental degradation (e.g. see Abbasi Citation2018).
References
- Abbasi, S. 2018. “The Myth and the Reality of Energy Recovery from Municipal Solid Waste.” Energy, Sustainability and Society 8. doi:10.1186/s13705-018-0175-y.
- Avdiushchenko, A. 2018. “Toward a Circular Economy Regional Monitoring Framework for European Regions: Conceptual Approach.” Sustainability 10. doi:10.3390/su10124398.
- Avdiushchenko, A., and P. Zając. 2019. “Circular Economy Indicators as a Supporting Tool for European Regional Development Policies.” Sustainability 11: 3025. doi:10.3390/su11113025.
- Bačová, M., K. Böhme, M. Guitton, M. van Herwijnen, T. Kállay, J. Koutsomarkou, I. Magazzù, E. O’Loughlin, and A. Rok. 2016. Pathways to a Circular Economy in Cities and Regions: A Policy Brief Addressed to Policy Makers from European Cities and Regions.
- Bahers, J., M. Durand, and H. Beraud. 2017. “Quelle territorialité pour l’économie circulaire ? Interprétation des typologies de proximité dans la gestion des déchets.” Flux 109–110: 129–141. doi:10.3917/flux1.109.0129.
- Bassi, A., M. Bianchi, M. Guzzetti, G. Pallaske, and C. Tapia. 2020. “Improving the Understanding of Circular Economy Potential at Territorial Level Using Systems Thinking.” Sustainable Production and Consumption, doi:10.1016/j.spc.2020.10.028.
- Bianchi, M., I. del Valle, and C. Tapia. 2020. “Measuring Eco-Efficiency in European Regions: Evidence from a Territorial Perspective.” Journal of Cleaner Production, 123246. doi:10.1016/j.jclepro.2020.123246.
- Bianchi, M., I. del Valle, and C. Tapia. 2021. “Material Productivity, Socioeconomic Drivers and Economic Structures: A Panel Study for European Regions.” Ecological Economics 183. doi:10.1016/j.ecolecon.2021.106948.
- Bianchi, M., C. Tapia, and I. del Valle. 2020. “Monitoring Domestic Material Consumption at Lower Territorial Levels: A Novel Data Downscaling Method.” Journal of Industrial Ecology. doi:10.1111/jiec.13000.
- Bolger, K., and A. Doyon. 2019. “Circular Cities: Exploring Local Government Strategies to Facilitate a Circular Economy.” European Planning Studies 27: 2184–2205. doi:10.1080/09654313.2019.1642854.
- Burger, M., S. Stavropoulos, S. Ramkumar, J. Dufourmont, and F. van Oort. 2019. “The Heterogeneous Skill-Base of Circular Economy Employment.” Research Policy 48: 248–261. doi:10.1016/j.respol.2018.08.015.
- Corvellec, H., A. Stowell, and N. Johansson. 2021. “Critiques of the Circular Economy.” Journal of Industrial Ecology Jiec, 13187. doi:10.1111/jiec.13187.
- Dąbrowski, M., V. Varjú, and L. Amenta. 2019. “Transferring Circular Economy Solutions Across Differentiated Territories: Understanding and Overcoming the Barriers for Knowledge Transfer.” Urban Planning 4: 52–62. doi:10.17645/up.v4i3.2162.
- Elia, V., M. Gnoni, and F. Tornese. 2017. “Measuring Circular Economy Strategies Through Index Methods: A Critical Analysis.” Journal of Cleaner Production 142: 2741–2751. doi:10.1016/j.jclepro.2016.10.196.
- ESPON CIRCTER. 2019. CIRCTER – Circular Economy and Territorial Consequences – Final Report. https://www.espon.eu/circular-economy
- Esposito, M., T. Tse, and K. Soufani. 2018. “The Circular Economy: An Opportunity for Renewal, Growth, and Stability.” Thunderbird International Business Review 60: 725–728. doi:10.1002/tie.21912.
- European Commission. 2012. “Innovating for Sustainable Growth: A Bioeconomy for Europe.” Official Journal of the European Union. doi:10.1089/ind.2012.1508.
- European Commission. 2014. Scoping Study to Identify Potential Circular Economy Actions, Priority Sectors, Material Flows and Value Chains. European Commission. doi:10.2779/29525.
- European Commission. 2017. Bioeconomy Development in EU Regions.
- European Commission. 2018. A Monitoring Framework for the Circular Economy. Communication from the Commission to the European Parliament, the Council, the European Economic and Social Committee and the Committe of the Regions 1–11.
- European Commission. 2019. Regional Innovation Scoreboard (RIS). doi:10.2873/89165.
- European Commission. 2020. “A New Circular Economy Action Plan for a Cleaner and More Competitive Europe.” Official Journal of the European Union. https://eur-lex.europa.eu/legal-content/EN/TXT/?qid=1583933814386&uri=COM:2020:98:FIN.
- Eurostat. 2018. Circular Material Use Rate. Statistical Office of the European Communities.
- Ghisellini, P., C. Cialani, and S. Ulgiati. 2016. “A Review on Circular Economy: The Expected Transition to a Balanced Interplay of Environmental and Economic Systems.” Journal of Cleaner Production 114: 11–32. doi:10.1016/j.jclepro.2015.09.007.
- Glumac, B., and A. Decoville. 2020. “Brownfield Redevelopment Challenges: A Luxembourg Example.” Journal of Urban Planning and Development 146: 05020001. doi:10.1061/(asce)up.1943-5444.0000565.
- Gonçalves, A., D. Galliano, and P. Triboulet. 2021. “Eco-Innovations Towards Circular Economy: Evidence from Cases Studies of Collective Methanization in France.” European Planning Studies. doi:10.1080/09654313.2021.1902947.
- Haas, W., F. Krausmann, D. Wiedenhofer, and M. Heinz. 2015. “How Circular is the Global Economy?: An Assessment of Material Flows, Waste Production, and Recycling in the European Union and the World in 2005.” Journal of Industrial Ecology 19: 765–777. doi:10.1111/jiec.12244.
- Hartley, K., R. van Santen, and J. Kirchherr. 2020. “Policies for Transitioning Towards a Circular Economy: Expectations from the European Union (EU).” Resources, Conservation and Recycling 155. doi:10.1016/j.resconrec.2019.104634.
- Heshmati, A., and M. Rashidghalam. 2021. “Assessment of the Urban Circular Economy in Sweden.” Journal of Cleaner Production 310: 127475. doi:10.1016/j.jclepro.2021.127475.
- Horta, I., and J. Keirstead. 2017. “Downscaling Aggregate Urban Metabolism Accounts to Local Districts.” Journal of Industrial Ecology 21: 294–306. doi:10.1111/jiec.12428.
- Klitkou, A., M. Fevolden, and M. Capasso. 2019. From Waste to Value: Valorisation Pathways for Organic Waste Streams in Circular Bioeconomies. London: Routledge. doi:10.4324/9780429460289.
- Korhonen, J., C. Nuur, A. Feldmann, and S. Birkie. 2018. “Circular Economy as an Essentially Contested Concept.” Journal of Cleaner Production 175: 544–552. doi:10.1016/j.jclepro.2017.12.111.
- Kretschmer, B., C. Smith, E. Watkins, B. Allen, A. Buckwell, J. Desbarats, and D. Kieve. 2013. “Technology Options for Feeding 10 Billion People. Recycling Agricultural, Forestry & Food Wastes and Residues for Sustainable Bioenergy and Biomaterials.” Food Engineering. doi:10.2861/33176.
- Lahti, T., J. Wincent, and V. Parida. 2018. “A Definition and Theoretical Review of the Circular Economy, Value Creation, and Sustainable Business Models: Where are We Now and Where Should Research Move in the Future?” Sustainability. doi:10.3390/su10082799.
- Magazzino, C., M. Mele, N. Schneider, and S. Sarkodie. 2021. “Waste Generation, Wealth and GHG Emissions from the Waste Sector: Is Denmark on the Path Towards Circular Economy?” Science of the Total Environment 755. doi:10.1016/j.scitotenv.2020.142510.
- Malinauskaite, J., H. Jouhara, D. Czajczyńska, P. Stanchev, E. Katsou, P. Rostkowski, R. Thorne, et al. 2017. “Municipal Solid Waste Management and Waste-to-Energy in the Context of a Circular Economy and Energy Recycling in Europe.” Energy 141: 2013–2044. doi:10.1016/j.energy.2017.11.128.
- Mayer, A., W. Haas, D. Wiedenhofer, F. Krausmann, P. Nuss, and G. Blengini. 2019. “Measuring Progress Towards a Circular Economy: A Monitoring Framework for Economy-Wide Material Loop Closing in the EU28.” Journal of Industrial Ecology 23: 62–76. doi:10.1111/jiec.12809.
- Mazzanti, M., and R. Zoboli. 2009. “Municipal Waste Kuznets Curves: Evidence on Socio-Economic Drivers and Policy Effectiveness from the EU.” Environmental and Resource Economics 44: 203–230. doi:10.1007/s10640-009-9280-x.
- Mukhtar-Landgren, D., A. Kronsell, Y. Voytenko Palgan, and T. von Wirth. 2019. “Municipalities as Enablers in Urban Experimentation.” Journal of Environmental Policy and Planning 21: 718–733. doi:10.1080/1523908X.2019.1672525.
- PNGD. 2018. Plan National de Gestion des Dechetes et des Ressources. Luxembourg.
- Sánchez Levoso, A., C. Gasol, J. Martínez-Blanco, X. Durany, M. Lehmann, and R. Gaya. 2020. “Methodological Framework for the Implementation of Circular Economy in Urban Systems.” Journal of Cleaner Production 248. doi:10.1016/j.jclepro.2019.119227.
- Savini, F. 2021. “The Circular Economy of Waste: Recovery, Incineration and Urban Reuse.” Journal of Environmental Planning and Management 64: 2114–2132. doi:10.1080/09640568.2020.1857226.
- Scarpellini, S., P. Portillo-Tarragona, A. Aranda-Usón, and F. Llena-Macarulla. 2019. “Definition and Measurement of the Circular Economy’s Regional Impact.” Journal of Environmental Planning and Management 62: 2211–2237. doi:10.1080/09640568.2018.1537974.
- Sherwood, J. 2020. “The Significance of Biomass in a Circular Economy.” Bioresource Technology. doi:10.1016/j.biortech.2020.122755.
- Smol, M., J. Kulczycka, and A. Avdiushchenko. 2017. “Circular Economy Indicators in Relation to Eco-Innovation in European Regions.” Clean Technologies and Environmental Policy. doi:10.1007/s10098-016-1323-8.
- Su, B., A. Heshmati, Y. Geng, and X. Yu. 2013. “A Review of the Circular Economy in China: Moving from Rhetoric to Implementation.” Journal of Cleaner Production 42. doi:10.1016/j.jclepro.2012.11.020.
- Tapia, C., M. Bianchi, G. Pallaske, and A. Bassi. 2021. “Towards a Territorial Definition of a Circular Economy: Exploring the Role of Territorial Factors in Closed-Loop Systems.” European Planning Studies. doi:10.1080/09654313.2020.1867511.
- Venkata Mohan, S., K. Amulya, and J. Annie Modestra. 2020. “Urban Biocycles – Closing Metabolic Loops for Resilient and Regenerative Ecosystem: A Perspective.” Bioresource Technology. doi:10.1016/j.biortech.2020.123098.
- Völker, T., Z. Kovacic, and R. Strand. 2020. “Indicator Development as a Site of Collective Imagination? The Case of European Commission Policies on the Circular Economy.” Culture and Organization 26: 103–120. doi:10.1080/14759551.2019.1699092.
- Weisz, H., F. Krausmann, C. Amann, N. Eisenmenger, K. Erb, K. Hubacek, and M. Fischer-Kowalski. 2006. “The Physical Economy of the European Union: Cross-Country Comparison and Determinants of Material Consumption.” Ecological Economics 58: 676–698. doi:10.1016/j.ecolecon.2005.08.016.
- Wiedmann, T., H. Schandl, M. Lenzen, D. Moran, S. Suh, J. West, and K. Kanemoto. 2015. “The Material Footprint of Nations.” PNAS 112: 6271–6276. doi:10.1073/pnas.1220362110.
- Williams, J. 2019. “Circular Cities.” Urban Studies 56: 2746–2762. doi:10.1177/0042098018806133.