
ABSTRACT
In recent years, a growing number of institutional mapping approaches has reflected on border regions’ development. These approaches visualise the relationship between institutional and spatial patterns. In parallel, the quality and quantity of cooperation-related information in the EU KEEP database (DB) is continuously increasing. The aim of our paper is two-fold. Firstly, we aim to understand the cooperation dynamics and funding geographies of the recent INTERREG A period. We do so with the example of cross-border programmes with German participation. More concretely, we scrutinise the relationships that exist between the spatial configurations of funded project cooperation, the involved thematic topics and the role of territorial contexts, particularly in terms of the degree of urbanisation and distance to a border. Secondly, we reflect on the potential and limitations of institutional mapping based on KEEP data. Specifically, we explore the explanatory capacity of institutional mappings based on KEEP data and discuss the blind spots that must be considered and how these could be addressed. The general conclusion from our paper is that institutional mapping based on the KEEP DB proves to be a strong data exploration tool with potential for comparative analyses. However, it has clear limitations with regard to causality testing.
1. Introduction
Cooperation across internal EU borders and the underlying funding schemes are well-established and almost classical research topics. After three decades of INTERREG experience, the number of published reports, programme evaluations and academic reflections is high (cf. Reitel et al. Citation2018). Cooperation programmes are an important part of contemporary governance patterns in border regions. However, recent crises have shown that resilience is a crucial aspect of border region development. For example, the partial closure of borders due to the migration flows of 2015 and the COVID-19 pandemic from 2020 onwards have led to enormous political complications, serious difficulties for the border regions’ citizens and socio-economic challenges (Opiłowska Citation2020, Andersen & Prokkola Citation2022). These challenges certainly go beyond INTERREG programmes and soft cooperation formats. However, recent experiences have underlined the need to further develop border regions’ governance. The outputs and potentials of the INTERREG activities play an important role in this setting.
Our contribution to this debate is triggered by three current dynamics. Firstly, the recent INTERREG A (2014–2020) funding period is now coming to an end, which leads to questions regarding what can be learned for the new period and border studies in general (cf. Klatt and Winkler Citation2020). This is true for evaluations and programming procedures on the programme level, but also for border studies debates in general. Our empirical analysis of the cross-border programmes with German participation includes nine border regions and thirteen involved INTERREG A programmes, which represents an instructive set of implementation experiences.
Secondly, the EU project database KEEP (www.keep.eu) provides systematic information on cooperation funding, including the thematic scope, budget and lifetime, as well as the locations of lead partners and project partners. Notably, the quality and quantity of information on this database are continuously improving. A growing number of studies have referred to the KEEP database (Borowicz and Pachocka Citation2019 for the EU 15 in a long-term analysis; Décoville and Durand Citation2021 for cross-border spatial planning). Although these studies use the available information, they rarely reflect on the general limitations and potential of this type of data.
Thirdly, and most important for our paper, analysing cooperation patterns and dynamics can benefit from the approach of institutional mapping that has increasingly contributed to border studies in recent years (e.g. Chilla, Evrard, and Schulz Citation2012; Kaucic and Sohn Citation2021). The systematic exploration of institutional and territorial dynamics can contribute to analyses of cross-border cooperation in a highly effective manner. The present paper takes stock of the existing approaches of institutional mapping and explores a new perspective via the example of Germany’s border regions. Even if KEEP data play a growing role in border-related analyses, a systematic and cross-sectoral mapping of cooperation data remains missing. The focus on Germany’s nine border regions (organised in thirteen programmes), covers a broad range of spatial contexts with Eastern and Western European neighbours, different geomorphological situations and differing degrees of urbanisation.
Against this background, the aim of the paper is two-fold. Firstly, we aim to understand the cooperation dynamics and funding geographies of the recent INTERREG A period via the example of cross-border programmes with German participation. More concretely, we scrutinise the types of relationships between the spatial configurations of funded project cooperation and the thematic topics involved. Furthermore, we explore the relationship between thematic programme foci and the territorial contexts, particularly in terms of the degree of urbanisation and distance to a border.
Secondly, and more generally speaking, we reflect on the potential and limitations of institutional mapping based on KEEP data. This raises the following question: How meaningful is the spatial information on funded cooperation across borders, including the locations of consortia, related project content and budget sizes? Furthermore, we explore the explanatory capacity of institutional mappings based on KEEP data and reflect on the blind spots and how these could be addressed.
2. Conceptual framework
2. 1. The role of cross-border cooperation programmes
Decades of European integration have led to fundamental changes in border regions. The Schengen agreement and EU harmonisation processes have fuelled cross-border integration dynamics. European labour markets show rising numbers of cross-border commuters, many education programmes and touristic offers have a cross-border dimension, etc. (cf. Plangger Citation2019). However, border regions remain areas where different political systems meet, and the actors of cross-border cooperation have to manage these differences. Many Euregions and other cooperation formats are in place, and new resources and networks are being established with the potential for incremental strategic positioning (Plangger Citation2019, Varró Citation2016). Despite this strong dynamic, the formal cooperation networks, political mandates and cooperation topics are typically rather soft (Fricke Citation2015; De Sousa Citation2012, 8). This is a particularity of European border regions in which the local and regional levels play a key role, with cooperation being based on trust and personal networks (Bufon Citation2011, 31).
INTERREG funds play a crucial role in facilitating these processes of cooperation, networking, trust-building, as well as in finding concrete solutions ‘on the ground’ (Frątczak-Müller and Mielczarek-Żejmo Citation2020). Since the 1990s, funding volumes in INTERREG A have constantly increased, and the focus has enlarged. The cooperation programmes have been a new opportunity for border regions to implement a series of funded projects and to directly be in contact with the EU Commission. From this perspective, Europeanisation through funding programmes has been seen to strengthen the border regions (e.g. Harguindéguy and Bray Citation2009). There is consensus that INTERREG funding has been – and remains – essential for overcoming ‘long-standing processes of conflict, competition or lack of cooperation’ (Colomb Citation2018, 103). The current debate is not so much about whether INTERREG A funding is helpful, but how it can be improved and complemented throughout the multi-level governance system.
Three decades of INTERREG experience show a multi-faceted picture (Wassenberg et al. Citation2015). A broad range of thematic topics has been covered (Noferini et al. Citation2020) and the established actor networks of cross-border cooperation can be considered ‘territorial development assets’ (Berzi Citation2017, 1584). The network capacity is crucial for cross-border functioning (Nienaber and Wille Citation2020, 3). However, cross-border cooperation does not automatically lead to positive effects. For example, polarisation trends might be part of cooperation dynamics (Martín-Uceda and Vicente Rufí Citation2021). The degree of success in cross-border cooperation ‘varies considerably from one region to another depending on the combination of facilitating factors for effective cross-border cooperation, more specifically, economic, political leadership, cultural/identity and state formation, and geographical factors’ (De Sousa Citation2012: 669). Not only the facilitating factors but also the characteristics of cross-border barriers are multi-faceted. physical, institutional and socio-cultural obstacles can be barriers to cooperation in very different constellations (Capello, Caragliu, and Fratesi Citation2018).
The fundamental idea of INTERREG cooperation is to learn from good examples. This best practice approach assumes that innovation and diffusion patterns function across borders (Knippschild and Vock Citation2017). Stakeholder participation is seen as a key to success for cross-border cooperation across all phases of the policy cycle (Borges et al. Citation2021). Furthermore, spatial, cultural, technological and other forms of proximity have a strong potential for cooperation success. Even if there is no determinism between proximity and cooperation success, the relationship matters (Makkonen, Williams Mitze, and Weidenfeld Citation2018). However, the existing findings rely on a limited empirical basis. For the example of cross-border regional innovation systems, Makkonen and Rohde (Citation2016) argue that more systematic databases are of critical importance.
The KEEP database has great potential in this context since it systematically gathers information on cross-border cooperation. A number of studies refer to the KEEP database whilst exploring dynamics and patterns of INTERREG funding on different scales (e.g. Borowicz and Pachocka Citation2019 for the EU 15 in a long-term analysis; Décoville and Durand Citation2021 for cross-border spatial planning). We scrutinise KEEP data for the example of cross-border programmes with German participation. With its nine border regions and thirteen INTERREG A programmes, this case is instructive with regard to implementation experiences and the diversity of territorial contexts. Based on this analysis, we reflect on the general potential of KEEP data.
2. 2. Institutional mapping in cross-border contexts
The reflection on cross-border cooperation dynamics has come along with increasing relevance of ‘institutional mappings’. In principle, institutional mapping means capturing and visualising institutional information from a spatial perspective. In this context, institutions comprise both ‘hard’ forms (e.g. juridical regulations) and rather ‘soft’ forms (e.g. informal networks) with a certain de facto role. While institutional mappings can take very different forms, they always combine the following three elements:
The spatial dimension, which can be concrete geographical information (e.g. perimeters) or generic information about types of spaces,
the institutional (political) dimension, which covers mandates, resources, thematic priorities etc., and
the technical visualisation, which combines key information in a highly accessible ‘didactic’ manner.
Institutional mapping has been applied to diverse objects of cross-border cooperation. Typically, these approaches contain some descriptive information as well as dense analytical insights. The following types refer to geo-localised, cartographic ways of representation:
o Perimeter mapping is a commonly applied way of illustrating the territories involved in cooperation areas and formal border regions (e.g. the Czech-Polish example in Kurowska-Pysz and Szczepańska-Woszczyna Citation2017, 8). Eligibility is important information in this context since perimeter maps often define where involved partners must be located (or active) in order to receive funding. This rather rudimentary form of institutional mapping exists in both academia and policy documents, including the programme and EU levels (e.g. the Commission’s map of the cross-border programmes for the funding period 2014–20; EU COM Citationn.y.)
o Thematic priority mapping has been part of several academic reflections. For example, Esparza-Masana (Citation2020) maps the most dominant cooperation themes (‘thematic predominance’) based on the ‘portion of participation by thematic area for each eligible [Spanish] Autonomous Communities’ (ibid.: 21). Décoville and Durand (Citation2021) scrutinise the spatial planning priority of the INTERREG IV A programme (2007–14).
o Multi-level governance mapping combines the horizontal cooperation dynamic (between actors of a similar institutional level) with the vertical dimension (between actors on different hierarchical levels). For example, the mismatch in sectoral mandates of the Greater Region around Luxembourg is at the heart of regional cooperation efforts (Chilla, Evrard, and Schulz Citation2012).
o Cooperation typologies are the focus of numerous mappings and aim to group certain patterns of cooperation. For example, Wassenberg et al. (Citation2015) do so with the combination of perimeters and juridical forms, while Kaucic & Sohn link spatial contexts with the activity statuses of border regions (Kaucic and Sohn Citation2021).
o A diffusion mapping involves the temporal dimension of governance. Chilla, Sielker, and Othengrafen (Citation2017) elaborate the spatial distribution of the EGTC tool across Europe and differentiate the role of national actors in the background.
o Network mappings can be the graphic part of social network analyses. Dörry and Décoville (Citation2016) elaborate this for the example of policy networks in the field of cross-border transportation networks.
Spatial development concepts cannot be considered institutional mappings in the narrow sense. However, since they provide visual orientations for spatial planning institutions, they should be mentioned in this context (cf. Caesar and Pallagst Citation2018).
Even if all of the aforementioned approaches have a cartographical dimension, institutional mappings can also be graphic illustrations in a more abstract – and not strictly geo-localised – manner:
o Political mandates and key documents can be visualised in a way that reflects chronology and hierarchy, whilst the spatial dimension remains in the background (Purkarthofer Citation2016).
o Pupier (Citation2020) visualises spatial and institutional dynamics of cross-border cooperation in generic forms, which are adaptable to numerous concrete contexts (Pupier Citation2020).
o An ESPON project on soft cooperation spaces summarises cooperation characteristics such as available resources and thematic range in the form of spider graphs (ESPON ACTAREA Citation2017).
Although this overview of institutional mapping is not complete, it illustrates the prominence and relevance of this approach. The efficient way of presenting heterogeneous forms of information is particularly relevant for the often-complex settings in border regions. The selection of certain types of information (e.g. institutional competencies in different areas) allows a comparative perspective across (sub)territories. Visualisation helps to interpret the political geographical settings by comparing subsets of data. The explanatory capacity depends on the type of processed information, which can cover juridical instruments, resources, thematic priorities and cooperation outcomes.
However, some limitations are obvious. Institutional mappings are selective and simplified ways of representing complex real-world matters. Avoiding territorial traps and oversimplifications is a crucial challenge in this context.
In our study, we provide two institutional mappings for 13 involved programmes. The first combines cartographic perimeter mapping with the thematic profiles of the programmes, which is represented by spider graphs and based on budget spending. The second institutional mapping is a network mapping, which involves locating the institutions and consortia involved in project cooperation. Also, the second mapping differentiates nine thematic foci. Both mappings are interpreted against the background of the territorial setting in each programme area. This approach responds to our first research question, which aims to determine the type of relationship between the thematic foci of cooperation and the spatial patterns of cooperation.
Our second research question is a methodological one, asking for the potential and limitations of the KEEP database for cross-border institutional mappings. We use standard information from the KEEP database for the institutional mappings, which are systematically complemented with information from project webpages and assessed for quality. This allows us to discuss what types of blind spots can play a role and how these might be addressed in institutional mapping.
3. Methodology
3. 1. Data
The study is based on INTERREG-related data provided by the KEEP database. As an INTERACT project, the KEEP database provides information about budgets, cooperation partners, thematic topics and projects of numerous European programmes. The database is an open-access source, and its information can be downloaded in form of tables, diagrams or maps. Some of the latter provide rudimentary institutional mappings in themselves (see https://keep.eu/statistics).
For our analysis, we focus exclusively on INTERREG V A data, whilst excluding the so-called INTERREG small project funds and any other programmes (e.g. INTERACT, ENI). The completeness of the data is approximately 90% since the INTERREG IV period.Footnote1 All quantifications in the present study refer to the status of the KEEP database from december 2020.
For our study regions (i.e. the programme areas with German participation), the provided data are rather robust when compared to other programmes. However, data quality and completion remain an issue. Décoville and Durand (Citation2021, 4) criticise certain limitations, particularly with regard to thematic categorisation in the KEEP database. Against this background, general data validation was necessary to provide meaningful results. The dataset was completed and corrected in relation to a series of data gaps, spelling mistakes and similar shortcomings. In particular, the postal code classification had to be aligned. Also, some programmes only provide rudimentary data for the projects (e.g. lead partner, funding, budget), whilst leaving out information on the participating project partners. Some errors in the administrative assignments for French units and data gaps in the eastern cross-border regions had to be addressed. For some programmes, information on the project partners had to be added manually (e.g. INTERREG Poland-Brandenburg). Geographical data were primarily checked by using an open-source GIS tool, corrected and, if necessary, completed. Concretely speaking, we used the MMQGIS plug-in to check the georeferences of the CSV input (based on an open-source API key from OpenStreetMap). The MMQGIS plug-in uses the address data of the project partners (country, city or postal code and street), whereby incorrect addresses are unable to be located by the tool and thus returned as a CSV error file. This systematically revealed gaps and mistakes, especially spelling mistakes, numerical errors, and missing letters or numbers.
In principle, INTERREG activities have to refer to selected thematic objectives and investment priorities: ‘The fifth period of INTERREG is based on 11 investment priorities laid down in the ERDF Regulation contributing to the delivery of the Europe 2020 strategy for smart, sustainable and inclusive growth. At least, 80% of the budget for each cooperation programme has to concentrate on a maximum of 4 thematic objectives among the eleven EU priorities’ (EU COM Citationn.y. Footnote2). However, thematic categorisation is a challenge for several reasons. Firstly, the four investment categories are very broad and hardly allow for meaningful insights. Secondly, assignment to the 42 thematic categories is not always complete and formally correct (e.g. spelling). Thirdly, for each project, there are 1–3 assignments to thematic categories. This complex way of categorisation requires further filtering to refer to the key focus of the projects.
In the KEEP database, the attribution of the projects to official programme priorities is not entirely convincing. Against this background, we base our analyses on our own categorisation and assignment, which refers to the following classification:
o Tourism (including conventional tourism, slow-tourism and green tourism)
o Culture (including history, tradition and the arts)
o Health (including healthcare businesses, care, sports, inclusion, prevention and rescue services)
o Economy & Research (including digitalisation, skilled workers, Industry 4.0 and the economy)
o Governance (including institutional networking and public administration exchange)
o Environment (including climate change, biodiversity, circular economy, nature conservation, environmental education, habitat, disaster prevention and green energy)
o Agriculture & Forestry (including mining)
o Spatial development & Transport (including mobility, spatial planning and architecture)
o Society & Labour market (including volunteering work, social concerns, youth and security)
To achieve a differentiated picture, all projects belong to only one of the nine categories. This assignment is based on information from the KEEP database and desktop research from the INTERREG programmes’ websites as well as the websites of Euroregions (or similar institutional formats) and project websites (thematic project descriptions etc.).
3.2. Data visualisation
We provide two institutional mappings in terms of visualisation, namely a ‘thematic programme mapping’ and a ‘network mapping’.
The thematic programme mapping involves the combined presentation of the funding quantities and the number of projects in thematic differentiation. The combination of a cartographic representation (perimeter mapping) with spider graphs allows us to refer to all three dimensions simultaneously. The visualisation reveals thematic profiles for each programme area. This combination of three key variables provides a comprehensive picture of the institutional priorities of the programmes, which are based on decisions in the formulation and implementation phases.
Whereas the first mapping focuses on the programme level, the second scrutinises the project level and reflects the spatial dimension of the funded cooperation networks. The geo-localised mapping of the project networks provides information on thematic priorities in certain areas. Information on the size of the consortia (number of partners) and the differentiation between lead and project partners allows to delve deeper into the programme implementation. This mapping also differentiates the nine thematic foci introduced above.
Both mappings are interpreted against the background of the territorial setting in each programme area. This approach helps us respond to our first research questions (i.e. what kind of relationship exists between thematic foci of cooperation and the spatial patterns of cooperation).
The interpretation of both institutional mappings refer to three context types of cooperation. First, cooperation maturity is an important context. The Eastern border regions can only be understood when considering the history of the Iron Curtain. The temporal dimension of EU affiliation dates differs largely from EU 6 to EU 27, and Switzerland is not a formal EU member state. Secondly, the characteristics of the state organisation are also considered. Whereas the German system is clearly federal, the situation differs across the neighbour states, including rather centralised countries such as France, Denmark and the Czech Republic as well as the different kinds of federalism in Switzerland, Austria and Belgium. Third, the territorial context is also considered, particularly regarding the distance of the project partners to a border and the degree of urbanisation.
The interpretation relies on a combination of descriptive statistics and qualitative arguments. In summary, our institutional mapping is an explorative study providing visualisations that are interpreted by means of contextual knowledge.
3.3. The spatial focus – the case study of Germany
The present study focuses on cross-border cooperation programmes with German participation for the 2014–2020 period.Footnote3 These programmes involve nine borders and border regions. They are organised into 13 programmes with decentralised administration. German border regions cover a broad range of spatial contexts (BMVI Citation2017), comprising Eastern and Western European contexts as well as natural contexts ranging from the alpine relief to sea borders, metropolitan areas and peripheral territories.
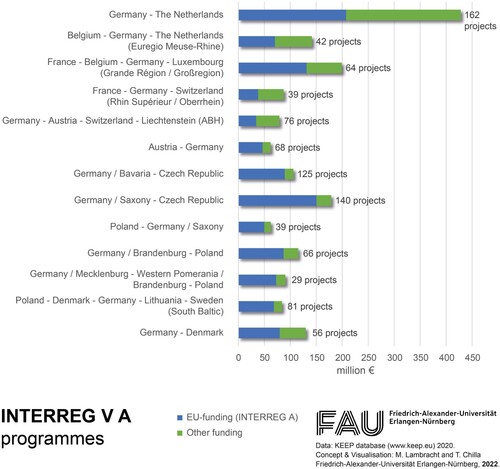
provides an overview of the data underlying our study. The total budget amount varies strongly, with the INTERREG programme Germany-Netherlands having the highest volumes, followed by the INTERREG programmes of the Greater Region, Saxony-Czech Republic, Meuse-Rhine and Germany-Denmark. On the one hand, this figure differentiates the European INTERREG V A funding, comprising the ERDF, ESF and other cohesion funds. On the other hand, it quantifies other funding such as co-funding, particularly at the domestic level. Co-funding is particularly high in programmes involving the Netherlands and Switzerland, and is lower in Eastern programmes.
Figure 1. INTERREG V A budget volumes and the shares of EU- and other funding. Source: KEEP database 2021.
4. Results
4.1. Thematic programme mapping
presents the first institutional mapping, providing information on 13 INTERREG programme areas of the study. The spider graphs capture the number of projects as well as the total budget (in millions of euro) for the nine thematic categories. The background map shows the programme areas.
Figure 2. Programme mapping: Number of projects and budget per programme.
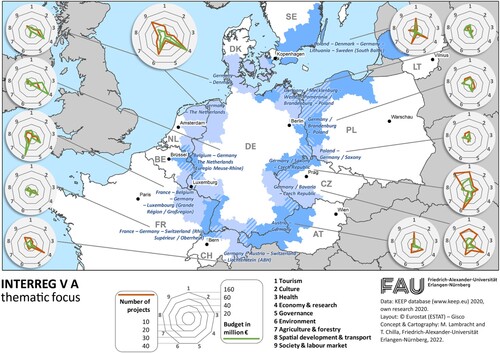
The mapping highlights the following patterns:
o The spider graphs visualise differing thematic profiles based on the number of projects and their budget volumes. They also show the prominence of certain thematic topics. In most regions, economy and environment are particularly important topics. In particular, some smaller programmes show an even balance between the topics (e.g. PL, CZ). Others show a clear thematic profile (e.g. Belgium with a focus on the economy, Luxembourg on the environment, the Czech Republic on tourism, etc.).
o The graphs reflect the differing overall programme funds (see ) and concretise the funding per project in each thematic area. In cases where the brown line shows higher values than the green one, a high number of projects comes along with relatively small project budgets. For example, the two German-Czech cases are characterised by numerous but small projects covering several thematic priorities. In the South Baltic case, we almost see a congruency of the two lines, where there tend to be larger projects.
4.2. Network mapping
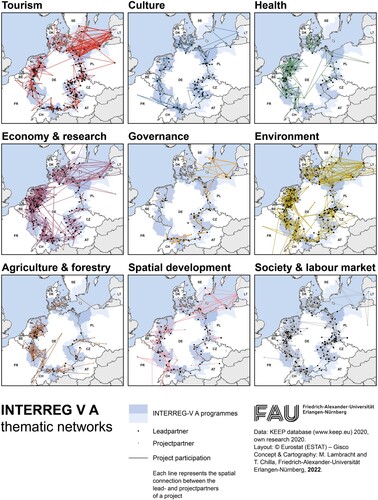
presents the localised networks of all INTERREG A project partners. This institutional mapping differentiates the thematic focus along the same thematic categories as the first one. The larger dots indicate the locations of lead partners, whilst the smaller dots indicate the locations of the project partners. The network lines show the links between the lead partner and all partners of a project. However, they do not show the links amongst the project partners since the cooperation intensity can be far weaker. This mapping reveals the spatial characteristics of the networks with the locations and concentration patterns of the involved partners as well as the territorial context. The visualisation of nine thematic maps facilitates reflection on the extent to which cooperation geographies are specific to a certain theme.
Figure 3. Project networks by thematic representation. Source: KEEP DB, programme and project webpages
Before going into a more detailed interpretation, the findings can be discussed along the thematic axes.
Tourism: The project networks related to tourism – defined by the lead partners and project partners – are mostly located in a short distance from the border. Touristic projects are present in most parts of the study area. The densities of lead partners in the southern and eastern border regions are significantly higher than those in the western and northern regions. This pattern links back to information from the first institutional mapping (), which indicates that tourism projects tend to be larger in the western border regions. The high density of relatively large project networks in the Baltic area is obvious. A closer look at the location of the project institutions reveals that lead partners are often located in rural areas.
Culture: Projects on cultural topics show a stronger presence in the eastern and southern regions. Joint legacies (i.e. traditional mining industry in the Saxony/Czech Republic border region) and the reduction of language barriers play an important role here. However, the cooperation intensity in this thematic is rather low in the overall mapping. A few programmes cover nearly all projects in this field. Similar to the pattern of tourism, projects in the eastern programme areas tend to be smaller, whereas those in the western programme areas tend to be large-scale projects.
Health: The health theme is characterised by a strong northwest/southeast divergence. In the South Baltic and Bavaria-Austrian areas, this theme does not play a role at all. However, in the other programmes, the overall spatial pattern shows a rather large extension, with a series of project partners located beyond the official programme perimeter. The project descriptions reveal that the western border areas focus mainly on medical research or industrial health management, whereas cooperation networks in the rural areas on Germany’s eastern border tend to focus on the areas of sports, elderly care and the expansion of cross-border rescue services.
Economy & Research: The topics of economy and research are characterised by large-scale networks that show a high intensity of cooperation, particularly in the northeast programmes. The networks also tend to extend beyond programme perimeters, while the spatial proximity to the border tends to be lower than for other topics. The very high density of cooperation networks in the border region with the Netherlands is particularly striking. Here, we find a concentration of large projects with many partners. The eastern cooperation networks tend to be of rather regional character, with few partners per project.
Governance: The cooperation patterns for governance show a higher relevance in the eastern and southern programmes. Governance-related projects tend to be more commonly present in the border areas with lower cross-border cooperation historicity, particularly considering the time of EU accession. Border regions with a rather low form of institutional cross-border cooperation provide a higher percentage of financial resources and project capacities for cross-border governance measures.
Environment: The project networks related to environmental topics are among the most numerous. Although they are spread rather evenly across the INTERREG programme areas, a higher concentration is evident along the German-Dutch border, with lower concentrations towards Poland and Austria. The networks show a relatively large spatial pattern, with project actors being located in both urban and rural areas.
Agriculture and Forestry: The thematic area of agriculture and forestry has a rather low relevance in terms of financial share and number of projects. They are concentrated predominantly in the West where they tend to concentrate near the border. The networks in the south-eastern regions are clearly larger.
Spatial Development and Transport: This cooperation topic includes mobility, spatial planning and architecture. In the western border regions, the networks are characterised by geographically larger perimeters with numerous project partners. In the eastern border regions, a higher number of projects is carried out with fewer project partners. Moreover, the spatial pattern indicates a high relevance of actors located in urban areas for spatial development activities.
Society: A broad range of topics characterises the societal theme. In the western border areas, topics often relate to the labour market and education, whereas the focus is primarily on security, youth and voluntary work in the eastern border areas. Cooperation networks are present in all INTERREG programme areas, except for the South Baltic and Bavaria-Austria programmes.
As an interim conclusion, it can be stated that the content foci of cooperation are linked to different spatial patterns. Spatial extension and the density of networks differ along with varying distances to the borders and to urban centres. Several of the thematic mappings show an East–West gradient (e.g. health or agriculture).
While the spatial illustrations shown above reveal several obvious patterns, the interpretation is not self-evident. The simple co-occurrence of, for example, a spatial network pattern and a thematic priority does not necessarily imply correlation or causality. Furthermore, the institutional mapping of cooperation patterns is only helpful if it allows insights beyond description. In the following chapter, we explore the interpretative dimension of the mappings from different perspectives.
5. Discussion and explanatory reflection
5.1. Relevance of cooperation maturity
The involved cooperation programmes differ in numerous dimensions, and several perspectives help to explain these differences. In practice, programme implementation relies on bottom-up processes of project development and on the decision making of the steering / monitoring committees and programme secretariats. These processes are influenced by general political, historical and territorial contexts. The temporal perspective is important and touches upon political legacies and path dependencies. This is true for European integration in general since cross-border functioning has now been an issue for many decades on the western borders. Along the Iron Curtain, cooperation at the regional level only became a relevant option after its opening. The INTERREG programmes were established in 1990 and have been continuously enlarged and broadened since then. For our study regions, the following applies:
o Countries along the western borders are ‘classical’ INTERREG countries that have participated from the first day and built on long-standing cooperation experience from the preceding decades. This is true for the EU founding countries of Belgium, the Netherlands, Luxembourg and France, as well as Denmark (an EU member state since 1973).
o The situation is different for Switzerland and Austria in the south of the study area. Austria only joined the EU in 1995. Even if cross-border cooperation is not a major challenge in terms of language and political constellations in general, the formal establishment of cross-border governance is a comparably new issue. Although Switzerland is not a formal EU member state, Swiss actors can participate in INTERREG projects as regular members, even if the financial organisation is different.
o The eastern countries of Poland and the Czech Republic immediately joined the INTERREG programmes after the fall of the Iron Curtain. The approach to regional policy was then fundamentally altered throughout transformation processes. Cross-border cooperation in these areas is characterised by rather high institutional differences and significant language barriers.
The institutional mappings visualise the relevance of these different maturity statuses:
o A higher cooperation maturity tends to come with higher budgets per project. The cooperation programmes with PL, CZ, AT and CH tend to have smaller project budgets than the western programmes (see ). In many cases, project funding is proportional to programme funding. Additionally, more cooperation experience leads to more professional project management structures and more robust cooperation axes. Less experienced INTERREG actors might find it helpful to gather experience in smaller settings. Moreover, the lower shares of co-funding are linked to the lower wealth level in transformation states.
o The ‘younger’ cooperation areas have a slightly higher emphasis on the thematic areas of tourism, culture and governance than the more experienced regions. Whereas governance explicitly helps to develop cooperation structures, the rather ‘soft topics’ of tourism and culture can be seen as appropriate fields for testing cooperation culture. The western cooperation areas have a stronger focus on the economy, environment, spatial development and – somewhat surprisingly – agriculture and forestry. These areas seem to require higher levels of cooperation experience.
5.2. Relevance of state organisations (central/federal)
The institutional mappings shown above must be interpreted as an outcome of the complex intertwined institutional dynamics throughout the multi-level communications. INTERREG cooperation dynamics are embedded in multi-level governance settings. The European institutions, national governments, regional authorities and cross-border actors (e.g. Euregios, Association of European Border Regions) interact in manifold ways. This differs throughout the policy cycle since the negotiation of the overall budget involves the European Parliament and the national representatives to a much higher extent than the implementation phase. The latter phase is largely located at the lower institutional levels. While project development is mainly a bottom-up process, options are limited by the framework and the committees and secretariats have formal and informal policies. Thus, the institutional mappings cannot capture all relevant details. For example, it is difficult to elaborate the extent to which thematic priorities are based on intentions of the European, national or regional level. As shown above, the official programme priorities and the de facto thematic orientation are not fully congruent, which illustrates the underlying dynamics.
However, the overall patterns of the institutional mappings can be linked to the types of state organisation in the involved countries. The federal elements in Germany are strong, and the neighbouring countries clearly differ in this respect. Notably, two of the programmes amongst the federalist countries (AT-DE and ABH) have rather lower programme volumes and show quite sharp thematic profiles. It must remain open whether this is an expression of particularly tailor-made territorial approaches or rather limited administrative ambitions when compared to other settings. On the other hand, cooperation patterns differ so greatly that the type of state organisation cannot be seen as a key explanatory factor, but rather as one element amongst others.
5.3. Relevance of spatial contexts
As previously mentioned, the border regions with German involvement cover a broad range of spatial structures. The western border areas tend to be more urbanised. In fact, they are part of a ‘corridor’ of partly metropolitan border regions in Europe (cf. ESPON Metroborder Citation2010: 8ff.). A higher degree of urbanisation comes along with a higher density of population, institutions and potential project actors. If we confront the spatial cooperation patterns (density and geographical extension) with the territorial context of the border regions (urbanisation degree), the following can be stated: It is trivial to state that the more urbanised a region is, the more cooperation we find. However, it is relevant to note that the more urbanised a region is, the more specialised the topics and the larger the project networks we tend to find. The metropolitan setting comes with a higher presence of specialised actors in research and consultancy (i.e. potential INTERREG partners). Furthermore, in metropolitan regions, the economic sector tends to have a higher share of innovation capacity and headquarter functions. Against this background, it is no surprise that the INTERREG programmes Germany-Netherlands, Greater Region, Meuse-Rhine and Germany-Denmark have a higher financial share in the fields of economy and research as well as health. This leads to the question of whether greater cooperation experience or the degree of urbanisation can be seen as explanatory factors. While both are plausible, their combination is certainly most probable. Further analyses have to delve deeper into this topic.
5.4. Methodological reflection
The presented approach shows the strengths and limitations of both the KEEP data and the institutional mapping tool. Firstly, some concerns remain regarding the quality and completeness of KEEP data. Depending on the analytical focus, a certain effort of data quality management is necessary. In our study, a systematic check and correction of geographical information were necessary based on information available online. Under this condition, a data accuracy of more than 90% is feasible. A database of such quality and quantity holds massive potential for the understanding of cross-border governance and will improve with every funding period.
Nevertheless, when it comes to longer time series and local zoom-in analyses, the data concerns become more serious. In these cases, desktop research might not be sufficient. Thus, it must be complemented with original data gathering, in particular via expert interviews and document analysis.
Secondly, the spatial dimension of the involved institutions (partners, lead partners) simply maps addresses – thus applying a simple ‘container space’ approach. This can be misleading since the spatial characteristics of these institutions can be very different. A chamber of commerce has its official area of responsibility, whereas a cultural initiative might focus on one built spot, and a technical research institution might be specialised in one topic of dynamic global interactions. These overlaps and nested spatialities tend to be neglected in mappings of the presented way.
Thirdly, indicators of cooperation capture complex interactions and thus simplify them to a certain extent. Budgets, addresses and thematic orientations are much easier to capture than questions of institutional power and hidden conflicts. When the research focus lies on contested forms of territoriality and overcoming a national bias, official cooperation data is not the most meaningful data (cf. Sassen Citation2013). This is a limitation for critical border studies that focus on political taboos and hidden agendas. Obviously, there is a certain danger of ‘data-driven research’ and blind spots.
These critiques call for the combination and completion of institutional mappings using additional approaches. This applies to complementary data gathering, completion and quality assurance. Regional and thematic in-depth analyses have the potential to go beyond official data and reveal a deeper understanding of cross-border functioning. Quantitative data sets beyond project structures (e.g. performance indicators of the programme or local development indicators) would allow for statistical correlation tests.
Even if the challenges of using KEEP data in institutional mapping are considerable, the potential and strengths of its use cannot be neglected. First and foremost, institutional mappings provide an effective and efficient tool for data exploration. This treatment of heterogeneous and complex data sets can visualise important patterns and provide meaningful pictures.
Secondly, the high accessibility in terms of easy and intuitive comprehensibility holds great potential for political processes. The reflection of funding policies on all levels can profit from this type of input (programming, evaluation, implementation strategies).
Thirdly, and despite all shortcomings, institutional mappings allow for highly instructive comparative analyses. Our study provided a comparative perspective on 13 programmes with the involvement of nine countries. The comparative perspective and the combined reflection of different dimensions (project size, priorities, spatial networks) forms a solid basis for more differentiated analyses.
6. Conclusion
The presented study highlights the relevance and potential of (a) localised cooperation data from the EU KEEP database and (b) ‘institutional mapping’ as a visualisation approach. The institutional mapping of KEEP data has proven to be a strong tool for data exploration with great potential for comparative analyses; however, it has clear limitations with regard to causality testing. Future research would benefit from complementing the KEEP data with further data sources, such as specific information on project dynamics (e.g. collected via information gathering in expert interviews and qualitative analyses). Furthermore, there is a great need for research using quantitative methodologies in this field. With standardised information on the implementation processes and fine-scale data on regional development, KEEP data can be complemented to test the success factors of cross-border cooperation.
In this period of rapid digitalisation, the increasing popularity of public data and visualisation approaches is strong. In terms of institutional mapping, interactive applications hold unexploited potential for methodological applications. While existing approaches mostly serve to present results, they could also be used as a starting point for the calibration, differentiation and development of indicative results with stakeholders.
The new funding period coinciding with an ongoing pandemic situation represents a challenge for current cross-border policies (COR Citation2020) since cross-border cooperation is a rather soft instrument during difficult times. Further improvement of analytical insights is certainly an urgent need. In this context, institutional mapping with the use of KEEP data can provide a significant contribution.
Disclosure statement
No potential conflict of interest was reported by the author(s).
Notes
2 For the official priorities see https://ec.europa.eu/regional_policy/en/policy/how/priorities
References
- Andersen, D. J., and E. Prokkola. 2022. “Introduction: Embedding Borderlands Resilience.” In Borderlands Resilience. Transitions, Adaptation and Resistance at Borders. Border Region Series, edited by D. J. Andersen, and E. Prokkola, 1–18. London: Routledge. doi:10.4324/9781003131328
- Berzi, M. 2017. “The Cross-Border Reterritorialization Concept Revisited: The Territorialist Approach Applied to the Case of Cerdanya on the French-Spanish Border.” European Planning Studies 25 (9): 1575–1596. doi:10.1080/09654313.2017.1321622.
- BMVI – Bundesministerium für Verkehr und digitale Infrastruktur. 2017. Raumbeobachtung Deutschland und angrenzende Regionen –Räumliche Strukturen und Verflechtungen. MORO Praxis 11. https://www.bbsr.bund.de/BBSR/DE/veroeffentlichungen/ministerien/moro-praxis/2017/moro-praxis-11-17.html
- Borges, J. A. R., S. Neuberger, H. Saatkamp, A. O. Lansink, and D. Darr. 2021. “Stakeholder Viewpoints on Facilitation of Cross-Border Cooperation.” European Planning Studies 30 (4): 627–642. doi:10.1080/09654313.2021.198806.
- Borowicz, A., and M. Pachocka. 2019. “Cross-Border Cooperation Projects under INTERREG in the EU-15 Member States in 2000–2020.” Eurolimes 27/28: 65–83. https://www.ceeol.com/search/article-detail?id=827543
- Bufon, M. 2011. “Cross-Border Policies and Spatial and Social Integration: Between Challenges and Problems.” European Spatial Research and Policy 18 (2): 29–45.
- Caesar, B., and K. Pallagst. 2018. “Spatial Development Concepts – A Cross-Border Planning Instrument with a Future?” Experiences from the German Borderlands. Borders in Perspective – UniGR-CBR Thematic issue 1: 9–20. https://ubt.opus.hbz-nrw.de/opus45-ubtr/frontdoor/deliver/index/docId/1068/file/UniGR-CBS_Borders+in+Perspective_thematic+issue+Vol.1.pdf
- Capello, R., A. Caragliu, and U. Fratesi. 2018. “Breaking Down the Border: Physical, Institutional and Cultural Obstacles.” Economic Geography 94 (5): 485–513. doi:10.1080/00130095.2018.1444988.
- Chilla, T., E. Evrard, and C. Schulz. 2012. “On the Territoriality of Cross-Border Cooperation: Institutional Mapping in a Multi-Level Context.” European Planning Studies 20 (6): 961–980.
- Chilla, T., F. Sielker, and F. Othengrafen. 2017. Governance Diffusion in Europe –The EGTC Tool and its Spatial Implementation Patterns. Working Paper No. 2. URL: http://blogs.fau.de/regionalentwicklung/wp2-governance-diffusion
- Colomb, C. 2018. “ A European Perspective on Anglo-Scottish Cross-Border Cooperation: Lessons from EU-Funded Territorial Cooperation Programs.” Journal of Borderlands Studies 33 (1): 103–122. doi:10.1080/08865655.2016.1267585.
- COR. 2020. European Cross-Border Citizens’ Alliance. Available at: https://ec.europa.eu/eusurvey/runner/European-Cross-Border-Citizens-Alliance
- De Sousa, L. 2012. “Understanding European Cross-Border Cooperation: A Framework for Analysis.” Journal of European Integration 35 (6): 669–687. doi:10.1080/07036337.2012.711827.
- Décoville, A., and F. Durand. 2021. “An Empirical Approach to Cross-Border Spatial Planning Initiatives in Europe.” Regional Studies 55 (8): 1417–1428. doi:10.1080/00343404.2021.1902492.
- Dörry, S., and A. Décoville. 2016. “Governance and Transportation Policy Networks in the Cross-Border Metropolitan Region of Luxembourg: A Social Network Analysis.” European Urban and Regional Studies 23 (1): 69–85.
- Esparza-Masana, R. 2020. “Analysis of European Interregional Cooperation under Interreg Programmes.” The Case of Spain. Investigaciones Regionales - Journal of Regional Research 2020/2 (47): 5–28. doi:10.38191/iirr-jorr.20.008.
- ESPON Metroborder. 2010. Metroborder - Metropolitan Polycentric Cross-Border Regions, https://www.espon.eu/metroboarder
- ESPON ACTAREA. 2017. ACTAREA - Thinking and Planning in Areas of Territorial Cooperation, https://www.espon.eu/actarea
- EU COM. n.y. Cooperation Programmes 2014-2020, Online: https://ec.europa.eu/regional_policy/de/policy/cooperation/european-territorial/cross-border/#4
- Frątczak-Müller, J., and A. Mielczarek-Żejmo. 2020. “Networks of Cross-Border Cooperation in Europe – the Interests and Values. The Case of Spree–Neisse–Bober Euroregion.” European Planning Studies 28 (1): 8–34. doi:10.1080/09654313.2019.1623972.
- Fricke, C. 2015. “ Spatial Governance across Borders Revisited: Organizational Forms and Spatial Planning in Metropolitan Cross-Border Regions.” European Planning Studies 23 (5): 849–870. doi:10.1080/09654313.2014.887661.
- Harguindéguy, J. B., and Z. Bray. 2009. “Does Cross-Border Cooperation Empower European Regions? The Case of Interreg III-A France–Spain.” Environment and Planning C: Government and Policy 27 (4): 747–760. doi:10.1068/c08119.
- Kaucic, J., and C. Sohn. 2021. “Mapping the Cross-Border Cooperation ‘Galaxy’: An Exploration of Scalar Arrangements in Europe.” European Planning Studies, 1–21. doi:10.1080/09654313.2021.1923667.
- Klatt, M., and I. Winkler. 2020. “Lessons from the Danish-German Border Region for Post 2020 Interreg A – an Alignment with Cross-Border Functional Regions?” Europa XXI 38: 139–156. doi:10.7163/Eu21.2020.38.5.
- Knippschild, R., and A. Vock. 2017. “The Conformance and Performance Principles in Territorial Cooperation: A Critical Reflection on the Evaluation of INTERREG Projects.” Regional Studies 51 (11): 1735–1745. doi:10.1080/00343404.2016.1255323.
- Kurowska-Pysz, J., and K. Szczepańska-Woszczyna. 2017. “The Analysis of the Determinants of Sustainable Cross-Border Cooperation and Recommendations on Its Harmonization.” Sustainability 9 (12): 2226. doi:10.3390/su9122226.
- Makkonen, T., and S. Rohde. 2016. “Cross-border Regional Innovation Systems: Conceptual Backgrounds, Empirical Evidence and Policy Implications.” European Planning Studies 24 (9): 1623–1642. doi:10.1080/09654313.2016.118462.
- Makkonen, T., T. Williams Mitze, and A. Weidenfeld. 2018. “Science and Technology Cooperation in Cross-Border Regions: A Proximity Approach with Evidence for Northern Europe.” European Planning Studies 26 (10): 1961–1979. doi:10.1080/09654313.2018.1500528.
- Martín-Uceda, J., and J. Vicente Rufí. 2021. “Territorial Development and Cross-Border Cooperation: A Review of the Consequences of European INTERREG Policies on the Spanish–French Border (2007–2020).” Sustainability 13: 12017. doi:10.3390/su13211201.
- Nienaber, B., and C. Wille. 2020. “Cross-border Cooperation in Europe: A Relational Perspective.” European Planning Studies 28 (1): 1–7. doi:10.1080/09654313.2019.1623971.
- Noferini, A., M. Berzi, F. Camonita, and A. Durà. 2020. “Cross-Border Cooperation in the EU: Euroregions Amid Multilevel Governance and re-Territorialization.” European Planning Studies 28 (1): 35–56. doi:10.1080/09654313.2019.1623973.
- Opiłowska, E. 2020. “The Covid-19 Crisis: The end of a Borderless Europe?” European Societies 23 (1): 589–600. doi:10.1080/14616696.2020.1833065
- Plangger, M. 2019. “Exploring the Role of Territorial Actors in Cross-Border Regions.” Territory, Politics, Governance 7 (2): 156–176. doi:10.1080/21622671.2017.1336938.
- Pupier, P. 2020. “Spatial Evolution of Cross-Border Regions. Contrasted Case Studies in North-West Europe.” European Planning Studies 28 (1): 81–104. doi:10.1080/09654313.2019.1623975.
- Purkarthofer, E. 2016. “When Soft Planning and Hard Planning Meet: Conceptualising the Encounter of European, National and sub-National Planning.” European Journal of Spatial Development 61: 1–20. https://archive.nordregio.se/Global/EJSD/Refereed%20articles/Refereed61.pdf
- Reitel, B., B. Wassenberg, and J. Peyrony. 2018. “The INTERREG Experience in Bridging European Territories.” In A 30-Year Summary, edited by E. Medeiros, 7–23. Cham: European Territorial Cooperation. The Urban Book Series. Springer. doi:10.1007/978-3-319-74887-0_2
- Sassen, S. 2013. “When Territory Deborders Territoriality. Territory, Politics.” Governance 1 (1): 21–45. doi:10.1080/21622671.2013.769895.
- Varró, K. 2016. “Recognising the Emerging Transnational Spaces and Subjectivities of Cross-border Cooperation: Towards a Research Agenda.” Geopolitics 21 (1): 171–194. doi: 10.1080/14650045.2015.1094462.
- Wassenberg, B., B. Reitel, J. Peyrony, and J. Rubió. 2015. Territorial Cooperation in Europe A Historical Perspective. Brussels: EU Publications. doi:10.2776/79151