
ABSTRACT
The cross-border practices of people beyond migration and tourism are often overlooked. However, the increase of frequent social interactions and mobilities of people crossing country borders for work, shopping, services and leisure contribute to (re)shaping functional cross-border regions. We propose a conceptual framework using a big data approach to provide new insights from the individual-level cross-border mobility of people. We used Twitter data as a promising transnational data source to empirically examine who, when and where the borders are crossed in the case of Luxembourg – one of the busiest cross-border regions in Europe. Special attention has been given to cross-border commuters. We evaluated our findings to demonstrate the feasibility of the proposed approach as the proof-of-concept for cross-border research. We mapped prospects and challenges to improve the operationalization of the proposed approach relevant to cross-border research and shared our source code to encourage further method development. Finally, we have highlighted how this information from social media data can benefit research and practice for policy and planning in cross-border regions.
Introduction
Mobility and migration are global megatrends in our contemporary world that concern us all. According to the ‘new mobilities’ paradigm (Sheller and Urry Citation2006), our society is about constant mobilities and interactions of everything – people, objects, information – that transcend country borders and constitute to the global network society (Castells Citation1996). Each year we witness over 0.2 billion international migrants (United Nations Citation2017) and 1.4 billion travellers undertaking international overnight trips worldwide for leisure and business (World Tourism Organization Citation2018), and both are growing.
In addition to migration and tourism, another cross-border mobility form has emerged – recurring and frequent mobilities crossing country borders for work, shopping, services and leisure – as individuals’ daily life practices and social networks become less confined to a fixed territory of one country (Carling, Erdal, and Talleraas Citation2021; Gerber Citation2012). Daily mobilities and social practices across borders transform the geographies of social networks and increase cross-border social interactions (Collins Citation2009). Further, these daily bordering practices of people from both sides of a country border contribute to the production of new functional transnational spaces (Jackson, Crang, and Dwyer Citation2004) – geographical regions from different countries forming one functioning system.
For example, cross-border interaction and integration is a key issue in balanced and sustainable spatial cohesion within the EU. Over 20 million (4%) of EU residents work in another EU country, while two million residents commute daily across country borders to work (European Commission Citation2017). Since around 150 million residents live close to country borders, there is a vast potential of increasing routine and constant cross-border practices that contributes to transnational regions in the EU. Similar cross-border interactions can be seen around the globe, yet in varying contexts (Gutiérrez et al. Citation2021).
Regardless of its growing importance, little attention has been paid to cross-border practices beyond migration – frequent spatial mobilities and social interactions of people across national borders from an individual perspective, and how these affect people and societies involved (Conradson and Latham Citation2005; Gerber Citation2012; Ramirez and Winkler Citation2012). One reason is that the focus is mainly on places rather than flows of mobilities and social interactions by people (Harrison and Growe Citation2014). Another reason is that we lack suitable (quantitative) methods to provide such information (Ortúzar et al. Citation2011).
This constitutes a hindrance for scholars seeking to understand increasingly important border-ignorant socio-spatial phenomena that shape societies, and for policymakers to foster spatial planning and development of functional transnational spaces in Europe (Moisio Citation2011; Pupier Citation2020). For example, we could use timely tools to capture de facto functional regions (Rodríguez, Molina, and Camacho Citation2022; Silm et al. Citation2020b) and the influence of societal disruptions such as the COVID-19 pandemic on the cross-border mobility of transnational people (Docquier et al. Citation2021; Järv et al. Citation2021), or to understand cross-border integration and borders as resources from the perspective of people (Decoville and Durand Citation2018).
To overcome the current bottlenecks in knowledge and methods in capturing cross-border mobilities and interactions of people, we propose to use novel data obtained from mobile devices as proxies for people. This approach offers a complementary opportunity to reveal people’s spatial and social bordering practices given that: (1) people have globally adopted mobile devices as part of daily life (Kemp Citation2019), and (2) the implementation of big data as a reliable data source in social sciences is thriving (Kitchin Citation2014). The growing literature demonstrates the validity and feasibility of this approach in revealing human mobilities (González, Hidalgo, and Barabási Citation2008; Järv, Ahas, and Witlox Citation2014). More importantly, the nature of some big data sources like social media data is inherently transnational (Hawelka et al. Citation2014).
In this paper, we sought to contribute to the research on cross-border regions by introducing the potential of big data sources to provide new insights through the prism of cross-border interactions of people. Therefore, we: (1) proposed a conceptual framework using a big data approach to provide new insights about cross-border mobilities of people, in general; and (2) operationalized the framework to demonstrate empirically its feasibility regarding social media data as the proof-of-concept for cross-border research. For this, we used Twitter data as a promising transnational data source and investigated one of the busiest cross-border regions in the EU – the Greater Region of Luxembourg (hereinafter, the GRL), as our case study area. We examined those who are crossing borders, when and where borders are crossed and how these have changed over time. We paid special attention to cross-border commuters.
Finally, we discuss our findings to evaluate the feasibility of the big data approach for cross-border research by contextualizing findings with existing research and scientific knowledge. We further map prospects and challenges of the approach in cross-border research and propose potential benefits for research and practice on policy and planning of border regions. By openly sharing the source code of our methodology, as part of this paper, this serves as a valuable basis for improving the research and take advantage of big data in understanding cross-border regions.
Capturing mobility from big data
Mobilities in space and over time enable us to understand how the daily lives of people take place and how society functions (Hägerstrand Citation1970; Kwan Citation2013; Sheller and Urry Citation2006). In the past, detailed empirical research on individual mobility in space and time has been limited by the data collection methods (like surveys and registers) that were available, yet it is rapidly advancing in line with the use of novel big data sources (Järv, Ahas, and Witlox Citation2014; Wang, He, and Leung Citation2018b). Big data is a complementary source for a better understanding of people, society and space from new perspectives (Martí, Serrano-Estrada, and Nolasco-Cirugeda Citation2019; Poorthuis and Zook Citation2017; Toivonen et al. Citation2019). One complementary perspective is through human mobility – the ability to capture the dynamic nature of our society and people.
Mobility can be seen as a tool to understand society (Kaufmann Citation2014). People use mobile devices constantly – mobile phones and their applications, credit cards, public transport cards and other ‘smart’ wearables – that are always carried around and producing information about their whereabouts in space and time. Thus, conceptually, we can consider each mobile device as a proxy for an individual, and digital traces of each device over time as an indicator of an individual’s digital footprint revealing their presence in physical space (Ahas et al. Citation2010; González, Hidalgo, and Barabási Citation2008).
To date, human mobility research based on big data sources has relied on GPS tracking, mobile phone positioning and smart card-based data (Silm, Järv, and Masso Citation2020a; Wang, He, and Leung Citation2018b; Yue et al. Citation2014). In recent years, human mobility is being derived from social media applications such as Facebook, Twitter and Google Location History (Rashidi et al. Citation2017; Ruktanonchai et al. Citation2018; Spyratos et al. Citation2019). Certainly, some big data sources are more feasible for studying aspects of human mobility depending on what mobility type is being investigated, and at what spatial scale and temporal frequency (Ruktanonchai et al. Citation2018).
Given the strength of social media data being theoretically inherently transnational – data are not restricted to administrative boundaries or to a certain mobile operator’s network coverage – they can provide a unique understanding about human mobility from an international perspective (Docquier et al. Citation2021; Hawelka et al. Citation2014; Toivonen et al. Citation2019).
Mobilities and cross-border context
From a broader geographical scope and beyond country borders, mobile phone data and social media data sources can be used to study mobility. The literature is expanding, while advancing both theoretical conceptualization and methodology, studies focus broadly on two international mobility forms: tourism and migration.
The mobility of tourists on a large scale is revealed at a very detailed level by using mobile phone roaming data – data produced while using a mobile phone abroad (Ahas et al. Citation2008). This enables a detailed overview about flows of inbound tourists into a destination country, outbound tourists visiting abroad and even providing official tourism statistics (Raun, Ahas, and Tiru Citation2016; Saluveer et al. Citation2020). Social media data are used extensively for studying the mobility of international tourists. On a global scale, Hawelka et al. (Citation2014) showed the feasibility of tourism flows at the country level using Twitter data. On a more accurate spatial scale, studies by Chua et al. (Citation2016) and Hasnat and Hasan (Citation2018) have examined foreign tourists’ mobility within a destination country from spatial and temporal perspectives by processing Twitter data.
Much work on migration has been based on social media. Global migration pattern estimation by Zagheni et al. (Citation2014) using Twitter data and by Spyratos et al. (Citation2019) using Facebook data have both shown promising results on revealing trends in migration flows at country level. By focusing on a certain event with more precise geographical scale, Mazzoli et al. (Citation2020) showed how Twitter data can reveal also migrants’ routes and temporary residences in destination countries. However, the implementation of big data analytics in global migration monitoring and management is still complicated and is a sensitive matter that requires further research (Beduschi Citation2020). More systematic attempts are needed to measure labour mobility and estimate migration within the EU countries using social media sources (Gendronneau et al. Citation2019).
On the other hand, research on frequent cross-border mobility from big data sources has received less attention. In one of the first studies, Blanford et al. (Citation2015) focused on cross-border mobility from a space–time perspective from Twitter data. Recently, Silm et al. (Citation2020b) used roaming mobile phone data to reveal frequent cross-border movements and identify bordering population groups.
That said, big data sources have not yet received much attention for capturing the cross-border mobility and spatial behaviour of transnational people. Given the conceptual and methodological deficiencies identified in studies using traditional data collection methods for studying cross-border mobilities (Drevon et al. Citation2018; Gerber Citation2012), in this paper, we have addressed the potential of social media data for mitigating some of these gaps in cross-border mobility research.
Conceptual framework
To obtain new insights on the cross-border mobilities of people and to define further who the people are that cross country borders from social media, requires a bottom-up approach stemming from the concept of individual activity spaces and travel behaviour (Järv, Ahas, and Witlox Citation2014; Schönfelder and Axhausen Citation2010) for three reasons.
First, by only collecting geolocated social media data (e.g. Tweets) from a study area will not reveal social media users’ overall digital footprints and it remains difficult to know to what extent we capture their footprints that indicate their activity space. Thus, users’ entire digital footprints need to be collected to reveal their entire activity space including place of residence (e.g. locals or non-locals). Second, metadata from social media data may include self-reported information about the place of residence, but this information might also be absent, outdated or arbitrarily reported, and therefore not reflecting reality. Thus, we need to reveal the actual activity space from digital footprints to determine the most likely de facto place of residence.
Third, deriving human mobility from geolocated social media data within a study area without knowing their entire mobility patterns would limit the estimating of reasons for crossing borders. Instead, we need to examine both the place of residence and overall movement patterns to reveal who constitute mobility flows across borders and why – e.g. whether local people cross borders for occasional trips (e.g. leisure and shopping) or because they are frequent cross-border commuters.
Therefore, we propose a conceptual analysis framework to study cross-border mobilities based on social media data from an individual activity space perspective by making big data small and meaningful (Poorthuis and Zook Citation2017) and use mobility as a tool to capture individual activity spaces (Kaufmann Citation2014). The basis of the framework is a two-step data collection stage, in which the first step selects a study sample by identifying people visiting the area of interest – at least one geolocated social media post in the study area is an indicator of being present. In the second step, all individual posting history of the study sample is collected regardless of its locations to identify individuals’ entire activity spaces (, upper row).
Figure 1. The conceptual framework of data collection and data enrichment using the activity space approach to reveal cross-border mobilities and its motives from an individual perspective.
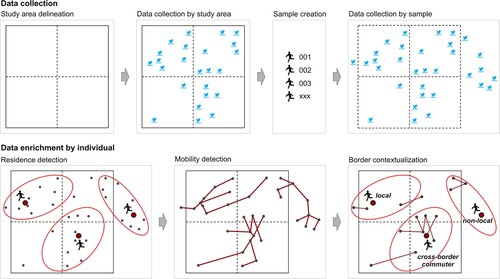
The second stage is data enrichment to contextualize elements of an activity space from the cross-border perspective (, lower row). First, determining individuals’ place of residence and determining locals from non-locals. Second, by identifying individuals’ mobility patterns, the proportion of cross-border mobility pattern from the overall mobility pattern, can be used to determine the relevance of cross-border mobility in individuals’ lives. Finally, enriched data enables revealing who constitutes cross-border mobilities and why.
Empirical case study: Luxembourg
One vivid example of a significant cross-border mobilities is the Greater Region of Luxembourg (the GRL). Being one of the busiest cross-border regions in the EU, the GRL officially includes five regions from four countries: The Grand Duchy of Luxembourg, Belgium, Germany and France (). Here, European integration policies such as the free movement of individuals within the Schengen Area and the common Euro currency are stimulating inter-regional economic transactions, and socio-economic divergences between wages and costs of living have created a significant cross-border mobility of people especially across the borders of Luxembourg (Drevon et al. Citation2018; Gerber Citation2012).
Figure 2. The study area of Luxembourg situated within the official delineation of the Greater Region of Luxembourg, and our extended GRL definition used in this study.
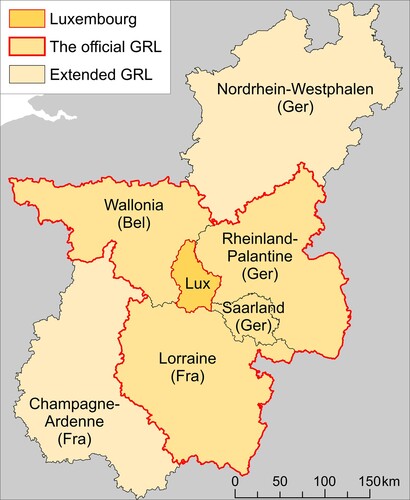
With its 11.6 million inhabitants, the region is one of the largest cross-border labour markets in the EU and hosts the highest number (ca 250,000) of cross-border commuters in Europe. The predominant destination for work-related commuting is Luxembourg with over 200,000 commuters (STATEC Citation2021). Overall, many aspects of cross-border mobility for work, daily shopping and services, and tourism have been well studied from the perspective of Luxembourg (Decoville and Durand Citation2018; Drevon et al. Citation2018; Gerber Citation2012; Pierrard Citation2008; Schmitz, Drevon, and Gerber Citation2012). Thus, it provides an excellent setting for comparing and validating our study findings obtained from social media data like Twitter (see Discussion).
Regarding the conceptual framework in focusing on the de facto daily lives of people instead of de jure administrative borders of the official GRL, we extended our initial study area by adding two regions – Champagne-Ardenne in France and Nordrhein-Westphalen in Germany – to capture the functional GRL from people perspective better (). Despite the extension, we have continued to refer to the extended study area as the GRL for clarity.
Data and methods
Data collection. We used Twitter data as currently the only openly available global social media source providing an individual-level data intended for academic research (Twitter Inc Citation2022). We built on our conceptual framework by first selecting Twitter users who had posted a geographically located (geotagged) Tweet at least once within Luxembourg or within a 50 km radius of the country’s borders from July 2012 until September 2018. The input data were a combination of geolocated Tweets from the DOLLY database (Poorthuis and Zook Citation2017) from July 2012 until January 2016 and more recent Tweets collected from the publicly available Twitter API (February 2016–September 2018) by making use of an open data collection tool (Väisänen et al. Citation2021b). By combining both datasets we obtained around 67,000 unique users from the period. In the second step, we collected all their Tweet histories from November 2006 until January 2020 – the initial dataset comprises 28 million geotagged Tweets ().
Table 1. Description of used Twitter data.
Residence detection. We determine the residence of Twitter users in three stages to capture cross-border people. First, we defined residence country as the country with highest number of unique weeks with geolocated Tweets from a user’s Tweet history as one of the best performing residence detection methods (Heikinheimo et al. Citation2022). Here we dealt with the GRL () as though it were a separate spatial unit like a ‘country’ to capture better people whose daily lives take place across country borders within the GRL. Next, we selected Twitter users whose place of residence was determined to be in the GRL and select only those Tweets located within the GRL. Then we determined the part of the GRL their residences were located in – residence country within the GRL is the one with the highest number of weeks with geolocated Tweets. Finally, an exact residence location was calculated as a median location from Tweets located only in the residence country within the GRL. In total, we identified the residences of 21,659 Twitter users who had visited (≥1 geotagged Tweet) Luxembourg as our study sample ().
Movement detection. For each user we sort geotagged Tweets by date and created a movement line between two consecutive Tweets. Each movement has attributes regarding the Twitter user’s anonymized ID, the spatial locations of origin and destination within the GRL, distance, time and duration. Given that Twitter usage is infrequent activity, especially geotagging Tweets, then a loose definition to movement criteria is used regarding duration of movement – time duration less than 180 days is considered as movement. We are aware that during that period some movements may take place that are not visible in these data. Yet, we are confident that it reveals the main layout of activity spaces of people and the structure of mobility flows at general level as indicated by existing literature (Hawelka et al. Citation2014; Mazzoli et al. Citation2020). We identified over seven million movements (distance ≥ 0 m) from 19,964 Twitter users who visited Luxembourg and classify movements into four types based on start and end locations ().
Table 2. Description of movement data from Twitter users visiting Luxembourg by movement type.
Border crosser typology. Based on overall and cross-border mobility patterns of people, we divided people residing within the GRL region as frequent and infrequent border crossers to distinguish daily cross-border commuters from other locals. We used three criteria to define frequent border crossers: (1) one resides within the GRL; (2) one has more than 15% of movements located within the GRL (both origin and destination); (3) one has more than 15% of movements related to cross-border movements within the GRL so that origin and destination are not located in the same country. Finally, we used three border crosser types in our analysis: ‘cross-border commuter’; ‘other local’ residing in the GRL; and ‘non-local’ residing outside the GRL.
Analysis and validation. Our empirical analysis focused on cross-border movements that start and end within the GRL and cross the Luxembourg border. We examined who constitutes movements by border crosser type, and separately in the case of each border section with the neighbouring country. We examined distances of cross-border movements and their spatial distribution, and how cross-border mobility flows vary by weekday, month and year. We evaluated our results against recent official register data (STATEC Citation2021), openly available data from the Geoportal of the GRL (www.sig-gr.eu) and existing research based on surveys (Schmitz, Drevon, and Gerber Citation2012) regarding residential locations of cross-border commuters and cross-border movement distances.
Finally, to promote open science, we shared the documented source code from the methodology we used regarding data collection and processing (e.g. residence and movement detection, and border crosser classification) in an open-access repository at GitHub. This will promote reproducibility and further improve our methodology (https://doi.org/10.5281/zenodo.6912827).
Results
Who crosses the borders of Luxembourg?
We found that some 32% of all people crossing the borders of Luxembourg during our study period resided in the GRL, whereas all others are non-locals (). Every fifth of those residing in the GRL are cross-border commuters based on their mobility patterns, and almost 95% of all cross-border commuters (n = 1268) commuted to Luxembourg from its neighbouring countries within the GRL.
Table 3. Distribution of Twitter users crossing borders of Luxembourg by their place of residence.
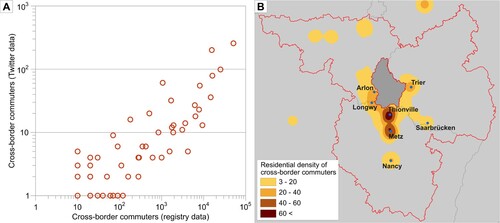
Over half of given cross-border commuters resided in the French part of the GRL (54%), while others were residing in the German and Belgian parts of the GRL (25% and 21%, respectively). This division coincides with the official statistics of cross-border workers in Luxembourg – in 2019 the division was 52%, 24% and 24%, respectively (STATEC Citation2021). Regarding their residence distribution at the municipality level (n = 72), the correlation coefficient between Twitter data and official register data is 0.9 ((A)). Finally, the accurate spatial distribution of estimated residential locations of cross-border commuters from Twitter data ((B)) coincides with existing information (Schmitz, Drevon, and Gerber Citation2012, 9).
Figure 3. The correlation between cross-border workers from official registry data (Statec Citation2021) and daily border crossers from Twitter data at municipality level, n = 72, (A), and kernel density (radius 10 km) estimation of commuters’ residential locations from Twitter data (B).
Who create cross-border mobility flows?
About 85% of all movements that cross Luxembourg borders were constituted by locals residing in the GRL and the rest of the movements (15%) were non-locals who live outside the GRL (). Our results reveal that some 40% of all mobility was created by cross-border commuters.
Table 4. Distribution of movements crossing Luxembourg’s borders by place of residence and border section with neighbouring country during the study period.
Further, the mobility structure of border crossers varied by border sections of Luxembourg (). Cross-border commuters created over 40% of mobility crossing Belgian and French border sections, whereas their proportion was only 30% for the German border section. The significant amount of mobility across the German border was created by local people from Luxembourg (18%) and non-locals (31%). Instead, mobility across the French border section was the least created by non-locals (8%), whereas almost half of the mobility was created by local residence in the French part of the GRL, but who are not cross-border commuters (46%).
How has cross-border mobility structure changed over time?
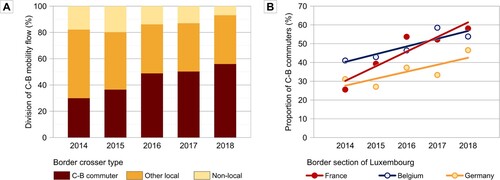
Twitter data can reveal longitudinal trends in cross-border mobility flows. The yearly comparison in cross-border mobility by origin of people reveals long-term structural changes in mobility flows. The five-year period from 2014 to 2018 shows a clear trend – the proportion of cross-border mobility by cross-border commuters increased, whereas the proportion of mobility by non-locals decreased ((A)). Further, the trend was not equal in all border sections of Luxembourg ((B)). The growth stems especially from the French part (increase of 31 percentage points), while the commuters’ proportion increased less in the Belgian and German border sections (increase of 16 and 15 percentage points, accordingly).
Figure 4. Yearly division of cross-border mobility of Luxembourg that remain within the GRL by border crosser type (A), and the relative proportion of cross border mobility of daily commuters by border section of Luxembourg (B).
What temporal dynamics occur in cross-border mobility?
In general, monthly dynamics reveal the seasonal rhythms of overall mobility crossing the borders of Luxembourg. Overall mobility increases by 20% during summer months (June–August) from the yearly average and decreases by 20% during the first few months of the year ((A)). However, monthly dynamics vary according to the type of border crosser. While the mobility of daily cross-border commuters is distributed equally throughout the year, clear seasonal rhythms in mobility by other local people living within the GRL and non-local people occur.
Figure 5. Monthly (A) and weekday (B) variations of mobility crossing the borders of Luxembourg from the average by border crosser type. Cross-border mobility is limited to movements that remain within the GRL.
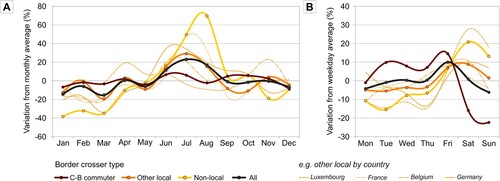
Non-local people having their clear visitation peak in July-August as visitations increase over 50% compared to the monthly average, while lowest visitations occur in January–March. For local people who are not daily commuters, visitations to Luxembourg are concentrated more equally in June–August – mobility during the period increases 15–25% above the monthly average. Furthermore, these locals also have different seasonal patterns in visiting Luxembourg regarding their residence country. People from the Belgian and German side visit Luxembourg especially in June–July, whereas the most active border crossing by French people is in July–August. Local people living in Luxembourg cross borders uniformly throughout the year.
In case of the weekly mobility dynamics of crossing Luxembourg’s borders, it remains stable throughout the week with a peak on Fridays, but the pattern depends on the border crosser type ((B)). The mobility of cross-border commuters is distributed equally on workdays with a clear decrease in weekend mobility, whereas mobility by other local people living within the GRL is concentrated on weekends. In particular, crossing borders of Luxembourg are the most concentrated on weekends by non-locals living outside the GRL and the residents of Luxembourg.
What are the distances and geographical extents of cross-border mobility?
Cross-border movements captured from Twitter data reveal the physical distances and its variability due to the reason for mobility ((A)). Cross-border commuters have the shortest distances (mean 46 km, median 34 km), whereas non-locals from outside the GRL have the longest distances within the GRL (mean 84 km, median 66 km) with the highest variation.
Figure 6. Distribution of cross-border mobility distances by border crosser type (A), by the residence country of cross-commuters (B) and by the residence country of other local people residing within the GRL (C).
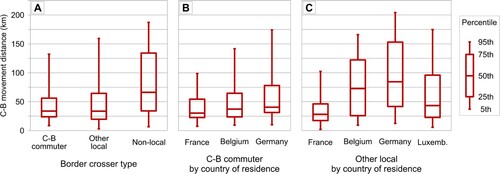
The movement distances of commuters vary according to their residence country (B). The shortest movement distances in crossing border are by those residing in France (mean 40 km, median 30 km). Commuters residing in Belgium have slightly longer distances (mean 52 km, median 37 km) and those residing in Germany make the longest trips (mean 64 km, median 40 km). These average distances coincide with average cross-border commuting trip distances revealed by survey data a decade ago (Schmitz, Drevon, and Gerber Citation2012, 16), when the mean commuting distance to Luxembourg was 44 km, and for those residing in France, Belgium and Germany it was 40, 46 and 49 km, respectively.
The average movement distances across Luxembourg’s borders for other locals in the GRL are similar to commuters, yet they vary significantly by residence country ((C)). Locals residing on the French side make the shortest trips (median 28 km), whereas trip distances are highly dispersed and longer by locals residing on the Belgian (median 73 km) and German sides (median 84 km) of the GRL. Cross-border trip distances by locals residing in Luxembourg are similarly dispersed, yet shorter (median 43 km).
Cross-border trip distances are not static and have distinct weekly rhythms (). The median distance of overall cross-border trips for each weekday shows a stable growth towards the weekend. Division of trips by border crosser type shows that commuters have a stable median distance regardless of weekday. However, other locals make longer trips across the borders of Luxembourg during the weekend. Non-locals have the least stable cross-border trip distance by weekday.
Figure 7. Difference between weekday median distance of cross-border trips compared to overall median distance of cross-border trips in case of border crosser type and all trips together.

Finally, the geographical layout of movements across Luxembourg borders captures the spatial structures of cross-border flows of people (). The overall magnitude of mobility flows across Luxembourg borders by cross-border commuters connected to France were concentrated on three cities – Thionville, Metz and Longwy ((A)). The corridor between Luxembourg city and Thionville hosted over 25% of all cross-border mobility. To a lesser degree, mobility flows to Belgium were concentrated on Arlon and in Germany to Trier. Some long-distance commuting was concentrated in cities like Nancy, Liege, Namur and Cologne.
Figure 8. The estimated geographical distribution of cross-border mobility flows crossing the borders of Luxembourg from Twitter data by cross-border commuters (A) and locals residing in Luxembourg (B), Belgium (C), France (D) and Germany (E). The proportional value indicates how many movements were located within the closest 3 km2.
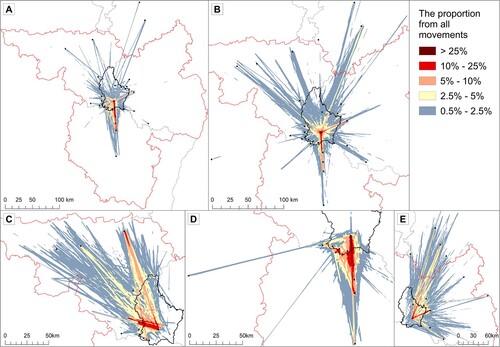
In Luxembourg, commuter flows predominantly concentrate on Luxembourg city and its surrounding area, but, also to southern cities. Some 10–25% of all mobility is concentrated in areas around Differdange and Esch-zur-Alsette, which are connected to mobility from France. By contrast, visits by Luxembourg residents to neighbouring countries are more dispersed, but the main flows were concentrated equally on the Thionville – Metz corridor and Trier ((B)). Some local border movement also emerged around Esch-zur-Alsette and Echternach.
Other residents (not cross-border commuters) in the GRL had geographically more dispersed mobility flows with certain concentration corridors to visit Luxembourg. Most mobility flows by residents from Belgium originated around the Arlon region and from Liege ((C)). Mobility flows by residents from Germany originated mostly from Trier, but also further away from Bitburg, Saarbrücken and Cologne ((E)). Mobility flows by residents from France coincided with commuters’ flows ((D)), yet locals tended to have more local visits just across Luxembourg border to southern cities – Esch-zur-Alsette, Differdange, Schifflange and Dudelange.
Discussion
The growing spatial mobilities and social interactions of people across country borders and its relevance to the functioning of cross-border regions indicate the need for a more detailed understanding about cross-border practices of individuals beyond the perspective of migration. We see the growing use of big data sources in social sciences (Burrows and Savage Citation2014; Kitchin Citation2014) as one way forward in providing complementary information for cross-border research.
In this paper, we have shown how a big data approach using the conceptual framework of human activity space can empirically reveal border crossers and their cross-border mobility from geographically located social media data. While we presented and described new insights about mobility and people crossing the borders of Luxembourg, we recognize that these findings may not fully reflect the reality. Thus, exact numeric values presented need to be taken with caution due to the absence of proper validation of cross-border mobility and the robust methodology used. That said, we do demonstrate the feasibility of a big data approach for cross-border research from three aspects next. We first evaluate our findings in line with previous research and knowledge about human mobility behaviour. Second, we discuss how to improve future research from our methodology to provide reliable information from social media data. Finally, we highlight how this information can benefit research and practice for policy and planning of cross-border regions.
Evaluating the findings and the feasibility of a big data approach
First, our findings indicate that our conceptual framework operationalized with geolocated Twitter data can capture cross-border commuters working in Luxembourg. The spatial distribution of their estimated residential locations coincides both with register data at the municipality level (STATEC Citation2021) and with survey data (Schmitz, Drevon, and Gerber Citation2012). The division of cross-border commuters of Luxembourg between neighbouring France, Belgium and Germany was almost identical with official register data (STATEC Citation2021). Also, the commuters’ estimated cross-border movement distances by country of residence were similar to the commuting distances found in a large-scale commuter survey (Schmitz, Drevon, and Gerber Citation2012). Not the least, the findings capture the growing proportion of cross-border commuters in the overall cross-border mobility over the five-year period while the proportion in mobility across the French border grew twice as much as it did over the borders of Belgium and Germany. This follows the trend of frontier workers according to official register data – the number of workers from the three neighbouring countries steadily increased by 14%, whereas those residing in France increased by 19% and in Belgium and Germany by only 10% (STATEC Citation2021).
Furthermore, several outcomes fall in line with our expectations from existing knowledge about human mobility behaviour (Järv, Ahas, and Witlox Citation2014; Schönfelder and Axhausen Citation2010). For example, we captured the seasonal rhythms of cross-border mobility by population group as expected due to their motives for visiting Luxembourg. Commuters’ mobility for work is stable throughout the year, whereas visits by others to Luxembourg were more related to leisure activities and holidays concentrated in the summer months, and especially for non-local tourists.
Similarly, the weekly rhythms in visiting Luxembourg by population group reflect their lifestyle. Commuters go to Luxembourg for work on workdays but less-so on weekends, as full-time workers tend to travel less on the weekend to compensate for time invested in commuting and exploring new places close to home (Schönfelder and Axhausen Citation2010). Other people visit Luxembourg for leisure and shopping that takes place during weekends as people have more free time. This coincides with cross-border trip distances on weekdays () – commuters have stable distances while other locals visit Luxembourg further away during weekends. Luxembourg is visited from further away during weekends for its significantly lower prices for petrol, alcohol and tobacco (Mathä, Porpiglia, and Ziegelmeyer Citation2017). Varying trip distances of non-locals outside the GRL indicate the common weekend visitation rhythm – longer trips on Fridays to arrive at a destination and on Sundays to depart from a destination (Hall Citation2005).
Vice versa, cross-border mobility by residents of Luxembourg is clearly concentrated on weekends ((B)) and tends to be concentrated geographically in areas with known shopping destinations across the country borders: Thionville, Talange, Metz and Trier ((B)). Regular weekend trips for shopping and consuming in neighbouring countries are practiced by many in Luxembourg due to the significantly lower price levels for goods and services in the neighbouring countries (justarrived.lu Citation2022).
To sum up, we are confident that these findings provide the proof-of-concept that the proposed approach can capture and reveal cross-border mobility flows, people behind mobility and their motives for moving. While our empirical findings were partly expected from the case study area, we provided new aspects from the longitudinal and temporal (weekly, monthly, yearly) perspectives. This highlights the value of the proposed methodology for the study area and for other border regions more broadly.
Mapping avenues to enhance the approach to cross-border research
Our findings rely on a simple and robust methodology, but it is a solid starting point with several avenues for enhancing research in the future. The shared source code of the methodology we used (https://doi.org/10.5281/zenodo.6912827) serves as an excellent basis for method development and introducing big data approaches in cross-border research. This includes finding the optimal time duration for defining a movement, enhancing criteria for border crosser classification, and considering a varying social media population over time. Thus, we suggest four ways our proposed conceptual framework and methodology could be further improved.
First, to consider individuals’ daily practices coherently across borders, we need to reveal and study other activities (e.g. work, shopping, leisure) than their place of residence. This could be obtained by estimating activities from the textual and image contents of geolocated social media posts using topic modelling (Lansley and Longley Citation2016) and computer vision methods (Väisänen et al. Citation2021a). The other option would be to link geolocated posts with fine-grain land use data (or combining both approaches) and use spatio-temporal analysis to estimate activity location(s) by activity (Andrienko et al. Citation2016).
Second, from sustainability and transport perspectives, the information about transport mode is relevant, especially regarding cross-border commuting (Gerber et al. Citation2020). The quintessential perspective would be to differentiate between private car and public transport users. Social media content analysis can be used to estimate users by transport mode as these have distinct topics – e.g. traffic jams and parking issues for car users while there are public transport delays during peak hours. Another option would be spatio-temporal analyses of geolocated posts using land use data – e.g. spatial correlations between a user’s posts and public transport network (Liu et al. Citation2021).
Third, to capture the interactions between border regions from the people’s perspective, we need to know how their social connectedness occurs across borders, especially regarding cross-border commuters and residential migrants. Social media data can reveal with whom a person is communicating (e.g. reply, follow) and estimate the spatial distribution of a person’s social network within a study area (Takhteyev, Gruzd, and Wellman Citation2012).
Fourth, understanding the processes of integration and wellbeing of people in a border region requires information about place attachment and engagement to a society on both sides of the border. Social media contents combined with spatial analysis can provide estimations about individuals’ sentiments, perceptions and engagement towards society from various aspects (e.g. cultural, political, economic), in addition to language use as a tool for interaction (Steinmetz et al. Citation2021; Hiippala et al. Citation2020).
That said, social media data inhibit challenges that should be acknowledged and tackled in future research. First, inherent challenges to the feasibility of this approach are the issue of privacy and data availability, as with any big data source. Preserving privacy while working with individual-level social media data is possible with responsible big data analytics (Poorthuis and Zook Citation2017). Always presenting outputs at an aggregated level without harming an individuals’ privacy for societal good is the other paramount cornerstone (Poom et al. Citation2020). The data availability depends on existing regulations like the EU’s General Data Protection Regulation and data providers’ policies. The uncertainty that open access to a social media platform may change over time could also hinder the applicability (Poom et al. Citation2020). However, some data still exist in databases, and other data provision arrangements (e.g. public-private-partnership) could be considered once academic research proves its feasibility for societal good.
The main methodological challenge is the representativeness of data. Data includes biases inherent in social media regarding unbalanced representation of social groups (Zhang and Zhu Citation2018). Also, the data obtained may lack information about the characteristics of people like age, gender, socio-economic and cultural background (Toivonen et al. Citation2019). This could be mitigated by estimating characteristics from a user’s social media content and profile (Sloan et al. Citation2015) and linking with other data sources like population registers based on place of residence (Järv et al. Citation2020; Wang et al. Citation2018a). This would enable advanced modelling weighted by characteristics of people to improve the representativeness of findings. Ideally, the best way forward would be a mixed methods approach – linking and combining big data with surveys and registers for comprehensive outcomes.
Contributions to policy and planning in border regions
How could information from social media data benefit research and practice in cross-border regions? Given our discussion above, we see conceptual, methodological and practical contributions to policy and planning in border regions.
The proposed approach contributes to the discourse on the conceptualization of cross-border regions in two aspects. First, to incorporate a people perspective better – a bottom-up approach on how dynamic socio-spatial practices of people through spatial mobilities and social interactions – in (re)shaping the functioning of a (cross-border) society over time (Hägerstrand Citation1970; Kwan Citation2013). Second, to define functional cross-border regions through the flows of actual mobilities and interactions of people instead of predefined by administrative-territorial units or arbitrary spatial proximities (Harrison and Growe Citation2014). The added value of both aspects is a more dynamic and multi-layered understanding in conceptualizing functional cross-border regions, and the broader concept of a functional region.
Empirically, this approach can help various aspects of policy and planning – measuring the geographical extent and the integration of a functional cross-border region while introducing timely tools to monitor and evaluate the impact of policies and disruptive events on border regions (for example, Aagesen, Järv, and Gerber Citation2022).
Given that the concept of a functional region is inherently linked to spatial mobility, the question of measuring cross-border flows in a functional region often remains difficult beyond work-related commuting and migration data obtained from sedentary register data. Dynamic mobilities and social communication of people across borders from social media data can reveal actual hinterlands of borders that are hard to reveal (Löfgren Citation2008) and their evolution over (Pupier Citation2020). Insights about these hinterlands can foster spatial planning and development of functional transnational spaces (Durand Citation2015; Moisio Citation2011). For example, the spatial extent of actual cross-border interactions of people across borders could help to address policy challenges in topics like the labour market, transport planning, housing, or public service provision across borders (Medeiros Citation2020). Also, it helps to detect discrepancies between the socio-economic reality of people and the administratively defined border regions employed for territorial development and policy purposes.
Cross-border connectedness and integration are often examined in terms of administrative, institutional and entrepreneurial linkages across country borders (Dörry and Decoville Citation2016; Sohn and Reitel Citation2016) and cross-border commuting from official registers (Möller et al. Citation2018). Yet, the role of actual cross-border interactions of people in connecting regions across borders is often overlooked.
To understand integration across borders it is not only how familiar people are with and perceive societies on both sides of the border, but also how they are engaged through their daily lives – activities, social communications and mobilities. The main reason is a lack of suitable data, despite a few exceptional surveys shedding some light on cross-border integration from the people’s perspective from one point of time (Decoville and Durand Citation2018). Here, social media data can help to narrow down this knowledge gap.
Finally, our proposed approach would allow for the development and introduction of timely and continuous tools for monitoring and evaluation relevant to policy and planning. The constant feed of social media data could be used to monitor and detect abnormalities and disruptive events in a timely manner. For example, capturing the influence of societal disruptions like the COVID-19 pandemic and its mitigation measures on cross-border mobility (Docquier et al. Citation2021; Aagesen, Järv, and Gerber Citation2022) and daily lives of transnational people (Järv et al. Citation2021). Long-term monitoring of actual cross-border interactions of people would help in evaluating and assessing the impact of institutional instruments like the European Regional Development Funds on the daily lives of people regarding transport network development, and how de-bordering and re-bordering policies influence the production of functional cross-border regions over time (Durand Citation2015).
Acknowledgements
We would like to thank the valuable and constructive comments of Philippe Gerber and Guillaume Drevon (LISER), and the two anonymous referees, which helped us in improving the content and clarity of this paper.
Disclosure statement
No potential conflict of interest was reported by the author(s).
Correction Statement
This article has been corrected with minor changes. These changes do not impact the academic content of the article.
Additional information
Funding
References
- Aagesen, H., O. Järv, and P. Gerber. 2022. “The Effect of COVID-19 on Cross-Border Mobilities of People and Functional Border Regions: The Nordic Case Study from Twitter Data.” Geografiska Annaler: Series B. doi:10.1080/04353684.2022.2101135.
- Ahas, R., A. Aasa, A. Roose, Ü Mark, and S. Silm. 2008. “Evaluating Passive Mobile Positioning Data for Tourism Surveys: An Estonian Case Study.” Tourism Management 29: 469–486. doi:10.1016/j.tourman.2007.05.014.
- Ahas, R., S. Silm, O. Järv, E. Saluveer, and M. Tiru. 2010. “Using Mobile Positioning Data to Model Locations Meaningful to Users of Mobile Phones.” Journal of Urban Technology 17: 3–27. doi:10.1080/10630731003597306.
- Andrienko, N., G. Andrienko, G. Fuchs, and P. Jankowski. 2016. “Scalable and Privacy-Respectful Interactive Discovery of Place Semantics from Human Mobility Traces.” Information Visualization 15: 117–153. doi:10.1177/1473871615581216.
- Beduschi, A. 2020. “International Migration Management in the Age of Artificial Intelligence.” Migration Studies 9: 576–596. doi:10.1093/migration/mnaa003.
- Blanford, J., Z. Huang, A. Savelyev, and A. Maceachren. 2015. “Geo-Located Tweets. Enhancing Mobility Maps and Capturing Cross-Border Movement R. Lambiotte, ed.” PLOS ONE 10: e0129202. doi:10.1371/journal.pone.0129202.
- Burrows, R., and M. Savage. 2014. “After the Crisis? Big Data and the Methodological Challenges of Empirical Sociology.” Big Data & Society, 1: 1–6. doi: 10.1177/2053951714540280
- Carling, J., M. Erdal, and C. Talleraas. 2021. “Living in Two Countries: Transnational Living as an Alternative to Migration.” Population, Space and Place 27. doi:10.1002/psp.2471.
- Castells, M. 1996. The Rise of the Network Society. The Information Age: Economy, Society and Culture. Malden, MA: Blackwell.
- Chua, A., L. Servillo, E. Marcheggiani, and A. Moere. 2016. “Mapping Cilento: Using Geotagged Social Media Data to Characterize Tourist Flows in Southern Italy.” Tourism Management 57: 295–310. doi:10.1016/j.tourman.2016.06.013.
- Collins, F. 2009. “Transnationalism Unbound: Detailing New Subjects, Registers and Spatialities of Cross-Border Lives.” Geography Compass 3: 434–458. doi:10.1111/j.1749-8198.2008.00187.x.
- Conradson, D., and A. Latham. 2005. “Transnational Urbanism: Attending to Everyday Practices and Mobilities.” Journal of Ethnic and Migration Studies 31: 227–233. doi:10.1080/1369183042000339891.
- Decoville, A., and F. Durand. 2018. “Exploring Cross-border Integration in Europe: How Do Populations Cross Borders and Perceive Their Neighbours?” European Urban and Regional Studies, 26: 134–157. doi: 10.1177/0969776418756934
- Docquier, F., N. Golenvaux, S. Nijssen, P. Schaus, and F. Stips. 2021. “Cross-Border Mobility Responses to Covid-19 in Europe: New Evidence from Facebook Data”. Globalization and Health, 18. doi: 10.1186/s12992-022-00832-6
- Dörry, S., and A. Decoville. 2016. “Governance and Transportation Policy Networks in the Cross-Border Metropolitan Region of Luxembourg: A Social Network Analysis.” European Urban and Regional Studies 23: 69–85. doi:10.1177/0969776413490528.
- Drevon, G., P. Gerber, O. Klein, and C. Enaux. 2018. “Measuring Functional Integration by Identifying the Trip Chains and the Profiles of Cross-Border Workers: Empirical Evidences from Luxembourg.” Journal of Borderlands Studies 33: 549–568. doi:10.1080/08865655.2016.1257362.
- Durand, F. 2015. “Theoretical Framework of the Cross-border Space Production – The Case of the Eurometropolis Lille–Kortrijk–Tournai.” Journal of Borderlands Studies 30: 309–328. doi:10.1080/08865655.2015.1066701.
- European Commission. 2017. Boosting growth and cohesion in EU border regions. Communication from the Commission to the Council and the European parliament. Brussels: European Commission.
- Gendronneau, C., A. Wisniowski, D. Yildiz, E. Zagheni, L. Florio, Y. Hsiao, M. Stepanek, I. Weber, G. Abel, and S. Hoorens. 2019. “Measuring Labour Mobility and Migration Using Big Data: Exploring the Potential of Social-Media Data for Measuring EU Mobility Flows and Stocks of EU Movers.”Brussels: Publications Office of the European Union.
- Gerber, P. 2012. “Advancement in Conceptualizing Cross-Border Daily Mobility: The Benelux Context in the European Union.” European Journal of Transport and Infrastructure Research 12: 178–197. doi: 10.18757/ejtir.2012.12.3.2980
- Gerber, P., M. Thériault, C. Enaux, and S. Carpentier-Postel. 2020. “Links Between Attitudes, Mode Choice, and Travel Satisfaction: A Cross-Border Long-Commute Case Study.” Sustainability 12: 9203. doi:10.3390/su12219203.
- González, M., C. Hidalgo, and A. Barabási. 2008. “Understanding Individual Human Mobility Patterns.” Nature 453: 779–782. doi:10.1038/nature06958.
- Gutiérrez, M., A. Sánchez-Atondo, L. García, A. Mungaray-Moctezuma, and J. Calderón. 2021. “Understanding Cross-border Mobility in Medium-Small Mexico-U.S. Binational Regions. Mexicali-Imperial Valley Case Study.” Transportation Research Interdisciplinary Perspectives 9: 100324. doi:10.1016/j.trip.2021.100324.
- Hall, C. 2005. “Reconsidering the Geography of Tourism and Contemporary Mobility.” Geographical Research 43: 125–139. doi:10.1111/j.1745-5871.2005.00308.x.
- Harrison, J., and A. Growe. 2014. “From Places to Flows? Planning for the New ‘Regional World’ in Germany.” European Urban and Regional Studies 21: 21–41. doi:10.1177/0969776412441191.
- Hasnat, M., and S. Hasan. 2018. “Identifying Tourists and Analyzing Spatial Patterns of Their Destinations from Location-Based Social Media Data.” Transportation Research Part C: Emerging Technologies 96: 38–54. doi:10.1016/j.trc.2018.09.006.
- Hawelka, B., I. Sitko, E. Beinat, S. Sobolevsky, P. Kazakopoulos, and C. Ratti. 2014. “Geo-Located Twitter as Proxy for Global Mobility Patterns.” Cartography and Geographic Information Science 41: 260–271. doi:10.1080/15230406.2014.890072.
- Hägerstrand, T. 1970. “What About People in Regional Science?” Papers of the Regional Science Association 24: 6–21. doi:10.1007/BF01936872.
- Heikinheimo, V., O. Järv, H. Tenkanen, T. Hiippala, and T. Toivonen. 2022. “Detecting Country of Residence from Social Media Data: A Comparison of Methods.” International Journal of Geographical Information Science, doi:10.1080/13658816.2022.2044484.
- Hiippala, T., T. Väisänen, T. Toivonen, and O. Järv. 2020. “Mapping the Languages of Twitter in Finland: Richness and Diversity in Space and Time.” Neuphilologische Mitteilungen 121: 12–44. doi:10.51814/nm.99996.
- Jackson, P., P. Crang, and C. Dwyer. 2004. Transnational Spaces. London: Routledge.
- Järv, O., R. Ahas, and F. Witlox. 2014. “Understanding Monthly Variability in Human Activity Spaces: A Twelve-Month Study Using Mobile Phone Call Detail Records.” Transportation Research Part C: Emerging Technologies 38: 122–135. doi:10.1016/j.trc.2013.11.003.
- Järv, O., A. Masso, S. Silm, and R. Ahas. 2020. “The Link Between Ethnic Segregation and Socio-Economic Status: An Activity Space Approach.” Tijdschrift Voor Economische en Sociale Geografie 112: 319–335. doi:10.1111/tesg.12465.
- Järv, O., A. Tominga, K. Müürisepp, and S. Silm. 2021. “The Impact of COVID-19 on Daily Lives of Transnational People Based on Smartphone Data: Estonians in Finland.” Journal of Location Based Services, 15: 169–197. doi:10.1080/17489725.2021.1887526
- Justarrived.lu. 2022. “Shopping Close to Luxembourg Borders.” Accessed 2 February 2022. https://www.justarrived.lu/en/practical-information/shopping-belgium-germany-france/.
- Kaufmann, V. 2014. “Mobility as a Tool for Sociology.” Sociologica, 1: 0–0. doi: 10.2383/77046
- Kemp, S. 2019. Digital 2019: Global Digital Report. Kepios.
- Kitchin, R. 2014. The Data Revolution: Big Data, Open Data, Data Infrastructures & Their Consequences. Los Angeles, CA: SAGE.
- Kwan, M. 2013. “Beyond Space (As We Knew It): Toward Temporally Integrated Geographies of Segregation, Health, and Accessibility.” Annals of the Association of American Geographers 103: 1078–1086. doi:10.1080/00045608.2013.792177
- Lansley, G., and P. Longley. 2016. “The Geography of Twitter Topics in London.” Computers, Environment and Urban Systems 58: 85–96. doi:10.1016/j.compenvurbsys.2016.04.002.
- Liu, X., Q. Huang, S. Gao, and J. Xia. 2021. “Activity Knowledge Discovery: Detecting Collective and Individual Activities with Digital Footprints and Open Source Geographic Data.” Computers, Environment and Urban Systems 85: 101551. doi:10.1016/j.compenvurbsys.2020.101551.
- Löfgren, O. 2008. “Regionauts: The Transformation of Cross-Border Regions in Scandinavia.” European Urban and Regional Studies 15: 195–209. doi:10.1177/0969776408090418.
- Martí, P., L. Serrano-Estrada, and A. Nolasco-Cirugeda. 2019. “Social Media Data: Challenges, Opportunities and Limitations in Urban Studies.” Computers, Environment and Urban Systems 74: 161–174. doi:10.1016/j.compenvurbsys.2018.11.001.
- Mathä, T., A. Porpiglia, and M. Ziegelmeyer. 2017. “Cross-Border Commuting and Consuming: An Empirical Investigation.” Applied Economics 49: 2011–2026. doi:10.1080/00036846.2016.1231902.
- Mazzoli, M., B. Diechtiareff, A. Tugores, W. Wives, N. Adler, P. Colet, and J. Ramasco. 2020. “Migrant Mobility Flows Characterized with Digital Data J. Paniagua, ed.” PLOS ONE 15: e0230264. doi:10.1371/journal.pone.0230264.
- Medeiros, E. 2020. “Delimiting Cross-Border Areas for Policy Implementation: A Multi-Factor Proposal.” European Planning Studies 28: 125–145. doi:10.1080/09654313.2019.1687654.
- Moisio, S. 2011. “Geographies of Europeanization: The EU's Spatial Planning as a Politics of Scale”, in Europe in the World: EU Geopolitics and the Making of European Space, edited by L. Bialasiewicz L., pp. 19-39. Farnham: Ashgate.
- Möller, C., E. Alfredsson-Olsson, B. Ericsson, and K. Overvåg. 2018. “The Border as an Engine for Mobility and Spatial Integration: A Study of Commuting in a Swedish–Norwegian Context.” Norsk Geografisk Tidsskrift - Norwegian Journal of Geography 72: 217–233. doi:10.1080/00291951.2018.1497698.
- Ortúzar, J., J. Armoogum, J. Madre, and F. Potier. 2011. “Continuous Mobility Surveys: The State of Practice.” Transport Reviews 31: 293–312. doi:10.1080/01441647.2010.510224.
- Pierrard, O. 2008. “Commuters, Residents and job Competition.” Regional Science and Urban Economics 38: 565–577. doi:10.1016/j.regsciurbeco.2008.04.003.
- Poom, A., O. Järv, M. Zook, and T. Toivonen. 2020. “COVID-19 is Spatial: Ensuring That Mobile Big Data is Used for Social Good.” Big Data & Society 7. doi:10.1177/2053951720952088.
- Poorthuis, A., and M. Zook. 2017. “Making Big Data Small: Strategies to Expand Urban and Geographical Research Using Social Media.” Journal of Urban Technology 24: 115–135. doi:10.1080/10630732.2017.1335153.
- Pupier, P. 2020. “Spatial Evolution of Cross-Border Regions. Contrasted Case Studies in North-West Europe.” European Planning Studies 28: 81–104. doi:10.1080/09654313.2019.1623975.
- Ramirez, M., and A. Winkler. 2012. Information Services for Cross-Border Workers in European Border Regions. Gronau: Association of European Border Regions.
- Rashidi, T., A. Abbasi, M. Maghrebi, S. Hasan, and T. S. Waller. 2017. “Exploring the Capacity of Social Media Data for Modelling Travel Behaviour: Opportunities and Challenges.” Transportation Research Part C: Emerging Technologies 75: 197–211. doi:10.1016/j.trc.2016.12.008.
- Raun, J., R. Ahas, and M. Tiru. 2016. “Measuring Tourism Destinations Using Mobile Tracking Data.” Tourism Management 57: 202–212. doi:10.1016/j.tourman.2016.06.006.
- Rodríguez, M., J. Molina, and J. Camacho. 2022. “Mapping Functional Areas in Spain Using Mobile Positioning Data.” European Urban and Regional Studies, 29: 145–151. 096977642110662.
- Ruktanonchai, N., C. Ruktanonchai, J. Floyd, and A. Tatem. 2018. “Using Google Location History Data to Quantify Fine-Scale Human Mobility.” International Journal of Health Geographics 17: 28. doi:10.1186/s12942-018-0150-z.
- Saluveer, E., J. Raun, M. Tiru, L. Altin, J. Kroon, T. Snitsarenko, A. Aasa, and S. Silm. 2020. “Methodological Framework for Producing National Tourism Statistics from Mobile Positioning Data.” Annals of Tourism Research 81: 102895. doi:10.1016/j.annals.2020.102895.
- Schmitz, F., G. Drevon, and P. Gerber. 2012. La mobilité des frontaliers du Luxembourg : dynamiques et perspectives.
- Schönfelder, S., and K. Axhausen. 2010. Urban Rhythms and Travel Behaviour. Urban Rhythms and Travel Behaviour. Surrey: Ashgate.
- Sheller, M., and J. Urry. 2006. “The New Mobilities Paradigm.” Environment and Planning A 38: 207–226. doi:10.1068/a37268.
- Silm, S., J. Jauhiainen, J. Raun, and M. Tiru. 2020b. “Temporary Population Mobilities Between Estonia and Finland based on Mobile Phone Data and the Emergence of a Cross-Border Region.” European Planning Studies, 29: 1–21. doi: 10.1080/09654313.2020.1774514
- Silm, S., O. Järv, and A. Masso. 2020a. “Tracing Human Mobilities Through Mobile Phones.” In Handbook of Research Methods and Applications for Mobilities, edited by M. Büscher, M. Freudendal-Pedersen, S. Kesselring, and N. G. Kristensen, 182–192. Cheltenham: Edward Elgar Publishing.
- Sloan, L., J. Morgan, P. Burnap, and M. Williams. 2015. “Who Tweets? Deriving the Demographic Characteristics of Age, Occupation and Social Class from Twitter User Meta-Data T. Preis, ed.” PLOS ONE 10: e0115545. doi: 10.1371/journal.pone.0115545
- Sohn, C., and B. Reitel. 2016. “The Role of National States in the Construction of Cross-Border Metropolitan Regions in Europe: A Scalar Approach.” European Urban and Regional Studies 23: 306–321. doi:10.1177/0969776413512138.
- Spyratos, S., M. Vespe, F. Natale, I. Weber, E. Zagheni, and M. Rango. 2019. “Quantifying International Human Mobility Patterns Using Facebook Network Data I. Benenson, ed.” PLOS ONE 14: e0224134. doi:10.1371/journal.pone.0224134.
- Statec. 2021. Labour market statistics.
- Steinmetz, C., H. Rahmat, N. Marshall, K. Bishop, S. Thompson, M. Park, L. Corkery, and C. Tietz. 2021. “Liking, Tweeting and Posting: An Analysis of Community Engagement Through Social Media Platforms.” Urban Policy and Research 39: 85–105. doi:10.1080/08111146.2020.1792283.
- Takhteyev, Y., A. Gruzd, and B. Wellman. 2012. “Geography of Twitter Networks.” Social Networks 34: 73–81. doi:10.1016/j.socnet.2011.05.006.
- Toivonen, T., V. Heikinheimo, C. Fink, A. Hausmann, T. Hiippala, O. Järv, H. Tenkanen, and E. Di Minin. 2019. “Social Media Data for Conservation Science: A Methodological Overview.” Biological Conservation 233: 298–315. doi:10.1016/j.biocon.2019.01.023.
- Twitter Inc. 2022. “Twitter API: Academic Research access.” Accessed 6 January 2022. https://developer.twitter.com/en/products/twitter-api/academic-research.
- United Nations. 2017. International Migration Report 2017: Highlights. United Nations, Department of Economic and Social Affairs, Population Division.
- Väisänen, T., V. Heikinheimo, T. Hiippala, and T. Toivonen. 2021a. “Exploring Human–Nature Interactions in National Parks with Social Media Photographs and Computer Vision.” Conservation Biology 35: 424–436. doi:10.1111/cobi.13704.
- Väisänen, T., S. Sirkiä, T. Hiippala, O. Järv, and T. Toivonen. 2021b. tweetsearcher: A Python Tool to Download Tweets Using Academic Research Credentials. Zenodo.
- Wang, Z., S. He, and Y. Leung. 2018b. “Applying Mobile Phone Data to Travel Behaviour Research: A Literature Review.” Travel Behaviour and Society 11: 141–155. doi:10.1016/j.tbs.2017.02.005.
- Wang, Q., N. Phillips, M. Small, and R. Sampson. 2018a. “Urban Mobility and Neighborhood Isolation in America’s 50 Largest Cities.” Proceedings of the National Academy of Sciences 115: 7735–7740. doi:10.1073/pnas.1802537115.
- World Tourism Organization, ed. 2018. UNWTO Tourism Highlights: 2018 Edition. UNWTO.
- Yue, Y., T. Lan, A. Yeh, and Q. Li. 2014. “Zooming Into Individuals to Understand the Collective: A Review of Trajectory-Based Travel Behaviour Studies.” Travel Behaviour and Society 1: 69–78. doi:10.1016/j.tbs.2013.12.002.
- Zagheni, E., V. Garimella, I. Weber, and B. State. 2014. “Inferring International and Internal Migration Patterns from Twitter Data.” In: Proceedings of the 23rd International Conference on World Wide Web – WWW ‘14 Companion, 439–444. ACM Press: Seoul, Korea.
- Zhang, G., and A. Zhu. 2018. “The Representativeness and Spatial Bias of Volunteered Geographic Information: A Review.” Annals of GIS 24: 151–162. doi:10.1080/19475683.2018.1501607