
 ?Mathematical formulae have been encoded as MathML and are displayed in this HTML version using MathJax in order to improve their display. Uncheck the box to turn MathJax off. This feature requires Javascript. Click on a formula to zoom.
ABSTRACT
Previous research has argued that related variety enhances regional innovation as inter-industry knowledge spillovers occur more easily between cognitively similar industries. In this study, we engage with empirical operationalization of what is ‘related’ in related variety. We argue, based on theoretical grounds, that estimating regional knowledge production functions requires related variety measures that capture the recombination of knowledge explicitly. To test this proposition, we develop a set of related variety indicators that account for indirect linkages between industries and allow these linkages to vary over time. Empirically, we estimate the relationship between regional innovation output and regional industry mix in Swedish regions between 1991 and 2010. Our results suggest that related variety measures based on dynamic recombinant relatedness are superior in predicting regional innovation output.
1. Introduction
While innovation is a multi-scalar process that may involve knowledge sourced from local and global networks (Hassink, Isaksen, and Trippl Citation2019), the economic geography literature has repeatedly underlined the regional level as particularly important for knowledge exchange (Almeida and Kogut Citation1999; Breschi and Lissoni Citation2009). Thus, substantial effort has been dedicated to understanding which regional environments are more conducive to innovation. In this literature, it has been acknowledged for a while that firms located in regions with diversified industry structures have better preconditions for knowledge exchange and (re)combination (Jacobs Citation1969). Yet, not all diversity is equally conducive to innovation (Boschma, Eriksson, and Lindgren Citation2009; Noteboom Citation2000). To support efficient knowledge exchange, regional variety should be related, that is, consist of industries with cognitively close knowledge bases. While remaining modest in quantity, previous studies suggest unambiguously that regional innovation tends to increase with the degree of related variety in regional industry composition (Aarstad, Kvitastein, and Jakobsen Citation2016; Antonietti and Cainelli Citation2011; Castaldi, Frenken, and Los Citation2015; Ejdemo and Örtqvist Citation2020; Miguelez and Moreno Citation2018; Tavassoli and Carbonara Citation2014; Wixe Citation2018).
All these studies, however, employ related variety measures based on the hierarchical structure of official industry classifications, which tend to underestimate the extent of knowledge spillovers between industries (Firgo and Mayerhofer Citation2017; Kuusk and Martynovich Citation2021). In that respect, they ignore recent methodological advancements in measuring relatedness between industries (see Whittle and Kogler (Citation2020) for a literature review).
Here, we make an important distinction between the notions of relatedness and related variety. The former has its origin in the economic complexity literature and measures the extent of (knowledge and technological) affinity between industries (Hidalgo Citation2021). This literature engages with how relatedness can be operationalized and measured (Whittle and Kogler Citation2020), how it emerges (Ingstrup & Menzel Citation2019) and changes over time (Juhász, Broekel, and Boschma Citation2021; Kuusk and Martynovich Citation2021). The related variety notion emerged within the evolutionary economic geography literature to describe the extent to which regional industry mixes as a whole comprise related industries (Frenken, Van Oort, and Verburg Citation2007). This literature is mainly preoccupied with the question of how regional environments characterized by different degrees of related variety differ in terms of growth in employment, productivity and innovation (see Content and Frenken (Citation2016) for a review). Our paper is an attempt to bridge these literatures by engaging empirically with what is ‘related’ in related variety.Footnote1
Our primary contribution is methodological: we develop a set of related variety measures based on the operationalization of relatedness that is (1) dynamic, that is, allowing linkages between industries to change over timeFootnote2 and (2) recombinant, that is, incorporating indirect linkages between industries. Both proposed features remain underinvestigated in the literature (Boschma Citation2017; Hidalgo Citation2021).
Our empirical contribution is two-fold. First, we employ a literature-based innovation output indicator that captures commercialized innovations (unlike patents), while avoiding self-reporting bias of survey-based output indicators. Second, we test our propositions in the long-term setting by estimating the relationship between innovation output and industry composition of Swedish regions between 1991 and 2010. Given that industry structures change slowly over time (Firgo and Mayerhofer Citation2017), this allows us to arrive to a more accurate estimation of this relationship compared to previous studies that use cross-section data or short panels.
Our findings go in line with previous research efforts: related variety matters for regional innovation output. Yet, we find that estimating regional knowledge production functions requires an operationalisation of related variety that captures the potential for knowledge (re)combination explicitly. To do so, related variety measures should account for inter-temporal variation in industry linkages as well as indirect connections between industries.
2. Regional innovation and related variety
2.1. Literature review
The idea that regional industrial composition can be conducive to innovation has its roots in theories of agglomeration externalities and localized knowledge spillovers. In this strand of literature, the question of whether specialization or diversity enhances regional innovation has been particularly prominent.
On the one hand, Marshall (Citation1890) suggested that knowledge spillovers took place between firms engaged in similar economic activities through internalization of knowledge within techno-industrial structures. Thus, innovation processes are enhanced in specialized regional settings. On the other hand, Jacobs (Citation1969) claimed that innovation was an outcome of a recombinant process of knowledge generation that was built on pre-existing knowledge variety. Therefore, for regions to remain innovative their industrial composition should be sufficiently diversified. Recent developments in the field suggest, however, that traditional conceptualizations of specialization and diversity are too simplistic to capture the relationship between regional industry composition and innovation output (Content and Frenken Citation2016).
Rather, it is an industry structure characterized by the related variety that is particularly conducive to innovation-enhancing knowledge spillovers (Frenken, Van Oort, and Verburg Citation2007). Variety alone is not enough for knowledge exchange to take place because not all knowledge bits can be meaningfully exchanged and (re)combined. ‘[A] not too great cognitive distance between firms … enables effective communication and thus learning, while a not too small cognitive distance avoids lock-in’ (Boschma Citation2005, 64). Yet, ‘at a certain point cognitive distance becomes so large as to preclude sufficient mutual understanding’ (Noteboom et al. Citation2007, 1017). Thus, it is the optimal level of cognitive proximity that enhances knowledge exchange and, subsequently, innovation (Hassink, Klaerding, and Marques Citation2014; Noteboom Citation2000). Related variety captures the concept of cognitive distance between the extremes that allows economic actors to identify the knowledge recombination potential and facilitate innovation activity (Aarstad, Kvitastein, and Jakobsen Citation2016).Footnote3
Empirical studies support the notion that related variety is associated with enhanced regional innovation. Regional patenting studies in Sweden (Ejdemo and Örtqvist Citation2020; Tavassoli and Carbonara Citation2014), US (Castaldi, Frenken, and Los Citation2015) and EU (Miguelez and Moreno Citation2018) as well as firm-level studies in Italy (Antonietti and Cainelli Citation2011), Sweden (Wixe Citation2018) and Norway (Aarstad, Kvitastein, and Jakobsen Citation2016) all show that innovation output tends to increase with the degree of related variety in regional industry composition. While the number of studies investigating the relationship between related variety and regional innovation remains modest (Ejdemo and Örtqvist Citation2020), their findings point in the same direction. Thus, it is fair to say that innovating through (re)combination of related knowledge is the rule and seldom the exception (Whittle and Kogler Citation2020).
At the same time, it has been shown that recombination of unrelated knowledge should not be overlooked, particularly when it comes to breakthrough innovations. Barbieri, Perruchas, and Consoli (Citation2020) recently found that unrelated variety was the main driver in the early stages of green technology development in the US. In the similar vein, Castaldi, Frenken, and Los (Citation2015) and Miguelez and Moreno (Citation2018) demonstrated that unrelated variety is positively associated with high-impact breakthrough innovation in the US and EU, respectively. Thus, future studies investigating the relationship between regional innovation output and regional industry composition should account for degree of novelty of innovation in question.
2.2. Related to what? Approaches to operationalizing relatedness
A key question that emerges here is how related activities are defined. The literature has developed three approaches to operationalizing and measuring relatedness between industries (Whittle and Kogler Citation2020).
The first (and, to date, the most usedFootnote4) measure is based on the hierarchical structure of official industry classifications. Here, economic activities are considered related if they belong to the same broad-digit industry class (e.g. four-digit NACE industries belonging to the same two-digit NACE industry). This approach is very straightforward and allows constructing measures of (un)related variety using a simple entropy index. Yet, it has been criticized for offering little theoretical justification for the assumption that industry classifications reflect the prevalence of knowledge scope economies among industries (Neffke and Henning Citation2013) or that industries share resources (Whittle and Kogler Citation2020). Besides, it underestimates knowledge spillovers potential between broad economy sectors, e.g. between manufacturing and services (Firgo and Mayerhofer Citation2017; Kuusk and Martynovich Citation2021).
The second measure is based on co-occurrence. Here, assuming that different industries or technologies are combined in portfolios because of economies of scope between them, one can infer relatedness by analysing co-occurrence of industries in portfolios of firms (or technologies in patents). This approach has an advantage of covering many industries, especially in the manufacturing sector, and aggregates distributed knowledge about economies of scope relevant to individual economic actors (Neffke and Henning Citation2013). Yet, this approach is largely outcome based and builds on a rather strong assumption that firm industry portfolios are coherent.
The third measure captures resource similarities (primarily, human capital) between industries (Neffke and Henning Citation2013). This approach emphasizes the origin of resources and infers a relatedness measure from there. It allows capturing relatedness at a micro-level (via occupational data and labour mobility); something that other relatedness measures have failed to do or done inadequately (Whittle and Kogler Citation2020). Due to its high data requirements, however, this approach remains underemployed in the geography of innovation literature.
Any matrix of related industries is a snapshot in time. For some relatedness measures the lens is forward oriented, while for others it is focused on the past. Relatedness measures based on technological knowledge (e.g. co-occurrence of technologies in patents) capture potential relatedness ties that may or may not be realized. Industry co-occurrence measures primarily reflect past development paths. Relatedness measures inferred from the hierarchy of official industry classifications do not have a time stamp at all (Kuusk and Martynovich Citation2021). At the same time, fast-adjusting resource-based relatedness measures are more likely to capture industry linkages that are valuable at a certain point in time, even if they can be inferred from data with a considerable delay. For this reason, we employ a related variety indicator based on inter-industry labour mobility patterns (Neffke and Henning Citation2013) that, in our opinion, provides the best operationalization of knowledge (re)combination potential.
2.3. Relatedness is dynamic
Since innovation builds on existing knowledge (Arthur Citation2007; Weitzman Citation1998), innovating firms should either (re)combine knowledge they already possess or acquire new knowledge elsewhere. At first, (re)combination and search involve familiar knowledge bases (Simon Citation1991). However, when internal knowledge (re)combination potential is exhausted, firms shift into explorative mode, including search for new knowledge in other industries (Fleming Citation2001). If this new knowledge is of industry-wide interest, successful innovation based on inter-industry learning of one firm will diffuse to other firms. If intensity of knowledge exchange between firms in two industries becomes sufficiently high, this manifests in emergence of a new (or reveal of a latent) relatedness linkage between them (Kuusk and Martynovich Citation2021).
More pronounced shifts in relatedness are a result of more distant explorative search by firms leading to radical innovations that push technological frontier outward (Fleming Citation2001). Such innovations are adopted in several industries simultaneously by firms engaged in explorative search processes and are afterwards diffused to other firms within those industries. Alternatively, they may diffuse one industry by one as described above. Either way, industry pairs acquire knowledge similarity by recombining previously unrelated bits of knowledge. At the same time, previously employed shared knowledge in those industries may become redundant, meaning that previously existing relatedness linkages disappear. Thus, relatedness is necessarily a dynamic phenomenon (Juhász, Broekel, and Boschma Citation2021; Kuusk and Martynovich Citation2021) and should be operationalized as such. Yet, the work on relatedness dynamics remains limited in scope (Hidalgo Citation2021).
We claim that capturing knowledge (re)combination potential for innovation at the regional level requires a related variety measure that explicitly accounts for reorganization of the matrix of related industry linkages over time. This brings us to our first hypothesis:
H1: Related variety measures based on dynamic relatedness will better capture regional knowledge recombination potential. In other words, they will explain regional innovation output better than measures of related variety based on static notion of relatedness.
2.4. Innovation is fuelled by recombinant relatedness
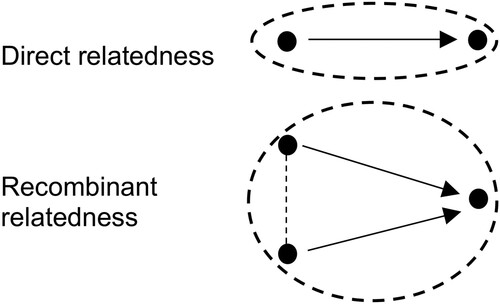
Another important issue with relatedness is the tendency to treat it is as a phenomenon characterizing direct relationships between two industries as either present or absent. In the context of analysing how related variety fuels innovation, this is quite problematic. Direct linkages, say worker flows, may (to a non-negligible extent) capture something else than relatedness conducive to innovation. Skill flows upstream or downstream in the value chain (e.g. skills moving from suppliers of automotive parts to automotive production) should imply strong similarities in the knowledge base. Co-location of such vertically related industries may produce positive externalities but need not mean opportunities for new knowledge combinations. One way to deal with this issue is to consider indirect connections between industries (Boschma Citation2017; Janssen Citation2015), using measures such as triadic closure (industries indirectly related through common neighbours) or indirect paths (industries indirectly related through a chain of related industries) in knowledge exchange networks. illustrates the difference between direct and what we for analytical clarity call recombinant relatedness, that incorporates indirect industry linkages. Direct relatedness is illustrated by one industry having a link to a second. Recombinant relatedness is illustrated as two industries that both have a link (skill flows) to a third.
Figure 1. Direct and recombinant relatedness. Solid lines indicate direct relatedness. Dashed line indicates recombinant (indirect) relatedness.
We propose that indirect industry linkages enhance the knowledge recombination potential and, thus, contribute to regional innovation output, which brings us to our second hypothesis:
H2: Related variety measures that account for indirect industry linkages will better capture regional knowledge recombination potential. In other words, they will explain regional innovation output better than measures of related variety based only on direct relatedness measures.
3. Geography of innovation in Sweden, 1970–2013
3.1. SWINNO – database of Swedish innovations
Our innovation data comes from SWINNO – a longitudinal micro-database containing detailed information about over 4,000 Swedish innovations commercialized between 1970 and 2013. It was constructed by scanning about 8,600 articles in 15 Swedish trade journals, covering manufacturing and ICT services (Kander et al. Citation2019; Sjöö Citation2014; Sjöö et al. Citation2014; Taalbi Citation2014). All journals were required to have an editorial mission to report on technological development of the industry. The edited sections of the journals were searched for innovations, defined as a significantly improved good, process or service that is commercialized. As a demarcation, only innovations developed by Swedish companies were included. While commercialized new goods, processes or services are included, the method typically does not capture in-house process innovations.
The major advantage of such literature-based innovation output (LBIO) method (Kleinknecht and Bain Citation1993) in relation to other innovation measures (such as R&D expenditures or patents) is that it captures actual innovations, while avoiding the self-reporting bias of survey-based output indicators. It is well known that R&D is a measure of effort, whereas patents are only proxies for innovations as not all patents are commercialized and not all innovations are patented. A few studies have compared patents, R&D or LBIO as regional innovation indicators (Acs, Anselin, and Varga Citation2002; Gössling and Rutten Citation2007; Makkonen and van der Have Citation2013). These studies show that there is only a moderate correlation between innovation measures. Moreover, in the longitudinal setting different innovation indicators may follow different long-run patterns, which raises concerns about applicability of patents or R&D as proxies for regional innovation output.
We employ several SWINNO variables that are based on detailed innovation biographies ().
Table 1. SWINNO variables.
Almost 60% of all innovations are directly linked to a specific municipality. In cases where innovations are not explicitly attached to a geographical location in the primary material, the innovation is matched with locations based on information about firms’ history, active persons and patents related to innovation. For single-establishment firms, the municipality of registration was used. For multi-establishment firms, historical sources (annual reports and literature) are used to match an innovation or inventor to a subdivision or subsidiary. In the remaining cases, where this is not possible, an assessment is made of the type of innovation and the connection to a particular development area. Through these multiple steps, 96% of all innovations are linked to a particular municipality.
For investigation purposes, 290 Swedish municipalities are merged into 90 local labour markets. This unit of analysis is appropriate as knowledge flows in Sweden have been demonstrated to transcend municipal borders while being bounded within functional regions (Andersson and Karlsson Citation2007). This, among other things, implies that a large part of spatial dependence is internalized within these spatial units (Tavassoli and Carbonara Citation2014) (see also ).
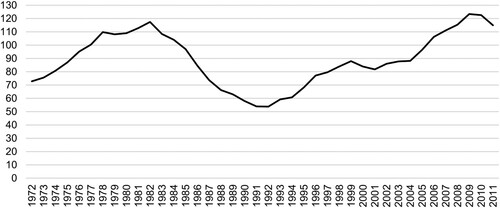
Figure 2. National innovation count, 1970–2013, 5-year moving average.
3.2. Innovation in Sweden
presents the national innovation output between 1970 and 2013.
A striking feature is a clear cyclical pattern with two periods of increased innovation (1970-1982 and 1994-2009) interrupted by a period of low innovation activity. These waves of innovation can in part be connected to phases of ICT expansion (Taalbi Citation2019): the first one related to industry automation and the second related to expansion of digital technologies, Internet and telecommunication infrastructure. The first wave of innovation is also related to creative response to the 1970s oil crisis (Taalbi Citation2014; Taalbi Citation2017).
The regional distribution of innovation demonstrates a clear pattern of geographical concentration (panel (a) in ). Five regions – Stockholm, Gothenburg, Malmö, Linköping and Västerås – performed much better than others, of which the former three are the Swedish metropolitan areas. The latter two are industrial regions with long histories of innovation activity, embodied in the historical presence of large firms such as Saab (Linköping) and ABB (Västerås). At the same time, eight regions do not have any innovation output throughout the whole investigation period. Considering innovation output per capita (panel (b) in ) shifts the pattern somewhat. Five innovation leading regions remain in the top, but there are now many regions in the middle and in the North of the country with relatively low innovation output, but also small population that dominate the picture.Footnote5 The median regional innovation output is 2.69 per 10,000 inhabitants.
Figure 3. Regional innovation output, 1970–2013.
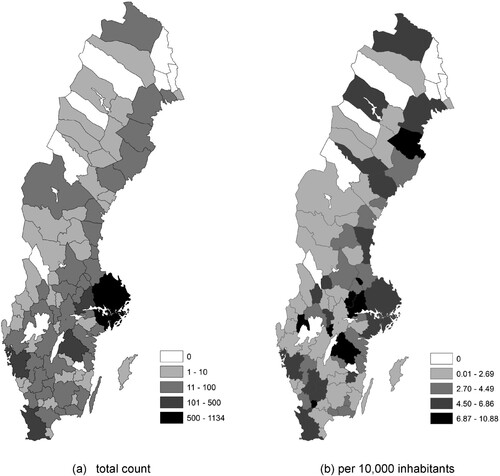
Overall, we observe a clear pattern of overdispersion (the variance is 44 times the mean). Such concentrated geographical pattern with several clearly defined ‘innovation islands’ implies that spatial dependency is not a significant concern (similar to Tavassoli and Carbonara Citation2014).
reports distribution of innovation between metropolitan and non-metropolitan regions over time. Before the early 1990s, there were no significant differences in innovation between two groups of regions. Thereafter, metropolitan areas begin to outperform non-metropolitan regions. This is primarily driven by the increased rate of radical innovation in metropolitan regions, while the distribution of major and incremental improvements across regions remained more equal (see Figures A1.1–A1.3 in the online supplement). This decoupling may reflect a wave of disruptive technologies and entry of entirely new firms.
Figure 4. Innovation count by region type, total count, 1970–2013, 5-year moving average.
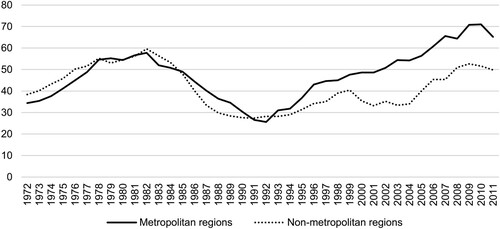
While many factors may have contributed to that, we posit that the increased complexity of innovation and importance of knowledge (re)combination could have played a role. Swedish metropolitan regions are characterised by more diversified industry structures (Kuusk and Martynovich Citation2021) and provide a more fertile environment for innovation. A broad connection between innovation and related variety would support this notion.
4. Methodology
4.1. Data
We infer relatedness between industries using the data from LISA: a longitudinal linked employer-employee database covering all individuals and workplaces registered in Sweden (SCB Citation2016). Classification of economic activities is based on the Swedish Standard Industrial Classification (SNI), which is the Swedish implementation of the Statistical Classification of Economic Activities in the European Community (NACE). In 1991–2001 the data are reported in SNI92 (NACE Rev. 1) and in 2001–2010 – in SNI2002 (NACE Rev. 1.1). As the latter is a minor revision of the former, the consistent industry classification over time was ensured by performing a manual crosswalk between the two.
4.2. Modelling framework
We employ a regional knowledge production function (Acs, Anselin, and Varga Citation2002) generally specified as:
(1)
(1) where
is innovation output in region
at time t and
is a vector of innovation inputs in region
at time
.
Since our dependent variable is a count variable with high overdispersion, we estimate a negative binomial regression model specified as:
(2)
(2) where
and
where
– innovation output in region r at time t where
,
– matrix of (un)related variety measures,
– matrix of control variables and
– region-invariant unobservable time effects.
Additionally, we estimate three generalized linear models to investigate relationship between quality of regional innovation and (un)related variety:
(3)
(3)
(4)
(4)
(5)
(5) where
,
,
are shares of totally new innovations, major improvements and incremental improvements in regional innovation output, respectively.
We employ a random-effect (RE) estimator because (1) it is more efficient than the fixed-effects (FE) estimator when most of variation in the data consists of the between-variation (across regions) rather than the within-variation (over time), and (2) the FE estimator may wrongfully estimate the impact of variables which exhibit only slight changes over time (Tavassoli and Carbonara Citation2014). Given that our primary explanatory variables operationalize industrial composition that changes slowly over time, both features of the RE estimator point in its favour.
For the same reason, using 4-year periods is preferred over year-by-year panel structure of our data: since variables on industrial composition change rather slowly over time, there is a very low year-by-year variance within regions (Firgo and Mayerhofer Citation2017). Furthermore, a year-by-year panel only identifies effects of changes in industrial composition on regional innovation that take place immediately but not longer-run effects.
Endogeneity may be an issue since innovation output may, in theory, have an impact on the regional industry structure. To mitigate endogeneity concerns, all variables in and
consist of the values for the first year in each period. Nevertheless, the analysis must be considered as an investigation into the relationship between variables rather than causal relationships.
4.3. Measuring related variety
We calculate related variety using three approaches: an entropy-based measure (Frenken, Van Oort, and Verburg Citation2007), regional skill relatedness (Fitjar and Timmermans Citation2017) and our own recombinant relatedness measure that accounts for indirect linkages between industries.
4.3.1. Entropy-based measure of related variety
Frenken, Van Oort, and Verburg (Citation2007) proposed to measure related variety in regional industry structures by making a distinction between two levels of industry aggregation: each four-digit industry i belongs to a two-digit industry classification , where
. The share of regional employment in a two-digit industry class g at time t is calculated as a sum of its four-digit constituents:
. The related variety index is then a weighted entropy index for four-digit industry codes in each of two-digit industry classes:
(6)
(6) where
The inherent assumption behind this measure is that four-digit industries are related when they share the two-digit industry class. As industry classifications are fixed, the only source of variation in
is structural change at a regional level, while changes in industry linkages are not accounted for. We claim that this limits explanatory power of entropy-based related variety measure, particularly in the long-term setting.
4.3.2. Regional skill relatedness
Neffke and Henning (Citation2013) proposed an approach that infers relatedness empirically by analyzing labour flows between industries, thus, not imposing any ex-ante assumptions on the structure of industry linkages. The departure point is that since human capital is specific, workers tend to switch to jobs where they incur fewer shortages (skills to be acquired) and smaller redundancies (skills not needed anymore) in their human capital (Neffke, Otto, and Weyh Citation2017). This is achieved if workers search for employment in industries that value skill portfolios similar to those in their previous employment. Thus, labour flows should be larger between industries with bigger skill overlaps – or, skill related industries. Flipping this argument, existence of extensive labour flows between two industries may signal that these industries are related.
Let be an observed worker flow between industries i and j at time t and
– an expected worker flow between them. Then the ratio values
that are significantly larger than 1 indicate that industries i and j are related.Footnote6 To account for substantial inter-temporal variation in relatedness between industries (Kuusk and Martynovich Citation2021), we calculate
separately for 1991–1994, 1995–1998, 1999–2002, 2003–2006 and 2007–2010. In derived relatedness matrices, cell values indicate ‘closeness’ of each industry couple.
After calculating relatedness between industries, we derive regional skill relatedness following Fitjar and Timmermans (Citation2017):
(7)
(7) where
is a measure of inter-industry relatedness between industries i and j (i≠j);
– a share of industry i in the regional employment at time t;
– number of industries present in the region. Using the information on the presence of related ties between industries within the region, this indicator allows measuring the overall degree of related variety in the regional economy. In broad terms, it represents the (weighted) average number of related industries per each industry.
4.3.3. Recombinant relatedness
To account for possible indirect linkages between industries, we extend the skill relatedness approach by noting that worker flows form a directed network having industries as nodes. This allows us to make use of the whole worker flow network topology. We develop three measures capturing recombinant industry relatedness using local information from the national inter-industry worker flow network.
The first measure – Dice index – is based on the number of common neighbours of two industries. It uses the adjacency matrix with elements having value
if industries i and j are related and 0 otherwise. For a directed network, the number of common neighbours is:
with
and
are sets of neighbour nodes of industries
and
, respectively and
– neighbour nodes of both i and j. The Dice metric normalizes the number of common neighbours by taking into account the sum of node degrees:
(8)
(8)
ranges between 0 and 1, where 0 denotes two industries having no common links and 1 denotes two industries having all links to the same set of nodes.
To account for the fact that worker flows between most industries are relatively small, the second metrics – Jaccard similarity index – introduces the weights and normalizes common neighbours by the neighbourhood size:
(9)
(9)
also ranges between 0 and 1.
As rare connections may be more indicative of where new links emerge, we introduce the third measure – Adamic-Adar index – that weighs the number of common neighbours by the rarity of relationships between other nodes and (Adamic and Adar Citation2003):
(10)
(10) The idea behind the Adamic-Adar index is that common neighbours in large network neighbourhoods are less significant when predicting a linkage between two nodes compared with elements shared between a small number of nodes. All three metrics are calculated using industries as nodes and worker flows as linkages (also, weights). To derive regional related variety measure based on recombinant relatedness, we substitute
in equation (7) with
,
and
. This means that in total we compare five related variety measures: one based on entropy of employment distribution across levels of industry classification, regional skill relatedness and three network-based measures that account for the overall topology of directed worker flows.
4.4. Control variables
We use reverse Hirschman-Herfindahl index to account for the level of absolute diversity in regional industry mix. We include the Theil index as a measure of relative regional specialization. The role of human capital is captured by the share of regional workers with higher education.
An important determinant of innovation at the regional level is the degree of urbanization: urban agglomeration is considered to lead to greater innovation (Iammarino Citation2005) and to lower costs of knowledge sharing between firms (Storper and Venables Citation2004). We proxy urbanization externalities with population density. Additionally, we add a dummy variable for metropolitan regions (Stockholm, Gothenburg and Malmö) to control for presence of regional decoupling between metropolitan and non-metropolitan regions in the regional innovation output after the early 1990s ().
Finally, it is shown that industry sectors differ in their propensity to innovate. The service sector is less likely to produce innovations than manufacturing (Tavassoli and Carbonara Citation2014). Even within manufacturing, sectors are characterized by different propensities to innovate underpinned by different technological regimes. To control for this, we include locational quotients for employment in manufacturing and high-tech manufacturing. To account for supportive role of knowledge-intensive services for innovation in the manufacturing sector, we also calculate locational quotient for employment in knowledge-intensive services.
All variables that are not measured as shares are included in models as logarithms to improve interpretation. Technical details on control variables calculation and descriptive statistics are provided, respectively, in A3 and A4 in the online supplement.
5. Related variety and regional innovation
reports the results of estimating regional knowledge production function for Swedish regions between 1991 and 2010.
Table 2. Regional innovation output and related variety.
In line with previous studies, we identify a positive relationship between related variety and regional innovation output for all five measures employed in the analysis: entropy-based related variety (models 1–3), regional skill relatedness (models 4–6) and three measures based on the topology of worker flows network across industries (models 7–15). There are, however, important qualifications to this result.
In the restricted model specifications (without control variables), all five measures have a positive relationship with regional innovation that is significant at the 1% level. Once we control for other characteristics of regional economies, however, the significance level falls to the 10% level for the entropy-based measure, while remaining high in other specifications. Akaike and Schwarz information criteria also suggest that the entropy-based measure of related variety provides a relatively inferior explanation for the relationship between related variety and regional innovation. In this respect, we obtain support for our first hypothesis (H1), that is, using related variety measures that account for inter-temporal variation in relatedness linkages between industries improves the explanatory power of regional knowledge production function estimation.
Within the group of related variety measures that account for inter-temporal changes in industry relatedness, measures that account for indirect linkages between industries (i.e. recombinant relatedness) perform better than the regional skill relatedness measure which only accounts for direct worker flows between industries. This supports our second hypothesis (H2). Moreover, Akaike and Schwarz information criteria suggest that once we account not only for the presence (Dice metrics), but also for the strength (Jaccard and Adamic-Adar metrics) of indirect industry linkages, the explanatory power of regional knowledge production function estimation increases.
An interesting result emerges once we consider the models with and without a dummy for metropolitan areas, which is included to control for decoupling in innovation output between metropolitan and non-metropolitan regions during our investigation period ( and Figures A.1.1–A.1.3). It appears that metropolitan and non-metropolitan regions are characterized by two different scales of the knowledge production function. Even after controlling for population density, the coefficient for the metropolitan dummy is positive and significant, indicating that metropolitan regions are characterized by higher innovation output. Also, including the metropolitan dummy increases both the significance and magnitude of the coefficients for related variety variables, irrespective of the measure. This implies that the role of related variety for innovation is pronounced in all regions (even more so once we account for the type of the region). This supports our conjecture that regional decoupling, observed in , is explained by the increased complexity of innovation and importance of knowledge (re)combination.
Control variables perform in line with expectations. Urbanized regions with more educated population demonstrate higher innovation output. Regions with higher share of manufacturing employment tend to perform better when it comes to innovation. This might reflect the fact that the SWINNO database does not capture most process innovations but may also indicate that manufacturing remains the backbone of innovation in regional economies. At the same time, stronger presence of knowledge-intensive service industries has a positive relationship with regional innovation output. This underlines their role as key nodes in knowledge networks that foster processes of knowledge creation and diffusion (Miozzo and Grimshaw Citation2005).
All in all, our findings indicate that related variety is positively associated with regional innovation. However, our results also suggest that to capture innovation as a process that involves knowledge exchange and (re)combination, the operationalization of what is ‘related’ in related variety should be qualified in two important aspects. First, relatedness is a dynamic phenomenon so that ‘what is related’ changes over time. Second, the notion of relatedness as a direct connection between two industries is too restrictive. Measures of related variety should account for both inter-temporal dynamics in relatedness linkages as well as include indirect connections between industries.
5.1. Accounting for unrelated variety
While related diversification – i.e. innovation through (re)combination of related knowledge – remains the rule (Whittle and Kogler Citation2020), there is an a growing body of evidence that innovation may be enhanced by unrelated variety in the surrounding of innovating actors, particularly when it comes to major breakthrough innovations (Barbieri, Perruchas, and Consoli Citation2020; Castaldi, Frenken, and Los Citation2015; Miguelez and Moreno Citation2018). Thus, we perform additional analyses incorporating unrelated variety in our models. We do so first for the overall regional innovation output and then estimate models separately for innovations of various novelty degree.
To estimate these models, we take advantage of the fact that two network topology measures – namely, Dice and Jaccard metrics – range between 0 and 1. By a slight transformation of equation (7) we can derive a measure of dissimilarity of labour flows between industries present in a regionFootnote7:
(11)
(11) By combining (7) and (11), it is easy to show that
which means that for Dice and Jaccard metrics we can decompose overall variety (
) into two components, related variety and what we call unrelated variety. For comparison, we also include a traditional measure of unrelated variety as the entropy of regional employment distribution at the two-digit industry levelFootnote8:
(12)
(12) After deriving these measures, we re-estimate the models, including the measures of unrelated variety alongside the measures of related variety ().
Table 3. Regional innovation output and (un)related variety.
In restricted models (without control variables), both related and unrelated variety appear to be positively and significantly associated with regional innovation, irrespective of the chosen measure. Once we include control variables, however, the coefficient for the entropy-based measure of related variety turns insignificant, while corresponding unrelated variety measure seems to have a positive significant association with regional innovation output.
In case of two measures that account for the indirect linkages between industries, related variety variables remain significant in the models with control variables, while unrelated variety loses its significance. As in the case of models reported in , related variety based on Jaccard metrics (that accounts not only for the presence, but also for the strength of industry linkages) demonstrates the most consistent performance as a predictor of regional innovation output (based on Akaike and Schwarz information criteria).
All in all, the models in suggest that related variety measures accounting for indirect linkages between industries provide a better prediction for regional innovation output. This suggests, once again, that we need to extend the definition of what is ‘related’ in related variety beyond direct industry relatedness ties. When it comes to the unrelated variety variable, its performance is mixed. This might have to do with the fact that related and unrelated variety may have differential impact on innovations of different quality. To investigate this claim, in we estimate the models with regional share of innovations with varying degree of novelty as dependent variable.
Table 4. Quality of regional innovation and (un)related variety.
With regards to radical (explorative) innovation, our results align with previous studies (Castaldi, Frenken, and Los Citation2015; Miguelez and Moreno Citation2018): related variety is negatively associated with the share of radical innovations in regional innovation output, while unrelated variety has a positive relationship. The results imply that when it comes to explorative innovations, which supposedly require (re)combination of highly unconnected knowledge and/or technologies, higher degree of related variety in regional industry structure is not only less important but can even be damaging.
We also estimate the relationship between related variety and less radical innovation. When it comes to major improvements, the results are exactly the opposite to totally new innovations: the share of major improvements is positively associated with related variety and negatively associated with unrelated variety. This suggests that less radical innovation benefits from the presence of more related regional industry structures, which makes knowledge exchange between industries easier.
We also estimate a regression model for incremental improvements, which does not report any significant results. This might have to do with the fact that incremental improvements represent a minor share of innovations in SWINNO database. Besides, the innovation indicator used already at the outset represents a selection of significant innovations and hence, by construction, only captures incremental innovations inasmuch as they are incremental to the firm’s knowledge base, but have some societal significance, for example, by implying a larger leap in performance. Another possible explanation is that incremental improvements might be less dependent on knowledge (re)combination and regional environment and more dependent on trial and error and internal firm innovation processes.
Importantly, in all models in , related variety measures that account for indirect industry linkages between industries outperform entropy-based measures, which provides additional support for our hypotheses. Here, we can speculate that in the long-term setting it becomes particularly important to account for inter-temporal changes in what is considered ‘related’ in related variety. In other words, one needs to emphasize the dynamic nature of relatedness (Kuusk and Martynovich Citation2021).
6. Discussion and conclusion
Results of our study provide an extension to the common argument that related variety in regional industry composition tends to enhance regional innovation output. Our findings are in line with previous studies: related variety is good for innovation in general (Aarstad, Kvitastein, and Jakobsen Citation2016; Antonietti and Cainelli Citation2011; Castaldi, Frenken, and Los Citation2015; Ejdemo and Örtqvist Citation2020; Miguelez and Moreno Citation2018; Tavassoli and Carbonara Citation2014; Wixe Citation2018), while unrelated variety is more conducive to radical breakthrough innovation (Barbieri, Perruchas, and Consoli Citation2020; Castaldi, Frenken, and Los Citation2015; Miguelez and Moreno Citation2018). Yet, we provide several qualifications to these claims.
Looking at the patterns of exploration versus exploitation of knowledge, related variety has a negative association with exploration (radical innovation) and positive relationship with exploitation, viz. innovations that build on previous knowledge within firms (compare to Castaldi, Frenken, and Los Citation2015; Miguelez and Moreno Citation2018). This has obvious corollaries for our understanding of regional transformation. Regional environments characterized by higher degree of unrelated variety in their industrial structure are better positioned for radical industrial renewal and absorbing disruptive technology shifts. Conversely, regions with strong related variety in synergistic but traditional industries, would tend to exploit established trajectories and knowledge bases. In this light, the decoupling of innovation activity observed between metropolitan and non-metropolitan regions (see and Figures A1.1–A1.3 in the online supplement) can be understood as driven by the greater unrelated variety in metropolitan areas. This is in line with hypotheses about technology shifts as driven by metropolitan areas (Henning, Lundquist, and Olander Citation2016; Lundquist, Olander, and Martynovich Citation2017), as well our understanding of regional diversification (Boschma Citation2017; Neffke, Henning, and Boschma Citation2011).
Our main contribution lies in engaging with the empirical operationalization of relatedness – that is, with what is ‘related’ in related variety. We argue that the commonly used approach to defining related activities – based on the hierarchy of official industry classifications – is too restrictive as it limits the scope of potential channels of knowledge spillovers between industries (Firgo and Mayerhofer Citation2017) and, importantly in the long-term setting, does not account for changes in industry linkages over time (Kuusk and Martynovich Citation2021). We argue, on theoretical grounds, that the type of relatedness that matters for innovation should be conceived as dynamic and recombinant and put these notions into operationalization. Our empirical results support these theoretical vantage points and imply that future research, empirical and theoretical, should consider these characteristics of relatedness.
In particular, using network analysis tools, we develop a set of measures that incorporate these theoretical arguments. Estimating the relationship between innovation output and industry composition of Swedish regions between 1991 and 2010, we demonstrate that measures of related variety based on dynamic recombinant relatedness outperform conventional related variety indicators. We do so in a range of models looking at both total innovation output and novelty degree of regional innovation, as well as models in models that do and do not account for unrelated variety in regional industry mixes. In that respect, our methodological contribution is in providing better empirical operationalization of the (un)related variety concept.
The original related variety argument (Frenken, Van Oort, and Verburg Citation2007) was based on the claim that theoretical notions of specialization and diversity popular in the debate about agglomeration economies are too simplistic to capture the complexity of regional industry composition (Content and Frenken Citation2016). Our results, in turn, suggest that the notion of related variety itself should be qualified even further to come closer to its hypothesized role as the conduit of knowledge spillovers. In particular, estimating regional knowledge production functions requires operationalization of related variety that accounts for indirect linkages between industries and incorporates the possibility for technological change by treating relatedness as a dynamic concept.
For one thing, what is ‘related’ is redefined over time. Indeed, when firms engage in knowledge search beyond their own industry, they do so at a particular moment in time characterized by a certain technological paradigm that defines the potential to engage in constructive knowledge exchange. In that respect, related activities are not given, but are continuously defined by search processes and knowledge recombination by firms.
Besides, traditional operationalizations of what is ‘related’ are based on a binary logic: economic activities are either (directly) related or not. We show that accounting for indirect linkages between industries makes the operationalization of related variety more complete. More generally, this implies that one needs to account for the middle ground in the dichotomy between related and unrelated variety. Potentially, the most constructive approach would be to go completely beyond the binary logic and to treat relatedness as a continuous variable given that new activities are always directly or indirectly connected from the regions existing knowledge base (Boschma Citation2017). This would help to shift the discussion from whether certain activities are related or not to how knowledge spillovers between different industries are channelled more explicitly (Whittle and Kogler Citation2020). This would mean coming much closer to conceptualize and estimate the role of relatedness for recombinant innovation.
The primary focus of this study was to understand regional environments that are conducive to innovation. This has been done by investigation the empirical relationship between regional innovation output and the degree of related variety in regional industry structures. Future studies could account more explicitly for how various firms make use of the potential for knowledge exchange and (re)combination (operationalized through related variety) in their innovation process. Such firm-level studies could also account for other types of relatedness, such as institutional (Punt et al. Citation2022) or market (Chang, Eggers, and Keum Citation2022) relatedness as well as how knowledge exchange within the region (underpinned by regional industry composition) is combined with extra-regional knowledge exchange in the innovation process.
Online_supplementnew.pdf
Download PDF (344.6 KB)Disclosure statement
No potential conflict of interest was reported by the author(s).
Additional information
Funding
Notes
1 In the remainder of the paper, when we talk about relatedness, we imply industry linkages, while when we mention related variety, we refer to regional industry composition.
2 Since previous studies estimating relationship between innovation and regional industry composition employ related variety measures based on the hierarchical structure of official industry classifications that are not subject to change (Castaldi, Frenken, and Los Citation2015; Ejdemo and Örtqvist Citation2020; Miguelez and Moreno Citation2018; Tavassoli and Carbonara Citation2014), all variation in related variety comes from the structural change (i.e., shares of industry shares in regional employment) at the regional level. We argue that related variety measures should additionally account for changes in relatedness linkages between industries.
3 Recent literature suggests that the notion of related variety can transcend the knowledge and technological domain. For example, it has been suggested that institutional (Punt et al. Citation2022) and market (Chang, Eggers, and Keum Citation2022) relatedness is important for new knowledge generation and innovation. In this paper, we limit related variety to its knowledge component.
4 To our best knowledge, all previous studies analysing the relationship between innovation output and related variety employ this measure.
5 Top five regions here are Hofors, Säffle, Västerås, Laxå, Örnskoldsvik.
6 Technical details of calculating and determining significance of
are presented in A2 in the online supplement.
7 Notations are similar to those in equation (7).
8 Notations are similar to those in equation (6).
References
- Aarstad, J., O. Kvitastein, and S. Jakobsen. 2016. “Related and Unrelated Variety as Regional Drivers of Enterprise Productivity and Innovation: A Multilevel Study.” Research Policy 45 (4): 844–856. doi:10.1016/j.respol.2016.01.013.
- Acs, Z., L. Anselin, and A. Varga. 2002. “Patents and Innovation Counts as Measures of Regional Production of new Knowledge.” Research Policy 31 (7): 1069–1085. doi:10.1016/S0048-7333(01)00184-6.
- Adamic, L., and E. Adar. 2003. “Friends and Neighbors on the Web.” Social Networks 25 (3): 211–230. doi:10.1016/S0378-8733(03)00009-1.
- Almeida, P., and B. Kogut. 1999. “Localization of Knowledge and the Mobility of Engineers in Regional Networks.” Management Science 45 (7): 905–917. doi:doi:10.1287/mnsc.45.7.905.
- Andersson, M., and C. Karlsson. 2007. “Knowledge in Regional Economic Growth—The Role of Knowledge Accessibility.” Industry and Innovation 14 (2): 129–149. doi:10.1080/13662710701252450.
- Antonietti, R., and G. Cainelli. 2011. “The Role of Spatial Agglomeration in a Structural Model of Innovation, Productivity and Export: A Firm-Level Analysis.” The Annals of Regional Science 46 (3): 577–600. doi:10.1007/s00168-009-0359-7.
- Arthur, W. 2007. “The Structure of Invention.” Research Policy 36 (2): 274–287. doi:10.1016/j.respol.2006.11.005.
- Barbieri, N., F. Perruchas, and D. Consoli. 2020. “Specialization, Diversification, and Environmental Technology Life Cycle.” Economic Geography 96 (2): 161–186. doi:10.1080/00130095.2020.1721279.
- Boschma, R. 2005. “Proximity and Innovation: A Critical Assessment.” Regional Studies 39 (1): 61–74. doi:10.1080/0034340052000320887.
- Boschma, R. 2017. “Relatedness as Driver of Regional Diversification: A Research Agenda.” Regional Studies 51 (3): 351–364. doi:10.1080/00343404.2016.1254767.
- Boschma, R., R. Eriksson, and U. Lindgren. 2009. “How Does Labour Mobility Affect the Performance of Plants? The Importance of Relatedness and Geographical Proximity.” Journal of Economic Geography 9 (2): 169–190. doi:10.1093/jeg/lbn041.
- Breschi, S., and F. Lissoni. 2009. “Mobility of Skilled Workers and co-Invention Networks: An Anatomy of Localized Knowledge Flows.” Journal of Economic Geography 9 (4): 439–468. doi:10.1093/jeg/lbp008.
- Castaldi, C., K. Frenken, and B. Los. 2015. “Related Variety, Unrelated Variety and Technological Breakthroughs: An Analysis of US State-Level Patenting.” Regional Studies 49 (5): 767–781. doi:10.1080/00343404.2014.940305.
- Chang, S., J. Eggers, and D. Keum. 2022. “Bottleneck Resources, Market Relatedness, and the Dynamics of Organizational Growth.” Organization Science 33 (3): 1049–1067. doi:10.1287/orsc.2021.1479.
- Content, J., and K. Frenken. 2016. “Related Variety and Economic Development: A Literature Review.” European Planning Studies 24 (12): 2097–2112. doi:10.1080/09654313.2016.1246517.
- Ejdemo, T., and D. Örtqvist. 2020. “Related Variety as a Driver of Regional Innovation and Entrepreneurship: A Moderated and Mediated Model With Non-Linear Effects.” Research Policy 49 (7): 104073. doi:10.1016/j.respol.2020.104073.
- Firgo, M., and P. Mayerhofer. 2017. “(Un)Related Variety and Employment Growth at the Sub-Regional Level.” Papers in Regional Science, doi:10.1111/pirs.12276.
- Fitjar, R., and B. Timmermans. 2017. “Regional Skill Relatedness: Towards a new Measure of Regional Related Diversification.” European Planning Studies 25 (3): 516–538. doi:10.1080/09654313.2016.1244515.
- Fleming, L. 2001. “Recombinant Uncertainty in Technological Search.” Management Science 47 (1): 117–132. doi:10.1287/mnsc.47.1.117.10671.
- Frenken, K., F. Van Oort, and T. Verburg. 2007. “Related Variety, Unrelated Variety and Regional Economic Growth.” Regional Studies 41 (5): 685–697. doi:10.1080/00343400601120296.
- Gössling, T., and R. Rutten. 2007. “Innovation in Regions.” European Planning Studies 15 (2): 253–270. doi:10.1080/09654310601078788.
- Hassink, R., A. Isaksen, and M. Trippl. 2019. “Towards a Comprehensive Understanding of new Regional Industrial Path Development.” Regional Studies 53 (11): 1636–1645. doi:10.1080/00343404.2019.1566704.
- Hassink, R., C. Klaerding, and P. Marques. 2014. “Advancing Evolutionary Economic Geography by Engaged Pluralism.” Regional Studies 48 (7): 1295–1307. doi:10.1080/00343404.2014.889815.
- Henning, M., K. Lundquist, and L. Olander. 2016. “Regional Analysis and the Process of Economic Development: Changes in Growth, Employment and Income.” In Structural Analysis and the Process of Economic Development, edited by J. Ljungberg, 149–173. New York: Routledge.
- Hidalgo, C. 2021. “Economic Complexity Theory and Applications.” Nature Reviews Physics 3 (2): 92–113. doi:10.1038/s42254-020-00275-1.
- Iammarino, S. 2005. “An Evolutionary Integrated View of Regional Systems of Innovation: Concepts, Measures and Historical Perspectives.” European Planning Studies 13 (4): 497–519. doi:10.1080/09654310500107084.
- Ingstrup, M. J., and M.-P. Menzel, 2019. “The emergence of relatedness between industries: The example of offshore oil and gas and offshore wind energy in Esbjerg, Denmark”. Papers in Evolutionary Economic Geography (PEEG) 1929. Utrecht: Department of Human Geography and Spatial Planning, Utrecht University.
- Jacobs, J. 1969. The Economy of Cities. New York: Vintage Books.
- Janssen, M. 2015. Service Innovation in an Evolutionary Perspective. Eindhoven: Eindhoven Technical University.
- Juhász, S., T. Broekel, and R. Boschma. 2021. “Explaining the Dynamics of Relatedness: The Role of co-Location and Complexity.” Papers in Regional Science 100 (1): 3–21. doi:10.1111/pirs.12567.
- Kander, A., J. Taalbi, J. Oksanen, K. Sjöö, and N. Rilla. 2019. “Innovation Trends and Industrial Renewal in Finland and Sweden 1970–2013.” Scandinavian Economic History Review 67 (1): 47–70. doi:10.1080/03585522.2018.1516697.
- Kleinknecht, A., and D. Bain, eds. 1993. New Concepts in Innovation Output Measurement. London: Palgrave Macmillan.
- Kuusk, K., and M. Martynovich. 2021. “Dynamic Nature of Relatedness, or What Kind of Related Variety for Long-Term Regional Growth.” Tijdschrift Voor Economische en Sociale Geografie 112 (1): 81–96. doi:10.1111/tesg.12427.
- Lundquist, K., L. Olander, and M. Martynovich. 2017. “The Technology Shift Thesis: Understanding Long Term Growth and Transformation in a Regional System.” In Research Reports in Human Geography 2017:1. Lund: Department of Human Geography, Lund University.
- Makkonen, T., and R. van der Have. 2013. “Benchmarking Regional Innovative Performance: Composite Measures and Direct Innovation Counts.” Scientometrics 94 (1): 247–262. doi:10.1007/s11192-012-0753-2.
- Marshall, A. 1890. Principles of Economics. London: Macmillan.
- Miguelez, E., and R. Moreno. 2018. “Relatedness, External Linkages and Regional Innovation in Europe.” Regional Studies 52 (5): 688–701. doi:10.1080/00343404.2017.1360478.
- Miozzo, M., and D. Grimshaw. 2005. “Does EDS Add Value? The Expansion of IT Outsourcing and the Nature and Role of Computer Services Firms” In DRUID Tenth Anniversary Summer Conference 2005, Copenhagen, Denmark.
- Neffke, F., and M. Henning. 2013. “Skill Relatedness and Firm Diversification.” Strategic Management Journal 34 (3): 297–316. doi:10.1002/smj.2014.
- Neffke, F., M. Henning, and R. Boschma. 2011. “How do Regions Diversify Over Time? Industry Relatedness and the Development of new Growth Paths in Regions.” Economic Geography 87 (3): 237–265. doi:10.1111/j.1944-8287.2011.01121.x
- Neffke, F., A. Otto, and A. Weyh. 2017. “Inter-industry Labor Flows.” Journal of Economic Behavior & Organization 142: 275–292. doi:10.1016/j.jebo.2017.07.003.
- Noteboom, B. 2000. Learning and Innovation in Organizations and Economies. Oxford: Oxford University Press.
- Noteboom, B., W. Van Haverbeke, G. Duysters, V. Gilsing, and A. van den Oord. 2007. “Optimal Cognitive Distance and Absorptive Capacity.” Research Policy 36 (7): 1016–1034. doi:10.1016/j.respol.2007.04.003.
- Punt, M., T. Bauwens, K. Frenken, and L. Holstenkamp. 2022. “Institutional Relatedness and the Emergence of Renewable Energy Cooperatives in German Districts.” Regional Studies 56 (4): 548–562. doi:10.1080/00343404.2021.1890708.
- SCB. 2016. “Longitudinell Integrationsdatabas för Sjukförsäkrings- och Arbetsmarknadsstudier (LISA) 1990–2013.” In Arbetsmarknad och Utbildning Bakgrundsfakta 2016:1. Örebro: SCB.
- Simon, H. 1991. “Bounded Rationality and Organizational Learning.” Organization Science 2 (1): 125–134. http://www.jstor.org/stable/2634943 doi:10.1287/orsc.2.1.125
- Sjöö, K. 2014. Innovation and Transformation in the Swedish Manufacturing Sector, 1970–2007. Lund: Lund University.
- Sjöö, K., J. Taalbi, A. Kander, and J. Ljungberg. 2014. “SWINNO: A Database of Swedish Innovations, 1970–2007.” In Lund Papers in Economic History. General Issues; No. 133. Lund: Department of Economic History, Lund University.
- Storper, M., and A. Venables. 2004. “Buzz: Face-to-Face Contact and the Urban Economy.” Journal of Economic Geography 4 (4): 351–370. doi:10.1093/jnlecg/lbh027.
- Taalbi, J. 2014. Innovation as Creative Response: Determinants of Innovation in the Swedish Manufacturing Industry, 1970–2007. Lund: Lund Univeristy.
- Taalbi, J. 2017. “What Drives Innovation? Evidence from Economic History.” Research Policy 46 (8): 1437–1453. doi:10.1016/j.respol.2017.06.007.
- Taalbi, J. 2019. “Origins and Pathways of Innovation in the Third Industrial revolution1.” Industrial and Corporate Change 28 (5): 1125–1148. doi:10.1093/icc/dty053.
- Tavassoli, S., and N. Carbonara. 2014. “The Role of Knowledge Variety and Intensity for Regional Innovation.” Small Business Economics 43 (2): 493–509. doi:10.1007/s11187-014-9547-7.
- Weitzman, M. 1998. “Recombinant Growth.” The Quarterly Journal of Economics 113 (2): 331–360. doi:10.1162/003355398555595.
- Whittle, A., and D. Kogler. 2020. “Related to What? Reviewing the Literature on Technological Relatedness: Where we are now and Where Can we go?” Papers in Regional Science 99 (1): 97–113. doi:10.1111/pirs.12481.
- Wixe, S. 2018. “Neighbourhood Related Diversity, Human Capital and Firm Innovation.” Papers in Regional Science 97 (2): 217–252. doi:10.1111/pirs.12255.