
 ?Mathematical formulae have been encoded as MathML and are displayed in this HTML version using MathJax in order to improve their display. Uncheck the box to turn MathJax off. This feature requires Javascript. Click on a formula to zoom.
ABSTRACT
Border regions have often been analyzed regarding cohesion and convergence. However, their development in times of crisis is a relatively new field of interest. This study combines convergence and resilience measurement and explores how both concepts relate. The empirical operationalization is a time series based on GDP trends since the financial crisis for all European border and non-border regions. Firstly, results show that border regions have a lower resistance than non-border regions, but they show a higher recoverability. This finding calls for policy reflections on how to improve short-term resistance in border regions. Secondly, the overall convergence trends are more positive in border regions than in non-border regions. This finding reflects a general catching-up process due to border liberalization and cohesion policy. Thirdly, the more convergent the national state, the more resilient its border regions tend to be. Finally, this study shows that border regions must be seen as territorial objects with high potential and often a strength, but short-term vulnerability is highly relevant.
1. Introduction
The European Union (EU) and the term convergence are closely linked. Concretely speaking, candidate countries must fulfil certain economic criteria that promise development on a similar level as the member states (European Commission Citation2020a). Furthermore, the EU strives for economically convergent development amongst the member states and supports this with a cohesion policy. This is a significant challenge, as diverse cultures, political convictions, and different societies shape the EU (Bufon Citation2006). Moreover, ruptures in territorial cohesion have recently appeared due to severe crises. The financial crisis in 2008, the refugee movements in 2015/2016, the COVID pandemic in 2020/2021, and the current war against Ukraine show the increasing scale and intensity of crises (Brakman, Garretsen, and van Witteloostuijn Citation2020; Gong et al. Citation2020). These crises impact convergence processes in the EU (cf. Fedajev et al. Citation2021; Gräbner, Heimberger, and Kapeller Citation2020; Martinho Citation2021; Monfort Citation2020). In this context, resilience is a prominent conceptual frame for political, public, and academic debates, capturing the regions’ response to external shocks.
Border regions play a particular role in this context. They are considered ‘laboratories of Europe’, and the European idea is probably most evident there (European Commission Citation2021). However, cohesion in border regions remains a substantial political challenge, raising questions about resilience. In crises, national interests are often in the foreground (cf. Lara-Valencia and García-Pérez Citation2021). Border regions, which represent the core element of European integration, can suddenly become ‘forgotten’ regions due to border controls or even closures (cf. Böhm Citation2021; Goolsbee and Syverson Citation2020). The free movement of workers is then partially restricted, and the Schengen Agreement suspended (c.f. Evrard and Chilla Citation2021; Novotný and Böhm Citation2022; Peyrony, Rubio, and Viaggi Citation2021). In this respect, border regions are at a disadvantage, as they depend directly on cross-border interaction, which is hampered or restricted in times of crisis (Chilla et al. Citation2022; Goolsbee and Syverson Citation2020; Kajta and Opiłowska Citation2022 ; Weber Citation2022). As a result, they tend to be more vulnerable and less able to act in the short term. Crisis management on one side of the border can also impact the other. In the long run, however, increased cooperation due to critical experiences might even strengthen the border regions (Prokkola Citation2019). Cross-border governance plays a key role, and governance is amongst the main resilience enhancers (OECD Citation2014), particularly ‘good governance’, connecting heterogeneous actors (Chilla and Lambracht Citation2022; Wong Villanueva, Kidokoro, and Seta Citation2022).
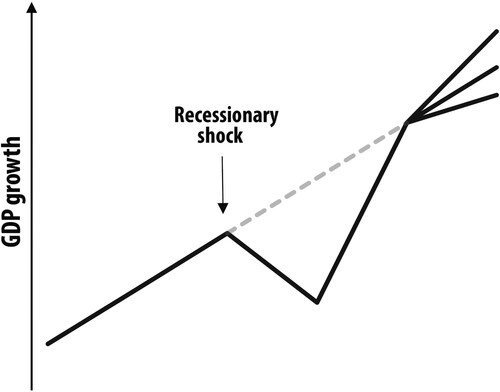
illustrates the influence of crises on regional growth trends (cf. Martin Citation2012). An unforeseen shock event leads to a certain degree of adverse reaction that takes a shorter or longer time to overcome. After that, different future growth paths can be relevant. In the long run, growth trends can decrease, stagnate, or even increase after crises.
Figure 1. Different shock impacts on an economic growth path (own draft based on Martin Citation2012).
So far, convergence and resilience have mainly been discussed separately, in general and in border studies. However, the question is whether there is a relationship between these two strands. This study investigated the convergence and resilience of border and non-border regions on different scales across the EU. In addition to a pan-European analysis, the ‘old’ and ‘new’ EU member states (2004 EU enlargement) and Northern and Southern EU states were compared. Furthermore, this work compared convergence and resilience within Germany. This case study allowed the examination of ‘old’ and ‘new’ intra-European borders. Border regions are defined from a functional perspective, which enables comparisons to domestic regions. In addition, descriptive statistics, e.g. dispersion measures or indexation, allow a quantitative statement on the respective convergence developments and (regional) resilience. The following research questions were addressed:
How do crises affect convergence processes in border regions?
Are border regions more resilient than non-border regions?
In what ways are convergence and resilience interconnected?
2. Conceptual framework
2.1. Convergence
Fundamentally, the concept of convergence describes the reduction or equalization of differences (Paas et al. Citation2007). Convergence is a temporal process in which two or more spatial units become more similar (Barro et al. Citation1991). Economies on a low economic level are supposed to grow faster than mature economies, leading to a typical convergence phenomenon (Barreiro-Pereira Citation2011). Existing disparities can lead to compensatory flows, such as interregional migration of labor or capital (Cavallaro and Dianin Citation2019). In this context, however, interactions between different countries are not (always) sufficient for convergence (ESPON Citation2010). This article defines convergence as a process of getting more similar amongst different spatial units. In the case study of European regions, the guiding principle of the EU is in the sense of equivalence of living conditions. At the internal borders of the EU, existing regional differences are pronounced. In European border regions, different economic structures and socio-cultural conditions meet each other. This article examines to what extent similarities or differences are present in border and non-border regions.
There are different approaches to examining the concept of convergence. Barro et al. (Citation1991) as well as Barro and Sala-i-Martin (Citation1992) describe the so-called β-convergence. It explains that countries on a lower economic level have a higher growth rate than countries on a higher level. This leads to a catching-up process for poorer countries. Furthermore, they describe the so-called σ-convergence approach, which measures economic changes in growth. Decreasing disparities within a country or region represent a convergence process (cf. Barro et al. Citation1991; Sala-i-Martin Citation1996). In addition, grouping concepts like ‘club convergence’ (Chatterji and Dewhurst Citation1996) enable comparisons and the identification of similarities and differences in a spatially differentiated manner. This study measured convergence on a regional level with a fine-scale dataset and assumed that the economical similarity between regions is the ‘ultimate’ convergence level. Therefore, the concept of σ-convergence was used, which measures the change of disparities over time.
Convergence is one of the criteria for EU accession. Different national economic indicators (e.g. price stability, debt level, exchange rate stability) are linked to the EU convergence objective (European Commission Citation2020a). However, the overall convergence process, which started in the 1950s, was interrupted by the financial crisis of 2008 (Goecke Citation2013). Mediterranean countries like Portugal, Spain, Italy, and Greece, as well as Ireland, were seriously affected, leading to divergence in Europe. This illustrates that fundamental changes, such as crises, accession processes, or political-economic decisions, can alter convergence (c.f. Oplotnik, Vojinović, and Acharya Citation2011).
Szymańska and Zalewska (Citation2018) analyzed the convergence process between EU-15 and EU-13 states. Significant differences are still striking between the old and new member states. At the regional level, Butkus et al. (Citation2018) describe a convergence process at all levels within the EU only between 2000 and 2009. They also found a divergent development (σ-divergence) at the regional level from 2009 to 2014. Further, Postiglione, Cartone, and Panzera (Citation2020) show that the regional differences in the EU increased during the financial crisis in 2008, and the previously convergent development ended. Concerning border regions, Artelaris et al. (Citation2011) describe a non-linear growth process and, thus, a convergence process on the European level. Jakubowski (Citation2020) reveals economic asymmetry for European border regions and states significant disparities within these regions. He underlines the need for greater attention to disparity development in border regions. Finally, Hippe and Chilla (Citation2021) identify different convergence patterns for Czech-German border regions at a lower territorial level.
The existing research findings using the concept of ‘club convergence’ show heterogeneous spatial effects of the EU economic integration process (Artelaris Citation2015; Mazzola and Pizzuto Citation2020). For example, Artelaris, Kallioras, and Petrakos (Citation2010) illustrate a divergence process between the 1990s and the 2000s for most regions in Northern and Western Europe. Furthermore, regional convergence within the EU tends to change faster than the convergence process on the national level (Corrado, Martin, and Weeks Citation2005; European Commission Citation2020b). Even if a state shows a convergent development towards the EU average, there might be a divergent development within the state simultaneously (Martin Citation2005). These findings focus on EU regional policy (Petrakos and Artelaris Citation2009).
For a long time, academics considered convergence the optimum for the integration process within the EU. Crises strongly impact the convergence process in the EU-27 and can give rise to divergence (Liviu-Stelian, Silvia, and Oana Citation2014). The intensification of crises and political tensions brings divergence arguments high on the agenda (Gong et al. Citation2020; Scholz Citation2019). The underlying postulate is that convergence processes depend on the appearance of crises. The better a region or nation overcomes crises, the less negatively its convergence process is supposed to be affected.
2.2. Resilience
Resilience refers to the ability of a system to recover, reposition, and evolve after a shock or disruption (Fingleton, Garretsen, and Martin Citation2012; Martin Citation2012). This system can be an individual, an ecosystem, a city, a region, or a national economy (Giacometti et al. Citation2018). Some systems survive shocks unscathed due to their ‘ability to absorb’ such disturbances. In this case, the protective mechanisms and preparations for an emerging shock event are optimal (Martin and Sunley Citation2020; Muštra, Šimundić, and Kuliš Citation2016).
Resilience thinking assumes that the future is uncertain and unexpected (Bonß Citation2016). The OECD also describes resilience as anticipating stresses, risks, and shocks and responding appropriately (OECD Citation2014). Overall, stresses refer to long-term trends that weaken economic stability and increase vulnerability. For example, Giannakis and Papadas (Citation2021) show that an aging population weakens resilience. The concept of ‘slow burn’ (Pendall, Foster, and Cowell Citation2010) is closely related to these stresses. Regional problems that developed over a more extended period without being successfully counteracted become a burden for the region (Martinho Citation2021). For example, increasing unemployment or adherence to a non-profitable economic path can be seen as slow burns (cf. Appel and Hardaker Citation2021). This development tends to make regions more vulnerable to crises (OECD Citation2014).
The OECD (Citation2014) measures the risks mentioned above by probabilities and shocks described by the event itself. These abrupt, disruptive events can occur as a single shock or a series of shocks to the system (Martin Citation2012). Risks and shocks can be divided into three categories (OECD Citation2014):
Covariate: Rare events that have an impact on all systems, e.g. financial shocks
Idiosyncratic: Events that specifically affect individuals or local communities, e.g. the closure of a major industry
Seasonal: Recurring events, such as market fluctuations or annual floods
Risks and shocks can be global, national, local, social, political, or environmental (Giacometti et al. Citation2018). One category does not exclude the other; for example, global shocks can impact the local level and vice versa (Sensier, Bristow, and Healy Citation2016). Examples include the financial crisis of 2008 or the COVID pandemic of 2020/2021. Both originated in a local shock that turned into a global crisis. The literature identifies two possible ways of dealing with a shock or crisis. Systems can either ‘bounce back’ or ‘bounce forward’ (Simmie and Martin Citation2010). The former means returning to the pre-crisis baseline by restoring previous conditions. The latter refers to the creation of a new path. The evolutionary perspective postulates that old initial conditions and unproductive activities are transformed into new ones, and a different normality emerges in future growth paths (Bonß Citation2016; Hu and Hassink Citation2015; Muštra, Šimundić, and Kuliš Citation2016).
The impact of a crisis differs between spatial units (cf. Giannakis and Bruggeman Citation2017). While a nation-state may respond positively to a particular crisis, some of its regions may be significantly negatively impacted. An additional regional perspective of resilience is therefore appropriate. The regional economic resilience approach takes up the complex regional perspective (Martin and Sunley Citation2015; Sensier, Bristow, and Healy Citation2016). The approach describes the economic response of regions (including the social and institutional dimensions) to different types of shock events (Di Caro Citation2015). Accordingly, Martin and Sunley (Citation2020) describe regional resilience as a multi-layered process consisting of five key elements:
Risk: the vulnerability of regional enterprises and workers to different types of shocks
Shock: the origin, source, and duration of a shock
Resistance: the impact of the shock on the regional economy
Adaptability: describes how regional enterprises, institutions, and workers deal with the shock
Recoverability: the degree and direction of recovery after a shock
All these elements are essential to comprehensively understanding resilience in a regional context. The elements of resistance, adaptability, and recoverability depend on the magnitude, nature, and duration of the shock to the regional economy. Regional specifics and previous political and economic decisions also matter (Martin et al. Citation2016; Sensier, Bristow, and Healy Citation2016). Our understanding of regional economic resilience followed this concept and was used to compare European border and non-border regions from an economic perspective.
A key question in this research is why some regions can respond better to changing conditions and are thus more resilient than others (cf. Hassink Citation2010; Ubago Martínez et al. Citation2019). Therefore, the perception of the shock itself plays a vital role because it triggers the reaction to the shock event. For example, Davids (Citation2021) compared the Dutch and Taiwanese regions in terms of resilience and found that the crucial difference between them is what is perceived as a threat. In addition, different cultures, political systems, or economic traditions meet in border regions. These and other factors can influence resilience and explain regional differences. The following subsection reflects on resilience and convergence in border regions regarding previous research. This perception ultimately determines their response to a shock event.
2.3. Linking convergence and resilience in border regions
In general, spatial factors play a significant role in convergence and resilience, specifically in border regions. Limited sales markets, language barriers, increased transport costs, or poorer accessibility are specific challenges. Border regions are located at the interfaces and are often significantly affected by economic crises or political turbulence. Dynamics can also influence economic development in neighboring regions (Christopherson, Michie, and Tyler Citation2010; Ertur, Le Gallo, and Baumont Citation2006). Even if spatial interaction can lead to convergence in border regions, integration and convergence do not necessarily correlate (cf. De Boe, Grasland, and Healy Citation1999; Decoville et al. Citation2010; Topaloglou et al. Citation2005). However, Barreiro-Pereira (Citation2011) postulates that real convergence between border regions helps avoid crises.
The 2015 refugee crisis in Europe and the ongoing COVID pandemic clearly show that cross-border interactions are fragile (c.f. Tarvet and Klatt Citation2023 ). Border regions were vulnerable in terms of cross-border mobility (Evrard, Nienaber, and Sommaribas Citation2020 ) as borders were closed and controls were reintroduced in several countries. Crisis management and resilience in border regions are being established in the political discourse (Evrard and Chilla Citation2021; Novotný Citation2022). Nevertheless, open borders and stability in border regions remain important topics (Longo Citation2017). Unpredictable shocks trigger political turbulences, leading to mobility restrictions and possible convergence changes (Böhm Citation2021). Therefore, inhabitants in border regions are often the first to be confronted with these shocks.
The long-term ability to adapt the border regions’ institutional and economic structures to critical impacts is crucial. Prokkola (Citation2019) recognized an opportunity alongside the short-term challenges. In the long term, new pathways can be identified to renew regional growth (cf. Boschma Citation2015). This corresponds to the potential of open borders to function as a resource (Blatter Citation2004; O’Dowd Citation2002; Sohn Citation2014). A series of factors can affect resilience in border regions. Multi-level governance is amongst the most prominent resilience enhancers (cf. Bristow and Healy Citation2014). The quality of cross-border cooperation, the degree of institutionalization, and the relationship of trust in all sectors are considered good preconditions (cf. Böhm Citation2021; Jakola and Prokkola Citation2018). Furthermore, political relationships, socio-cultural connections, informal networks as well as long-standing business relationships support resilience (Prokkola Citation2019).
The conceptual debates on convergence and resilience serve as a framework for the following empirical study. The main objective of this study was to examine the effects of crises on the convergence process in European border regions. Comparing the border and non-border regions will shed light on whether their resilience differences exist. A further aim was to investigate a possible link between convergence and resilience.
3. Methodology
3.1. Data
Convergence and resilience are often measured with one major economic indicator (cf. Artelaris Citation2015; Di Caro Citation2020; Martinho Citation2021; Mazzola and Pizzuto Citation2020). In this article, we use the indicator GDP/capita for the analysis of convergence and resilience. The GDP is among the most meaningful economic indicators and strongly correlates with prosperity and well-being indicators (Almeida, de Ehrl, and Moreira Citation2021). This study is based on Eurostat (Citation2021) data at NUTS0 and NUTS3 levels. French data had to be supplemented from ESPON (Citation2021), as they are not available at Eurostat.
The focus on economic resilience measured with GDP has a clear advantage in the transparent operationalization and harmonized data availability. GDP per capita is one of the most reasonable indicators to make a small-scale comparison at the pan-European level. However, this indicator does not capture social polarization within a region, geopolitical trade-offs, or ecological externalities (Giacometti et al. Citation2018; Sensier, Bristow, and Healy Citation2016). The analysis focuses mainly on the financial crisis of 2008, which can be classified as a covariate shock (cf. OECD Citation2014). Data from 2000 to 2018 at the NUTS3 level and until 2019 at NUTS0 cover a considerable period before and after the crisis. This captures the long-term effects of the financial crisis (cf. Goecke and Hüther Citation2016; Martin and Sunley Citation2020).
This study considered different spatial levels to address the matter of scale described in the literature (cf. Corrado, Martin, and Weeks Citation2005; Dasí González, Montesinos Julve, and Vela Bargues Citation2018). Moreover, the core of the analysis is the comparison of spatial units. This comparative approach follows the evolutionary economic perspective. Firstly, the Pan-European level (NUTS0) comprises the groups of ‘old’ and ‘new’ EU member states (EU accession before 2004 and from 2004 onwards). This categorization on a large scale reflects the prominence of transformation processes within the EU (c.f. Bachtler, Mendez, and Oraže Citation2014). Secondly, European border and non-border regions were compared on a fine scale (NUTS3), differentiating between the ‘old’ and ‘new’ member state contexts. Additionally, Northern and Southern border regions were compared following the discussion on EU spatial planning and development ‘families’ (Knieling and Othengrafen Citation2015). Furthermore, existing studies show that Southern European countries were hit harder by the financial crisis (cf. Goecke and Hüther Citation2016). Finally, possible differences between border and non-border regions were explored. In the third step, the focus falls on the example of the German border and non-border regions (NUTS3). The German case is of particular interest as it combines various geographical contexts, including morphological and economic diversity amongst its neighbors. Germany is embedded in various political border settings, having borders to ‘old’ EU countries (e.g. France and Denmark), ‘new’ EU countries (Czech Republic and Poland), and a border to Switzerland, which is not part of the EU.
Border regions in this study are defined as administrative units (NUTS3 regions with at least 25% of their area within a 25 km buffer along the border) adjoining a national border. Other regions not included in this definition are categorized as non-border regions. This functional definition enables a quantitative comparison between the border and non-border regions.
3.2. Measuring convergence and resilience
3.2.1. Convergence
Convergence was measured by examining σ-convergence. The concept of σ-convergence measures changes in growth indicators by using the standard deviation over time (cf. Barro et al. Citation1991; Sala-i-Martin Citation1996). The measurement of dispersion determines σ-convergence. It indicates the strength of the spatial unit’s disparities and development. The coefficient of variation (cv) is expressed with the following formula:
Here, σ represents the standard deviation and μ the mean value. The quotient is multiplied by 100 for a percentage result. The coefficient of variation was calculated for each spatial unit and every year. The course of the curve allows for statements concerning σ-convergence and -divergence. Furthermore, changes and kinks in the graph may indicate crisis effects. The higher the value of the coefficient, the greater the disparities. If the disparities within the spatial unit decrease, the dispersion declines, and the coefficient decreases (Goecke and Hüther Citation2016; Monfort Citation2020).
3.2.2. Resilience
Referring to Fingleton, Garretsen, and Martin (Citation2015), the following measuring problems of regional resilience were addressed:
Shock event: the financial crisis in 2008
Determinants of resilience: growth of GDP/capita
Indicator: GDP/capita
Unit of study: NUTS0 and NUTS3
Linkage back to other studies: case studies EU
In doing so, we followed the concept of Martin and Sunley (Citation2020), who describe regional resilience as a multi-layered process. Further, resistance, adaptability, and recoverability were measured, and the growth rates between two years were calculated to determine the consequences of the crisis as follows:
Resistance: 2008 (pre-crisis level) to 2009 (short-term impact)
Adaptability: 2009 (rock bottom of the impact) to 2010 (short-term adaptability)
Recoverability: 2009 (rock bottom of the impact) to 2018 (long-term recoverability)
Overall growth pattern: 2000–2018
The following formula was applied:
R indicates the growth rate between the two years, Xt1 represents the progressive annual value of the region in the starting year, and xt2 stands for the reference year of the same reference unit.
3.2.3. Linking convergence and resilience
Another aim of this article was to analyze a possible link between convergence and resilience. The Bravais-Pearson correlation coefficient (rxy) was used and can be defined as follows:
cxy represents the covariance between the two variables – convergence (coefficient of variation) and resilience (indexation value for GDP/capita growth of border and non-border regions). sx and sy stand for the standard deviations of both variables. Positive values indicate a positive correlation (rising straight trend line in a scatter plot), and negative values a negative correlation (falling straight trend line). Values close to 0 indicate no linear correlation between the variables. Moreover, weak, medium-strong, and strong correlations were shown by rxy values of 0.5 and less, between 0.5 and 0.8, and between 0.8 and 1, respectively.
Furthermore, the indexation for a comparison between the growth rates of the border and non-border regions (resilience variable) was applied with the following formula:
Here, Y indicates the indexed comparing value between the border and non-border regions. xbor represents the progressive annual value of the border regions, and xnon designates the non-border regions within the same reference unit. For percentage values, the quotient was multiplied by 100. Values greater than 100 show that the border regions have a higher growth pattern; if the value is less than 100, the non-border regions have higher growth values.
4. Results
illustrates the change in the coefficient of variation from 2000 to 2019 on a pan-European level. It also differentiates the trend for ‘old’ and ‘new’ EU member states. The graph for Europe as a whole shows a convergent development over time and thus indicates σ-convergence. This overall convergence process within the EU was observed from 1950 until the financial crisis of 2008 (Goecke Citation2013; Monfort Citation2020). This is confirmed by the graphical kink in 2009 and the slight divergent development until 2014 (cf. Röhl Citation2018). In the following years, a renewed convergence process was initiated.
Figure 2. Convergence trend on a pan-European level (own draft; data source: Eurostat Citation2021).
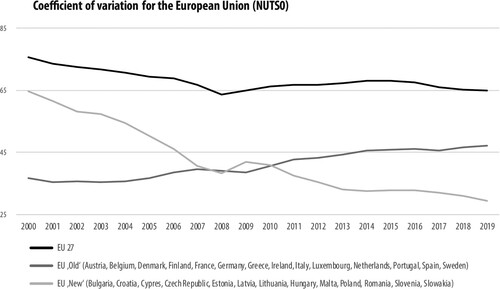
The two graphs of the ‘old’ and ‘new’ member states differ significantly. A large σ-convergence is evident for the ‘new’ member states. Even the crisis had only a small impact on the general convergence process. In contrast, the ‘old’ member states show a divergent development among themselves over the entire period. Accordingly, the differences among the ‘old’ member states are becoming more prominent. This pattern shows the relevance of differentiating ‘new’ and ‘old’ member states’ regions.
4.1. Convergence and resilience in border and non-border regions
presents a detailed differentiation of different levels of convergence in Europe based on the coefficient of variation. In addition, the GDP growth from 2000 to 2018 for border and non-border allows for a comparative view. Finally, convergence and resilience trends are illustrated for border and non-border regions in EU 27, EU ‘Old’, ‘New’, ‘North’, ‘South’ and Germany.
Figure 3. Convergence and resilience trends for border and non-border regions (own draft; data source: ESPON Citation2021; Eurostat Citation2021).
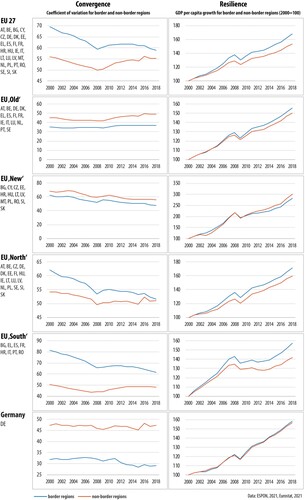
The first row presents the results for the pan-European level. The coefficient of variation for border regions on the EU 27 level is above the values for non-border regions. This implies that non-border regions are more convergent and have lower disparities. Before the financial crisis, both groups show a convergent development (σ-convergence). However, the crisis in 2008 caused a turning point, and a σ-divergence process started for both (cf. Butkus et al. Citation2018). The non-border regions are not in a position to reverse this trend before 2018, and the pre-crisis level cannot be reached at all. Thus, the financial crisis caused a persistent σ-divergence and increased existing disparities in European non-border regions.
In border regions, the situation is different. In 2013, a second turning point and a renewed σ-convergence process became apparent. In 2018, the convergence level reached the pre-crisis level for the first time. By referring to , we can conclude an overall convergence trend within the EU. In contrast, the patterns for border and non-border regions illustrate different and more detailed pictures of the convergence process within the EU (see ). In particular, not all regions of the EU demonstrate a renewed convergence process after the crisis. This is true for border regions, but non-border regions diverge strongly from the pan-European pattern. Thus, this analysis supports the scale issue mentioned earlier (cf. Corrado, Martin, and Weeks Citation2005; Dasí González, Montesinos Julve, and Vela Bargues Citation2018). In terms of resilience, the curve for the border regions rises more steeply than for the non-border regions, indicating a more substantial growth development in border regions. Nevertheless, the trajectories of the curves within the crisis period look quite similar at first glance.
The second row indicates that the coefficient of variation in the ‘old’ EU member states is relatively constant over time. However, border regions show a stronger similarity than non-border regions. The crisis only slightly impacted the convergence process for both categories. For non-border regions, the crisis led to a slightly divergent development, but not for the border regions. This picture matches the convergence patterns of the ‘new’ and ‘old’ groups at the national level. Moreover, border regions show slightly higher growth than non-border regions. In addition, they show similar patterns to the pan-European findings above. Finally, border regions have a lower resistance but higher adaptability and recoverability than non-border regions.
In the third row, the border and non-border regions of the ‘new’ EU member states show a strong convergence process. However, the similarity amongst border regions is higher than amongst non-border regions. In contrast to the pan-European level, border regions are more convergent than non-border regions. The crisis had only a slight impact on convergence as well. Finally, both curves show a similar trend to the ‘new’ member states at the national level and show similar trends in GDP growth. The resilience findings on this level differ from all other scales: border regions show a higher resistance and lower recoverability to the crisis.
In the fourth row, the convergence and resilience trends are illustrated for the northern EU regions. In the beginning, the non-border regions of the northern EU member states are more convergent than the border regions. However, the non-border regions remain at the same level over time, and the border regions converge towards this level. In 2018, both were almost at the same convergence level. Here, too, the crisis only slightly impacted the convergence processes. Regarding GDP per capita, border regions show more extensive growth than non-border regions between 2000 and 2018. Compared to non-border regions, the resistance of border regions is lower, but the adaptability is higher. Interestingly the long-term recoverability of border regions is higher again.
The fifth row on the southern EU regions demonstrates border and non-border regions showing significant initial differences. The coefficient of non-border regions is much smaller than that for border regions. While the curve of the non-border regions continues almost constantly until 2018, border regions show a clear convergence process and converge to the level of non-border regions. The GDP growth graphs deviate strongly from the previous cases. The effects of the crisis are visible since, on the one hand, the short-term kink can be seen more clearly. On the other hand, it takes until 2014 to state GDP growth again. Southern European border and non-border regions show a lower resistance to the financial crisis (cf. Goecke Citation2013; Postiglione, Cartone, and Panzera Citation2020). Overall, however, the border regions show higher resistance and recoverability.
Finally, the last row represents the results for the German case. The chart line for the German border regions is at a lower level than for the non-border regions. The low values imply that the disparities within the German border regions are smaller than amongst the non-border regions. The curve of the non-border regions is almost consistently at the same level and shows no significant changes over time. Even the financial crisis indicates only a marginal influence on the chart line. In contrast, the graph of the border regions shows a different trend from 2008 on. Border regions show σ-convergence until 2018. Accordingly, the crisis impacts the German border and non-border regions differently. In terms of resilience, German border and non-border regions have similar patterns. Still, border regions have a lower resistance but show higher values for adaptability and recoverability. Further analyses of the German border regions show an overall convergent development, which is not included in the graphic. Concerning resilience, the individual border regions differ. The border regions to Poland and the Czech Republic stand out, as they have a higher resistance to the financial crisis and show a lower short-term impact. This difference between ‘old’ and ‘new’ German neighbor regions is similarly relevant as it was on the level of ‘new’ EU regions above.
In addition, growth values for different periods were calculated to further analyze the resistance, adaptability, and recoverability for all spatial categories. illustrates resilience values for border and non-border regions. The columns represent the ‘crisis phases’ and the rows the spatial level. A closer look reveals that most border regions were affected more in the short-term and showed a lower resistance. The ‘new’ EU border regions show the only exception by having better resistance than non-border regions. For the adaptability phase, four out of six spatial categories have higher values for border regions. Most border regions in this study confirmed the positive long-term trend after the shock event by having a higher recoverability than non-border regions.
Table 1. Resilience values for border and non-border regions for all categories.
4.2. Linking convergence and resilience
Summarizing the considered levels, apparent differences between the border and non-border regions can be identified for convergence. In terms of resilience, border regions show lower resistance (except for the ‘new’ EU regions). However, with a few exceptions, border regions show somewhat higher adaptability and significantly higher recoverability. In any case, the scale level is essential for considering convergence and resilience.
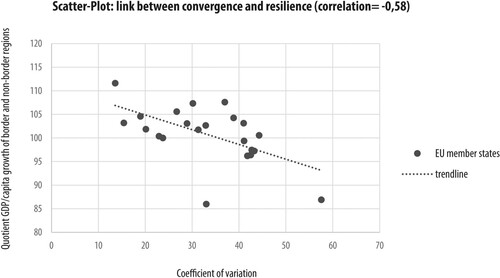
Up to this point, the link between convergence and resilience remains an open question. Convergent development does not necessarily lead to greater resilience; conversely, divergence does not lead to greater vulnerability to crises. However, a more specific statistical investigation allows deeper scrutiny of the relationship between convergence and resilience. This step is based on the Bravais-Pearson correlation coefficient calculated for the national level of the EU. The value of the coefficient of variation in 2018 represents convergence. Resilience refers to the post-crisis regional GDP growth between 2009 and 2018. The GDP growth index was calculated for both categories to compare European border and non-border regions, and a value of −0.58 indicates a medium-strong correlation.
shows the relationship between resilience and convergence utilizing a scatter plot. On the x-axis, the coefficient of variation represents the convergence (the smaller, the greater the convergence), and the y-axis represents the GDP growth ratio for border and non-border regions. The larger the value, the higher the recoverability for border regions compared to non-border regions. Suppose the two outlier values with low resilience values for border regions (Ireland and Lithuania) are removed. In that case, the correlation is reduced to −0.57 but remains in the range of a medium-strong correlation. For the link between convergence and resilience, it can be concluded that the greater the national convergence, the greater the resilience of border regions, or on the other hand, the more divergent a nation is, the more resilient the non-border regions.
Figure 4. Linking convergence and resilience (own draft; data source: ESPON Citation2021; Eurostat Citation2021).
5. Discussion
The first research question focused on the impact of crisis effects on convergence processes in border regions and vice versa. The overall pattern at the level of spatial categories is obvious (‘new’ member states, Southern European, the German case, etc.): Results show that for all these categories, convergence trends for border regions tend to be stronger than for non-border regions (or divergence weaker). Furthermore, the financial crisis harmed the convergence process in all case studies, even if it lasted only for a relatively short period. These results are in line with Butkus et al. (Citation2018) and Postiglione, Cartone, and Panzera (Citation2020), who found adverse effects on convergence within Europe due to the financial crisis in 2008/2009. For European border regions, economic asymmetry is also confirmed (cf. Jakubowski Citation2020). However, all European cases in this study become more similar concerning the level of convergence. Therefore, decreasing asymmetries would lead to increasing convergence in the future. However, it remains open to what extent this is realistic in the wake of the current crises (COVID-19 pandemic, energy crisis).
The second research question focused on the resilience of border and non-border regions. All categories illustrate a bounce back and return to the original growth path (cf. Bonß Citation2016; Muštra, Šimundić, and Kuliš Citation2016). In the short term, the financial crisis affects most border regions stronger than non-border regions. Thus, border regions have a lower resistance. This links back to the long-standing peripheral positioning of border regions and the new cross-border dynamics due to liberalization (Christopherson, Michie, and Tyler Citation2010). In the long run, however, the border regions show more growth. Accordingly, the long-term recoverability is higher, and the negative effects of the crisis are better dealt with (cf. Martin and Sunley Citation2020). This agrees with Prokkola (Citation2019), who describes border cooperation as an opportunity and functioning cross-border linkages as an amplifier of (long-term) regional resilience.
The third research question addressed the link between convergence and resilience in border and non-border regions. European-wide, a certain relation exists within the member states. The higher the overall convergence within a country, the higher the resilience of border regions compared to non-border regions. In short, national convergence supports border regions’ resilience (and/or vice versa). This result opens a new perspective, as previous research has discussed both concepts separately. In terms of the European integration process, resilience could play an essential role as a convergence parameter, especially in border regions. A strengthening of national convergence could, therefore, positively influence the resilience of vulnerable border regions in the short term. Future studies could further differentiate this new perspective and the initial findings.
The lower short-term resistance of border regions fits the finding of Lara-Valencia and García-Pérez (Citation2021), who state that national interests are often paramount. Stronger convergence in the long run results from accelerated transformation processes. The differences in convergence patterns within the spatial categories are not trivial to explain. Political decisions and the general economic context play a key role (Oplotnik, Vojinović, and Acharya Citation2011). However, this study has not operationalized the reasons for (non) convergent and (non) resilient development paths and their relationship. At this point, we leave open the following plausible explanations that apply most:
The ongoing catch-up processes of border regions due to border liberalization are interrupted at short notice but not stopped or even fueled in the long run – which would be the classical economic explanation (neo-classical equilibrium postulate).
Functional and territorial assets result in a function of the border ‘as a resource’, profiting from particular differentials, high intercultural competencies, etc.
‘Hidden’ territorial factors, such as the degree of urbanization and accessibility, play a crucial role but have not been scrutinized yet.
A systematic analysis of different spatial scales can provide more comprehensive explanations in future research. Furthermore, a differentiation between different types of border regions is necessary. Here, comparisons between metropolitan and rural areas and border regions with strong and weak governance are promising. Finally, we agree with Slusarciuc (Citation2017), Prokkola (Citation2019), and Jakubowski (Citation2020), who call for further empirical and theoretical research in border regions to describe the phenomena of convergence and border resilience.
6. Conclusion and outlook
The findings can be summarized in three main results with a policy dimension. Firstly, border regions have a lower resistance than non-border regions but show higher recoverability. This has been shown with the example of the financial crisis that is not specifically linked to border issues. That might be different for more border-specific crises in terms of border controls and management measures, like in the pandemic case. In these cases, the short-term effects are expected to be higher. This finding calls for policy reflections on how to improve short-term resistance in border regions. At the same time, the high recoverability shows a high potential of the so-called ‘laboratories of Europe’ (cf. European Commission Citation2021). Secondly, the overall convergence trend is more positive in border regions than in non-border regions. This finding reflects a general catching-up process due to border liberalization and cohesion policy. These positive trends indicate that European integration seems to ‘work’ for border regions. Thirdly, the more convergent the national state, the more resilient its border regions tend to be. This might be a positive finding from the perspective of border regions. However, regarding territorial development in general, a similar resilience of border and non-border regions would be the optimum. It has to remain an open question if the differences between border and non-border regions will disappear with increased European integration processes. From a conceptual perspective, the link between convergence and resilience opens a new perspective. In terms of the European integration process, resilience could play an important role as a convergence parameter.
A key question is how the progressive integration process affects the development of border regions. It is plausible that resilience and convergence will be linked (more strongly) when European integration proceeds. Furthermore, the development patterns between the border and non-border regions might converge. However, for the moment, the question of how to improve both resilience and convergence processes remains essential. This study shows that border regions have to be seen as territorial objects with high potential and often strength, but that, in particular, short-term vulnerability is highly relevant.
Acknowledgements
The authors thank the reviewers for constructive remarks that significantly improved our paper.
Disclosure statement
No potential conflict of interest was reported by the author(s).
Additional information
Funding
References
- Almeida, R., P. de Ehrl, and T. Moreira. 2021. “Social and Economic Convergence Across Brazilian States Between 1990 and 2010.” Social Indicators Research 157: 225–246. Advance online publication. https://doi.org/10.1007/s11205-021-02659-x
- Appel, A., and S. Hardaker. 2021. “Strategies in Times of Pandemic Crisis—Retailers and Regional Resilience in Würzburg, Germany.” Sustainability 13 (5): 2643. https://doi.org/10.3390/su13052643.
- Artelaris, P. 2015. “Local Versus Regime Convergence Regression Models: A Comparison of Two Approaches.” GeoJournal 80 (2): 263–277. https://doi.org/10.1007/s10708-014-9551-0.
- Artelaris, P., D. Kallioras, and G. Petrakos. 2010. “Regional Inequalities and Convergence Clubs in the European Union New Member States.” Eastern Journal of European Studies 1 (1): 113–133.
- Artelaris, P., D. Kallioras, L. Topaloglu, and M. Tsiapa. 2011. Detecting the Growth Pattern(s) of the EU Border Regions: A Convergence Clubs Approach. New Challenges for European Regions and Urban Areas in a Globalised World: 51st ERSA Congress. European Regional Science Association. http://hdl.handle.net/10419/119906
- Bachtler, J., C. Mendez, and H. Oraže. 2014. “From Conditionality to Europeanization in Central and Eastern Europe: Administrative Performance and Capacity in Cohesion Policy.” European Planning Studies 22 (4): 735–757. https://doi.org/10.1080/09654313.2013.772744.
- Barreiro-Pereira, F. 2011. “Conflicts and Convergence in the Southwestern–European Border: Spain, South-Spain and the Maghreb (1995–2010).” In Contributions to Conflict Management, Peace Economics and Development. Governance, Development and Conflict, vol. 18, edited by M. Chatterji, D. Gopal, and S. Singh, 147–184. Emerald Group Publishing Limited. https://doi.org/10.1108/S1572-8323(2011)0000018009
- Barro, R., and X. Sala-i-Martin. 1992. “Convergence.” Journal of Political Economy 100: 223–251. https://doi.org/10.1086/261816
- Barro, R., X. Sala-i-Martin, O. Blanchard, and R. Hall. 1991. “Convergence Across States and Regions.” Brookings Papers on Economic Activity 1991 (1): 107. https://doi.org/10.2307/2534639.
- Blatter, J. 2004. “From ‘Spaces of Place’ to ‘Spaces of Flows’? Territorial and Functional Governance in Cross-Border Regions in Europe and North America.” International Journal of Urban and Regional Research 28 (3): 530–548. https://doi.org/10.1111/j.0309-1317.2004.00534.x.
- Böhm, H. 2021. “The Influence of the Covid-19 Pandemic on Czech-Polish Cross-Border Cooperation: From Debordering to re-Bordering?” Moravian Geographical Reports 29 (2): 137–148. https://doi.org/10.2478/mgr-2021-0007.
- Bonß, W. 2016. “The Notion of Resilience: Trajectories and Social Science Perspective.” In New Perspectives on Resilience in Socio-Economic Spheres, edited by A. Maurer, 9–24. Springer VS. https://doi.org/10.1007/978-3-658-13328-3_2
- Boschma, R. 2015. “Towards an Evolutionary Perspective on Regional Resilience.” Regional Studies 49 (5): 733–751. https://doi.org/10.1080/00343404.2014.959481.
- Brakman, S., H. Garretsen, and A. van Witteloostuijn. 2020. “The Turn from Just-in-Time to Just-in-Case Globalization in and After Times of COVID-19.” Social Sciences & Humanities Open 2 (1): 100034. https://doi.org/10.1016/j.ssaho.2020.100034.
- Bristow, G., and A. Healy. 2014. “Regional Resilience: An Agency Perspective.” Regional Studies 48 (5): 923–935. https://doi.org/10.1080/00343404.2013.854879.
- Bufon, M. 2006. “Between Social and Spatial Convergence and Divergence: An Exploration Into the Political Geography of European Contact Areas.” GeoJournal 66 (4): 341–352. https://doi.org/10.1007/s10708-006-9008-1.
- Butkus, M., D. Cibulskiene, A. Maciulyte-Sniukiene, and K. Matuzeviciute. 2018. “What is the Evolution of Convergence in the EU? Decomposing EU Disparities up to NUTS 3 Level.” Sustainability 10 (5): 1552. https://doi.org/10.3390/su10051552.
- Cavallaro, F., and A. Dianin. 2019. “Cross-border Commuting in Central Europe: Features, Trends and Policies.” Transport Policy 78: 86–104. https://doi.org/10.1016/j.tranpol.2019.04.008.
- Chatterji, M., and J. Dewhurst. 1996. “Convergence Clubs and Relative Economic Performance in Great Britain: 1977–1991.” Regional Studies 30 (1): 31–39. https://doi.org/10.1080/00343409612331349458.
- Chilla, T., T. Große, S. Hippe, and B. B. Walker. 2022. “COVID-19 Incidence in Border Regions: Spatiotemporal Patterns and Border Control Measures.” Public Health 202: 80–83. https://doi.org/10.1016/j.puhe.2021.11.006.
- Chilla, T., and M. Lambracht. 2022. “Institutional Mapping of Cross-Border Cooperation. INTERREG Programme Analyses with KEEP Data.” European Planning Studies 1–19. https://doi.org/10.1080/09654313.2022.2058321
- Christopherson, S., J. Michie, and P. Tyler. 2010. “Regional Resilience: Theoretical and Empirical Perspectives.” Cambridge Journal of Regions, Economy and Society 3 (1): 3–10. https://doi.org/10.1093/cjres/rsq004.
- Corrado, L., R. Martin, and M. Weeks. 2005. “Identifying and Interpreting Regional Convergence Clusters Across Europe.” The Economic Journal 115 (502): C133–C160. https://doi.org/10.1111/j.0013-0133.2005.00984.x.
- Dasí González, R., V. Montesinos Julve, and J. Vela Bargues. 2018. “Towards Convergence of Government Financial Statistics and Accounting in Europe at Central and Local Levels.” Revista De Contabilidad 21 (2): 140–149. https://doi.org/10.1016/j.rcsar.2017.10.001.
- Davids, M. 2021. “Local Meets Global: Resilience in Dutch and Taiwanese High-Tech Regions.” Business History, 1–26. https://doi.org/10.1080/00076791.2021.1944111.
- De Boe, P., C. Grasland, and A. Healy. 1999. Spatial Integration, Final Report, Strand 1.4, Study Programme on European Spatial Planning.
- Decoville, A., F. Durand, C. Sohn, and O. Walther. 2010. “Spatial Integration in European Cross-Border Metropolitan Regions: A Comparative Approach.” Working Paper No 2010-40.
- Di Caro, P. 2015. “Recessions, Recoveries and Regional Resilience: Evidence on Italy.” Cambridge Journal of Regions, Economy and Society 8 (2): 273–291. https://doi.org/10.1093/cjres/rsu029.
- Di Caro, P. 2020. Quo Vadis Resilience? Measurement and Policy Challenges: Using the Case of Italy. Edward Elgar Publishing. https://econpapers.repec.org/bookchap/elgeechap/16700_5f6.htm
- Ertur, C., J. Le Gallo, and C. Baumont. 2006. “The European Regional Convergence Process, 1980-1995: Do Spatial Regimes and Spatial Dependence Matter?” International Regional Science Review 29 (1): 3–34. https://doi.org/10.1177/0160017605279453.
- ESPON. 2010. Metroborder: Cross-Border Polycentric Metropolitan Regions; Targeted Analysis 2012/2/3; Final Report 31/12/2010. ESPON and University of Luxembourg. http://euregio.lu/wp-content/uploads/2011/11/metroborder_final_report_de.pdf
- ESPON. 2021. Gross Domestic Product (GDP) at Current Market Prices (PPS Per Inhabitant). https://database.espon.eu/maindata/#/
- European Commission. 2020a. Convergence Report 2020. European Economy Institutional Papers(129).
- European Commission. 2020b. European Economy Forecast. European Economy Institutional Paper: 125 (May 2020). Office for Official Publications of the European Communities. https://ec.europa.eu/info/sites/info/files/economy-finance/ip125_en.pdf; https://doi.org/10.2765/788367
- European Commission. 2021. Grenzregionen in der EU: Reallabors der europäischen Integration.
- Eurostat. 2021. Gross Domestic Product (GDP) at Current Market Prices by NUTS 3 Regions (Euro per inhabitant). https://appsso.eurostat.ec.europa.eu/nui/show.do?dataset=nama_10r_3gdp&lang=en
- Evrard, E., and T. Chilla. 2021. “European (Dis)integration: Implications for the Cohesion Policy.” In EU Cohesion Policy and Spatial Governance. Edward Elgar Publishing. https://www.elgaronline.com/view/edcoll/9781839103575/9781839103575.00016.xml
- Evrard, E., B. Nienaber, and A. Sommaribas. 2020. “The Temporary Reintroduction of Border Controls Inside the Schengen Area: Towards a Spatial Perspective.” Journal of Borderlands Studies 35: 369–383. https://doi.org/10.1080/08865655.2017.1415164.
- Fedajev, A., M. Radulescu, A. Babucea, V. Mihajlovic, Z. Yousaf, and R. Milićević. 2021. “Has COVID-19 Pandemic Crisis Changed the EU Convergence Patterns?” Economic Research-Ekonomska Istraživanja 35: 2112–2141. https://doi.org/10.1080/1331677X.2021.1934507.
- Fingleton, B., H. Garretsen, and R. Martin. 2012. “Recessionary Shocks and Regional Employment: Evidence on the Resilience of U.K.” Journal of Regional Science 52 (1): 109–133. https://doi.org/10.1111/j.1467-9787.2011.00755.x.
- Fingleton, B., H. Garretsen, and R. Martin. 2015. “Shocking Aspects of Monetary Union: The Vulnerability of Regions in Euroland.” Journal of Economic Geography 15 (5): 907–934. https://doi.org/10.1093/jeg/lbu055.
- Giacometti, A., Jukka Teräs, Liisa Perjo, Mari Wøien, H. Sigurjónsdóttir, and Tuulia Rinne. 2018. “Regional Economic and Social Resilience: Conceptual Debate and Implications for Nordic Regions.” https://www.semanticscholar.org/paper/Regional-Economic-and-Social-Resilience%3A-Conceptual-Giacometti-Ter%C3%A4s/9f238652c1406f05e79fe16728eabdd1441d9417
- Giannakis, E., and A. Bruggeman. 2017. “Economic Crisis and Regional Resilience: Evidence from Greece.” Papers in Regional Science 96 (3): 451–476. https://doi.org/10.1111/pirs.12206.
- Giannakis, E., and C. Papadas. 2021. “Spatial Connectivity and Regional Economic Resilience in Turbulent Times.” Sustainability 13 (20): 11289. https://doi.org/10.3390/su132011289.
- Goecke, H. 2013. “Europa driftet auseinander: Ist dies das Ende der realwirtschaftlichen Konvergenz?” IW-Trends – Vierteljahresschrift zur empirischen Wirtschaftsforschung 40 (4): 67–79. https://doi.org/10.2373/1864-810X.13-04-05.
- Goecke, H., and M. Hüther. 2016. “Regional Convergence in Europe.” Intereconomics 51 (3): 165–171. https://doi.org/10.1007/s10272-016-0595-x.
- Gong, H., R. Hassink, J. Tan, and D. Huang. 2020. “Regional Resilience in Times of a Pandemic Crisis: The Case of COVID-19 in China.” Tijdschrift Voor Economische en Sociale Geografie 111: 497–512. Advance online publication. https://doi.org/10.1111/tesg.12447
- Goolsbee, A., and C. Syverson. 2020. Fear, Lockdown, and Diversion: Comparing Drivers of Pandemic Economic Decline 2020. Cambridge, MA. https://doi.org/10.3386/w27432
- Gräbner, C., P. Heimberger, and J. Kapeller. 2020. “Pandemic Pushes Polarisation: The Corona Crisis and Macroeconomic Divergence in the Eurozone.” Journal of Industrial and Business Economics 47 (3): 425–438. https://doi.org/10.1007/s40812-020-00163-w.
- Hassink, R. 2010. “Regional Resilience: A Promising Concept to Explain Differences in Regional Economic Adaptability?” Cambridge Journal of Regions, Economy and Society 3 (1): 45–58. https://doi.org/10.1093/cjres/rsp033.
- Hippe, S., and T. Chilla. 2021. “Cohesion and Resilience in Czech-German Border Regions: The Impacts of Crises.” In Opportunities and Threats to Current Business Management in Cross-Border Comparison 2021, edited by Z. Kresa, 68–78. Chemnitz.
- Hu, X., and R. Hassink. 2015. “Overcoming the Dualism Between Adaptation and Adaptability in Regional Economic Resilience.” Papers in Evolutionary Economic Geography (PEEG) 1533. https://ideas.repec.org/p/egu/wpaper/1533.html
- Jakola, F., and E. Prokkola. 2018. “Trust Building or Vested Interest? Social Capital Processes of Cross-Border Co-Operation in the Border Towns of Tornio and Haparanda.” Tijdschrift Voor Economische En Sociale Geografie 109 (2): 224–238. https://doi.org/10.1111/tesg.12279.
- Jakubowski, A. 2020. “Asymmetry of the Economic Development of Cross-Border Areas in the European Union: Assessment and Typology.” Europa XXI 39: 45–62. https://doi.org/10.7163/Eu21.2020.39.6.
- Kajta, J., and E. Opiłowska. 2022. “The Impact of Covid-19 on Structure and Agency in a Borderland. The Case of Two Twin Towns in Central Europe.” Journal of Borderlands Studies 37: 699–721. https://doi.org/10.1080/08865655.2021.1996259.
- Knieling, J., and F. Othengrafen. 2015. “Planning Culture—A Concept to Explain the Evolution of Planning Policies and Processes in Europe?” European Planning Studies 23 (11): 2133–2147. https://doi.org/10.1080/09654313.2015.1018404.
- Lara-Valencia, F., and H. García-Pérez. 2021. “Las fronteras de la pandemia: lecciones para la gobernanza y la cooperación en las ciudades de la frontera México-Estados Unidos.” Estudios Fronterizos 22. https://doi.org/10.21670/ref.2104067
- Liviu-Stelian, B., S. Silvia, and C. Oana. 2014. “The Effect of Economic Crisis upon Convergence and Cohesion in the European Union.” Procedia Economics and Finance 10: 150–157. https://doi.org/10.1016/S2212-5671(14)00288-3.
- Longo, M. 2017. The Politics of Borders: Sovereignty, Security, and the Citizen after 9/11. Problems of International Politics. Cambridge University Press. https://doi.org/10.1017/9781316761663
- Martin, P. 2005. The Geography of Inequalities in Europe. Sciences Po Publications (info:hdl:2441/9283). https://ideas.repec.org/p/spo/wpmain/infohdl2441-9283.html
- Martin, R. 2012. “Regional Economic Resilience, Hysteresis and Recessionary Shocks.” Journal of Economic Geography 12 (1): 1–32. https://doi.org/10.1093/jeg/lbr019.
- Martin, R., and P. Sunley. 2015. “On the Notion of Regional Economic Resilience: Conceptualization and Explanation.” Journal of Economic Geography 15 (1): 1–42. https://doi.org/10.1093/jeg/lbu015.
- Martin, R., and P. Sunley. 2020. Regional Economic Resilience: Evolution and Evaluation. Edward Elgar Publishing. https://econpapers.repec.org/bookchap/elgeechap/16700_5f2.htm
- Martin, R., P. Sunley, B. Gardiner, and P. Tyler. 2016. “How Regions React to Recessions: Resilience and the Role of Economic Structure.” Regional Studies 50 (4): 561–585. https://doi.org/10.1080/00343404.2015.1136410.
- Martinho, V. 2021. “Impact of Covid-19 on the Convergence of GDP Per Capita in OECD Countries.” Regional Science Policy & Practice13: 55–72. Advance online publication. https://doi.org/10.1111/rsp3.12435
- Mazzola, F., and P. Pizzuto. 2020. “Great Recession and Club Convergence in Europe: A Cross-Country, Cross-Region Panel Analysis (2000–2015).” Growth and Change 51 (2): 676–711. https://doi.org/10.1111/grow.12369.
- Monfort, P. 2020. “Convergence of EU Regions Redux: Recent Trends in Regional Disparities.” European Union Regional and Urban Policy Working Paper No 2/2020.
- Muštra, V., B. Šimundić, and Z. Kuliš. 2016. “Effects of Smart Specialization on Regional Economic Resilience in EU.” https://www.bib.irb.hr/842329
- Novotný, L. 2022. “Effects of ‘Covidfencing’ on Cross-Border Commuting: A Case of Czech-German Borderland.” European Planning Studies 30: 590–607. https://doi.org/10.1080/09654313.2021.1986470.
- Novotný, L., and H. Böhm. 2022. “New Re-bordering Left Them Alone and Neglected: Czech Cross-Border Commuters in German-Czech Borderland.” European Societies 24 (3): 333–353. https://doi.org/10.1080/14616696.2022.2052144.
- O’Dowd, L. 2002. “The Changing Significance of European Borders.” Regional & Federal Studies 12 (4): 13–36. https://doi.org/10.1080/714004774.
- OECD. 2014. “Guidelines for Resilience Systems Analysis.” https://www.oecd-ilibrary.org/development/guidelines-for-resilience-systems-analysis-how-to-analyse-risk-and-build-a-roadmap-to-resilience_3b1d3efe-en
- Oplotnik, Ž., B. Vojinović, and S. Acharya. 2011. “Cross Border Economic Convergence and EU Integration Process.” Lex Localis – Journal of Local Self-Government 9 (2): 179–203. https://doi.org/10.4335/9.2.181-205(2011).
- Paas, T., A. Kuusk, F. Schlitte, and A. Võrk. 2007. “Econometric Analysis of Income Convergence in Selected EU Countries and their Nuts 3 Level Regions.” University of Tartu – Faculty of Economics and Business Administration Working Paper Series (60). https://ideas.repec.org/p/mtk/febawb/60.html
- Pendall, R., K. Foster, and M. Cowell. 2010. “Resilience and Regions: Building Understanding of the Metaphor.” Cambridge Journal of Regions, Economy and Society 3 (1): 71–84. https://doi.org/10.1093/cjres/rsp028.
- Petrakos, G., and P. Artelaris. 2009. “European Regional Convergence Revisited: A Weighted Least Squares Approach.” Growth and Change 40 (2): 314–331. https://doi.org/10.1111/j.1468-2257.2009.00477.x.
- Peyrony, J., J. Rubio, and R. Viaggi. 2021. “The Effects of COVID-19 Induced Border Closures on Cross-Border Regions: An Empirical Report Covering the Period March to June 2020.” Publications Office of the European Union. https://doi.org/10.2776/092793
- Postiglione, P., A. Cartone, and D. Panzera. 2020. “Economic Convergence in EU NUTS 3 Regions: A Spatial Econometric Perspective.” Sustainability 12 (17): 6717. https://doi.org/10.3390/su12176717.
- Prokkola, E. 2019. “Border-regional Resilience in EU Internal and External Border Areas in Finland.” European Planning Studies 27 (8): 1587–1606. https://doi.org/10.1080/09654313.2019.1595531.
- Röhl, K. 2018. “Regionale Konvergenz: Der ländliche Raum schlägt sich gut.” Wirtschaftsdienst 98 (6): 433–438. https://doi.org/10.1007/s10273-018-2312-9.
- Sala-i-Martin, X. 1996. “Regional Cohesion: Evidence and Theories of Regional Growth and Convergence.” European Economic Review 40 (6): 1325–1352. https://doi.org/10.1016/0014-2921(95)00029-1.
- Scholz, C. 2019. “Konvergenz und Divergenz in Europa: Eine kleine Einführung in eine große Herausforderung.” In Europa jenseits des Konvergenzparadigmas, edited by C. Scholz, H. P. Dörrenbächer, and A. Rennig, 15–50. Nomos Verlagsgesellschaft mbH & Co. KG. https://doi.org/10.5771/9783845291413-15
- Sensier, M., G. Bristow, and A. Healy. 2016. “Measuring Regional Economic Resilience Across Europe: Operationalizing a Complex Concept.” Spatial Economic Analysis 11 (2): 128–151. https://doi.org/10.1080/17421772.2016.1129435.
- Simmie, J., and R. Martin. 2010. “The Economic Resilience of Regions: Towards an Evolutionary Approach.” Cambridge Journal of Regions, Economy and Society 3 (1): 27–43. https://doi.org/10.1093/cjres/rsp029.
- Slusarciuc, M. 2017. “Milestones for the Resilience of the Cross-Border Regions.” CES Working Papers 9 (3): 401–422. https://ideas.repec.org/a/jes/wpaper/y2017v9i3p401-422.html
- Sohn, C. 2014. “The Border as a Resource in the Global Urban Space: A Contribution to the Cross-Border Metropolis Hypothesis.” International Journal of Urban and Regional Research 38 (5): 1697–1711. https://doi.org/10.1111/1468-2427.12071.
- Szymańska, A., and E. Zalewska. 2018. “Towards the Goals of the Europe 2020 Strategy: Convergence or Divergence of the European Union Countries?” Comparative Economic Research. Central and Eastern Europe 21 (1): 67–82. https://doi.org/10.2478/cer-2018-0004.
- Tarvet, R., and M. Klatt. 2023. “The Impact of the Corona Crisis on Borderland Living in the Danish-German Border Region with a Special Focus on the two National Minorities.” National Identities 25: 35–52. https://doi.org/10.1080/14608944.2021.1938522.
- Topaloglou, L., D. Kallioras, P. Manetos, and G. Petrakos. 2005. “A Border Regions Typology in the Enlarged European Union.” Journal of Borderlands Studies 20 (2): 67–89. https://doi.org/10.1080/08865655.2005.9695644.
- Ubago Martínez, Y., I. García-Lautre, B. Iraizoz, and P. Pascual. 2019. “Why are Some Spanish Regions More Resilient Than Others?” Papers in Regional Science 98 (6): 2211–2231. https://doi.org/10.1111/pirs.12464.
- Weber, F. 2022. “Cross-border Cooperation in the Border Region of Germany, France, and Luxembourg in Times of Covid-19.” European Societies 24 (3): 354–381. https://doi.org/10.1080/14616696.2022.2076894.
- Wong Villanueva, J., T. Kidokoro, and F. Seta. 2022. “Cross-Border Integration, Cooperation and Governance: A Systems Approach for Evaluating “Good” Governance in Cross-Border Regions.” Journal of Borderlands Studies 37: 1047–1070. https://doi.org/10.1080/08865655.2020.1855227.