
 ?Mathematical formulae have been encoded as MathML and are displayed in this HTML version using MathJax in order to improve their display. Uncheck the box to turn MathJax off. This feature requires Javascript. Click on a formula to zoom.
ABSTRACT
This paper investigates the link between value chain importance and economic growth for the EU24 regions between 2008 and 2018. It finds that relying more on GVCs worsened regional growth during the financial crisis, but led to higher growth in the long run. The results contribute to the literature on regional resilience and the public debate on the impact of shocks and the desirability of GVCs. Furthermore, by separately analyzing the importance of global and regional value chains it contributes to the discussion on the effect of regionalization and provides insights on how the re-configuring of value chains may affect regional growth.
1. Introduction
Global Value Chains (GVCs) and their effect on economic performance has been scrutinized and debated by the popular media, academics and policy makers (Cingolani, Panzarasa, and Tajoli Citation2017; Pahl and Timmer Citation2020), especially since the 2007–2008 global financial crisis (GFC). The 20 years before the GFC were characterized by the rapid growth of international trade, foreign direct investments and global value chains. This was the result of several long-term institutional, technological, political and economic drivers, including the gradual removal of trade barriers and the information and communication technology (ICT) revolution (Antràs Citation2021; Antràs and Gortari Citation2020; OECD Citation2020; UNCTAD Citation2020; World Bank Citation2020).
Following the GFC, a debate emerged among academics and policy makers on whether GVCs tend to magnify or mitigate global shocks (Altomonte et al. Citation2012 Bems, Johnson, and Yi Citation2011; Brakman and van Marrewijk Citation2019; van Bergeijk, Brakman, and van Marrewijk Citation2017; van den Berg and Jaarsma Citation2017). The COVID-19 pandemic has further fueled this debate (Baldwin and Evenett Citation2020; Gereffi Citation2020; Ivanov and Dolgui Citation2020) and discussions on whether policy-makers should intervene and how (Di Stefano Citation2021).
In this paper we aim to contribute to this debate by investigating the relationship between a region’s value chain importance (VCI) during the GFC and its long-term recovery, where VCI is defined as the ratio between value chain income and GDP (IJtsma and Los Citation2020). We do so by using the EUREGIO dataset (Thissen et al. Citation2018), which is the first set of global input-output tables at NUTS2 level for the entire large trading bloc of the European Union covering the years 2000–2010. Drawing from the GVC importance measure of IJtsma and Los (Citation2020), we introduce the Total Value Chain Importance (TVCI), the Regional Value Chain Importance (RVCI) and the Global Value Chain Importance (GVCI) measures. These different variables allow to distinguish the extent to which regional and global value chains account for the value-added generation of given regions. Building on Crescenzi, Luca, and Milio (Citation2016), this paper explores the relationship between value chain importance and the long-term recovery of the EU24 regions, by controlling for crisis-period national macroeconomic conditions and regional factors. Our results show that crisis-period Total and Global Value Chain Importance have a positive relationship with the long-term (2011–2018) economic growth of regions, while we did not detect a robust association between Regional Value Chain Importance and growth.
These results are particularly relevant in the context of the current debate on de-globalization and regionalization (Baldwin and Lopez-Gonzalez Citation2015 Johnson and Noguera Citation2012; Sturgeon, Van Biesebroeck, and Gereffi Citation2008), the shortening of GVCs (Laplume, Petersen, and Pearce Citation2016) and the halting of international fragmentation of production (Livesey Citation2018). The popular media often focuses on the bullwhip effect, the magnified negative shock along the supply chains following a shock (Altomonte et al. Citation2012). The empirical evidence, however, shows no signs of reversed globalization and that the negative effect of embeddedness in global value chains following a shock is mostly concentrated in the immediate aftermath.
The paper is structured as follows. The next section discusses the literature; first the concept and difficulties of measuring regional resilience, then the empirical outcomes on the link between shocks and global value chains. Section three provides the details on the dataset and operationally defines the Value Chain Importance variables and the econometric model specification. Section four describes the results, while the final section offers a discussion of the results and provides a conclusion.
2. Literature review
2.1. Regional economic resilience
The regional resilience literature aims to understand why some regions are able to renew themselves in the face of crises, while others remain locked-in (Martin and Sunley Citation2006). The concept gained renewed interest in the aftermath of the 2008 GFC. This has resulted in the emergence of three streams of literature: neoclassical, ecological and evolutionary (Bhamra, Dani, and Burnard Citation2011). According to the neoclassical perspective, resilience is defined by the resistance to shocks and the speed at which the system can return to its prior, pre-shock (equilibrium) state without having to change the structure of the system (Martin Citation2012). In terms of regional economic resilience, this refers to a region’s ability to ‘bounce back’ to the pre-shock state following an economic shock or crisis (Angulo, Mur, and Trívez Citation2018). This notion of resilience, also referred to as ‘engineering resistance’ (Martin Citation2012), has been used for example by Fingleton, Garretsen, and Martin (Citation2012) in the context of UK regions. In the ecological perspective resilience refers to a region’s ability to absorb and recover from a shock. Through this recovery the region’s ability to restructure and move toward a new equilibrium state is central (Brada, Gajewski, and Kutan Citation2021 Martin Citation2012; Pendall, Foster, and Cowell Citation2010).
The evolutionary regional resilience approach emerged as a critique of the aforementioned two. The engineering and ecological approach are critiqued based on their inherent view of recovering from a shock through returning to either their old or moving to a new equilibrium state. The evolutionary approach is adaptive, in the sense that it stresses the importance on re-orienting the region’s economic system to better interact with other agents and adapt to economic shocks in the future (Kogler Citation2015 Martin Citation2012; Pendall, Foster, and Cowell Citation2010). Moreover, it is also path-dependent, in the sense that regions are viewed in the context of their history (Giannakis and Bruggeman Citation2017; Webber, Healy, and Bristow Citation2018). It is largely through this approach, that a thorough understanding is starting to emerge on how pre-shock economic factors determine whether regions are able to adapt (Boschma Citation2015 Cainelli, Ganau, and Modica Citation2019a; Citation2019b; Diodato and Weterings Citation2015; Frenken, Van Oort, and Verburg Citation2007; Martin and Sunley Citation2015; Citation2020; Tóth et al. Citation2022).
Due to the fuzziness of the concept, academics have faced difficulties in measuring resilience. To address these difficulties, Martin (Citation2012) proposed to break down the concept of resilience into four interacting dimensions; resistance, recovery, re-orientation and renewal. In his articulation, resistance refers to the ability to withstand the negative effect that shocks have on regions, while recovery measures how promptly and how well regions bounce back after a shock. Re-orientation concerns the reconfigurations that take place to prevent the impact of future shocks. The final element; renewal, describes the speed at which the system can return to its prior (pre-shock) growth path. All of the above approaches underscore the interdisciplinary nature of regional resilience and add to its malleability (Christopherson, Michie, and Tyler Citation2010). However, their differences also highlight the ambiguity of the concept (Fröhlich and Hassink Citation2018; Martin and Sunley Citation2015) and the challenges involved in defining, measuring and interpreting resilience (Carpenter et al. Citation2001; Davoudi et al. Citation2012; MacKinnon and Derickson Citation2013). Critics of the concept raise awareness to the methodological and theoretical difficulties in operationalizing what is really meant by resilience (Fröhlich and Hassink Citation2018; Gong and Hassink Citation2017; Hassink Citation2010). In these critiques three main points are raised; there is too much focus on returning to the equilibrium state, the role of states and policies is typically not considered and lastly, the role of social capital and networks tends to be neglected.
Because of the complexity to operationalize the concept of resilience, there is no consensus in the literature on how, when and what to measure. Depending on the framework of the study, resilience has been measured in relation to the performance of others or in absolute terms. While the timeframe both of when the shock reaches the region and how much it affects them is a question to consider (Sensier, Bristow, and Healy Citation2016). Therefore, regional resilience has been operationalized in numerous ways, from taking a holistic (Rizzi, Graziano, and Dallara Citation2018), through a business-cycle approach, to understanding the resilience indices in a comparative manner. Many (Crescenzi, Luca, and Milio Citation2016; Giannakis and Bruggeman Citation2017; Groot et al. Citation2011 Lane and Milesi-Ferretti Citation2011) have measured resistance by understanding the effect of pre-crisis regional and national factors on the post-crisis performance. These studies generally focus on the short-term impact of a shock and not on recovery. Recovery has been operationalized by Brakman and van Marrewijk (Citation2019) to measure the time to return to the pre-crisis level of trade. However, such survival analysis does not allow to incorporate other macroeconomic conditions and regional factors. Building on the resilience indices approach, where the reference position is the crisis period, recovery period can also be analyzed, by measuring how the crisis period conditions affect the long-term growth of regions.
Despite the difficulties of measuring resilience, many studies have focused on the empirical understanding of what national or regional characteristics drive how regions respond to shocks. A set of key regional structural factors effecting regional paths in the long term have been identified by recent studies. Giannakis and Bruggeman (Citation2017) noted that human capital (such as education level) is a key determinant of resilience at the regional level. They also confirmed the work of Rivera (Citation2012), where they noted that regions that specialized in manufacturing were more likely to experience the impact of economic shocks and recession. The industrial structure of a region has often been used to explain differences in growth for European regions (Martin et al. Citation2016; Martin and Tyler Citation2000). Martin and Sunley (Citation2015) argued that the industrial structure of a region is a crucial component when considering its resilience; where they noted that regions that specialize in technology- and knowledge-led sectors are likely to have increased resilience, due to the innovation focus and adaptable employment features of these sectors. Similarly, Brakman, Garretsen, and van Marrewijk (Citation2015) find that the sectoral composition of a region matters and that regions with greater share of output in medium and high-tech industries were less impacted by the GFC.
2.2. Shocks, GVCs and growth
Only recently did the attention shift to understanding how the network effect of being embedded in GVCs, participating in FDIs and mergers and acquisitions may contribute to the various ways countries respond to shocks (Criscuolo and Timmis Citation2017). Various links have been identified between GVCs (or global supply chains) and growth following a shock. One strand of research highlights the negative effects of the interconnected trade networks. Most notably, the WTO (Citation2009) has linked economic decline to the increase of GVCs in trade, whereas Kleinert, Martin, and Toubal (Citation2012) showed that foreign affiliates transmit shocks in corporate networks. On the other hand, Altomonte et al. (Citation2012) highlighted that it is not only shocks that transfer through supply chains, but also recovery. Brakman, Garretsen, and van Marrewijk (Citation2015) argue that the link between GVCs and resilience stems from regional specialization that is affected by competition.
Furthermore, the effect of international linkages has only been studied at the national or firm level and not in the context of regional resilience. Results are varied, partly due to the level and the geographical scope of the analysis. On the firm level, a negative correlation between exporting, but a positive correlation between importing and firm survival is found by Wagner and Gelübcke (Citation2014). While Altomonte et al. (Citation2012) find that the bullwhip effect leads to both an immediate trade collapse for trade in intermediates, but also a faster rebound. In line with these findings, but at a national level Brakman and van Marrewijk (Citation2019) showed that the GFC only had a short negative effect and by 2011 international fragmentation rebounded. Behrens, Corcos, and Mion (Citation2013) on the other hand conclude that rather than value chains, it is country and product-specific factors that affect trade. Bems, Johnson, and Yi (Citation2011) and van Bergeijk (Citation2012) highlight the dampening effect of GVCs on the fall of world trade.
In conclusion, the extant literature suggests that the level of analysis, as well as the effect of national, regional and sectoral factors and the time-frame considered are all important factors in explaining differences in the results across different studies that look at the relationship between participation in GVC and resilience. It is also important to note that studies that consider the effect of participating in GVCs on regional resilience have been limited by the lack of appropriate data. Our analysis aims at filling this gap by measuring the value chain importance (VCI) of a given region and examining how this affects its growth in value added in the long-run. This long-term view contributes with empirical evidence to a public debate which tends to over-emphasise the short-term impact of global shocks. We use region’s GVA as our dependent variable to avoid the ambiguity linked to concept of ‘resilience’ discussed above.
3. Data and methods
For our investigation we rely on three types of data sets. First of all, we use input-output tables at regional level, which are obtained from the EUREGIO database (Thissen et al. Citation2018). This dataset is used to identify the share of total regional output for manufacturing, agriculture and service sectors, as well as the proportion of capital in value added production. Secondly, we rely on Eurostat regional indicators to measure education, gross value added per capita growth and level. Lastly, we make use of national level variables, such as Eurostat’s government gross debt and the World Bank’s FDI net balance.
3.1. EUREGIO database
The EUREGIO database is the first set of global input-output tables at NUTS2 level for the entire large trading bloc of the European Union covering the years 2000–2010. For each year available, the input-output (trade) flow from each NUTS2 region (or country outside of the EU) to another for each of the 14 sectors is recorded. Totally there are 266 NUTS2 regions and countries and therefore 3724 (266 × 14) units of observations at sectoral level available in each year’s input-output table. In line with the literature, we concentrate only on the trade carried out in the various manufacturing sectors. To do this we take the 5 sectors within the manufacturing industry and discard the rest of the sectors. The 5 sectors are: Food beverages and tobacco; Textiles and leather etc.; Coke refined petroleum nuclear fuel and chemicals etc.; Electrical and optical equipment and Transport equipment; and Other manufacturing. The numbers in the EUREGIO database are in current basic (producers’) prices and are expressed in millions of US dollars.Footnote1
shows a simplified input-output table with only two countries and four regions, which demonstrates the structure of the EUREGIO database at regional level. The inter-regional component (highlighted in the dashed box) is called the transactions matrix and is often denoted by matrix
. Note that the diagonal domestic submatrices (transactions between regions in the same country) are shaded while the off-diagonal submatrices are the transactions crossing country borders. The rows of
record the distributions of the industry outputs throughout the two countries while the columns of
record the composition of inputs required by each region. For example,
is the transaction flow from region
in country
to region
in country
. Note that in this example all the regions buy inputs from themselves (e.g.
), which is often observed with significant amounts in aggregated data. Besides intermediate use, the remaining outputs are absorbed by the additional columns of final demand, which includes household consumption, government expenditure and so forth (here we only show the aggregated final demand for each region). For example,
is the final demand provided by region
in country
. We denote the final demand vector across all regions as
. Similarly, production necessitates not only inter-sector transactions but also labor, management, depreciation of capital and taxes, which are summarized as the additional row of value-added. For example,
is the value-added required by region
in country
. We denote the value-added vector across all regions as
. Finally, for each region, the total output can be computed by summing up either its corresponding row or column. We denote the total output vector across all regions as
.
Table 1. A simplified inter-regional input-output table.
3.2. Measures of value chain importance
If we divide each column of matrix by its corresponding total output in
, we have the so-called technical coefficients matrix and denote it as
. Note that
and it can be rearranged as
. The matrix
is the famous Leontief inverse (Leontief Citation1936) and is often denoted as
.
If we then divide each element of by its corresponding total output in
, we have the value-added share vector and denote it as
. We also define the operation of a ^ (‘hat’) over a vector to result in a diagonal matrix with the vector on its diagonal. Then the value-added contribution matrix
can be computed as follows (Zhu et al. Citation2018):
(1)
(1) For example, its element
is the value-added contribution from region
in country
to region
in country
.
Following IJtsma and Los (Citation2020), we then define the Total Value Chain Importance (TVCI) for region in country
as:
(2)
(2) Note that the denominator
is the sum of the column corresponding to region
in country
in
that is the total sum of Final Demand, i.e. GDP, of region
. The numerator
is the sum of the row corresponding to region
in country
in
, which accounts for the total value added contribution of region
to the rest of the world, i.e. region
’s total value chain income.
For the regions available in the EUREGIO database, we further differentiate the value-added contribution within the European Union from that beyond it. Therefore, the Regional Value Chain Importance (RVCI) for region in country
is:
(3)
(3) That is, the numerator
only includes the value-added contribution from region
in country
to the EU, i.e. region
’s regional value chain income from the EU. On the other hand, the Global Value Chain Importance (GVCI) for region
in country
is:
(4)
(4) Note that for region
in country
,
.
The Value Chain Importance measures are thus suitable to capture value chain involvement in a macroeconomic sense. The VCI measures are based on backward linkages specified in Equation 1. Through the Leontief approach, the VCI measure aims to highlight how each region meets the Final Demand. To highlight the meaning through an example, a 0.1 TVCI of region
means, that region
attributes 10% of its GDP to its value chain income.
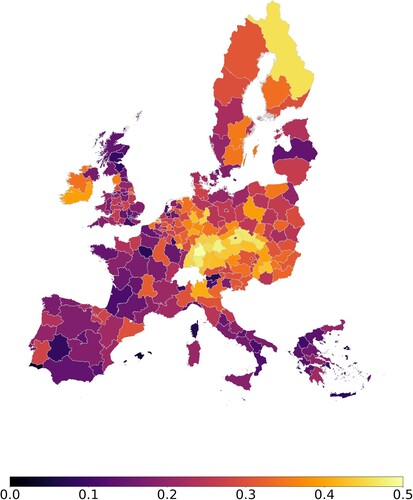
As an example, depicts the variation of TVCI of regions, where the lighter the color the more the region is dependent on GVCs in manufacturing for their value-added generation. shows that during the crisis-period GVC activities were most important for regions like Stuttgart (DE), Upper Palatinate (DE), Tübingen (DE), Central Bohemia (CZ), Northeast Czechia (CZ) and Central Moravia (CZ), where around 30% of GDP was derived from GVC activities. On the other side, Melilla (ES), Inner-London (UK), Ceuta (ES), Algarve (PT), Balearic Islands (ES) and Canary Islands (ES) where less than 6% of their GDP was derived from GVC activities.
Figure 1. TVCI by region during 2008–2010.
3.3. Econometric modelling
To analyze the association between regional economic performance in terms of real growth rates of GVA per capita and the value chain importance measures discussed in the previous section, we apply a linear regression model with country level clustered standard errors, that also includes regional and national macro-economic indicators. We follow the long-term view taken by Crescenzi, Luca, and Milio (Citation2016) and specify the model as below:
(5)
(5) When examining the average annual real growth rates of Gross Value Added (GVA) per capita across regions (see Figure C. in the appendix), we define
as the crisis period from 2008 to 2010 and
as the post-crisis period from 2011 to 2018. The dependent variable
is the average annual real growth rate of regional GVA per capita in region
, belonging to country
, during
.
is the average annual real growth rate of regional GVA per capita in region
, belonging to country
, during
.
is the Total Value Chain Importance (TVCI).
is a vector of national macroeconomic factors which includes FDI net balance and government gross debt as proportion of GDP, while
is a vector of regional indicators which includes education and capital share,
is the error term (for further clarification please refer to Appendix A).
Following the approach taken by Crescenzi, Luca, and Milio (Citation2016), this model relies on GVA growth to understand the change in growth rate from crisis to post-crisis time. Using this development measure is beneficial in light of the research question as shocks to the GVCs affect firms first. This effect then trickles down to labor and consumption. Therefore, it is valuable to focus on understanding how GVCs relate to the value of goods and services produced in an economy. However, a limitation of this measure is that it does not provide insights for the implications for welfare and employment, other factors that GVCs may influence. While Crescenzi, Luca, and Milio (Citation2016) use GVA/capita to control for pre-crisis conditions as is standard when analyzing Solow-type convergence, due to data availability issues in this model we control for average GVA growth per capita. Therefore, these results will not allow us to comment on whether regions converge or diverge post-crisis. Instead, in line with Lane and Milesi-Ferretti (Citation2011) we use average GVA growth as a control to understand whether regions that experienced higher growth also continued to grow post-crisis. Comparing growth rates during and post crisis may highlight the change in trend between the two periods. However, to catch a glimpse of regional convergence post-crisis, another set or regressions are carried out. These models estimate equation (5) and (6) but use average GVA per capita for all EU24 countries but the UK. In these models, we also use country fixed effects to account for spatial effects. In case of GVA/capita, information is unavailable for UK and therefore we use the variable in the robustness checks. The results are presented in Appendix E & H.
A more detailed analysis of value chains requires the separation of regional value chain contributions from global value chain contributions, therefore we divide TVCI into two components RVCI and GVCI and specify an alternative model as below:
(6)
(6) where
and
are the Regional Value Chain Importance (RVCI) and the Global Value Chain Importance (GVCI) respectively in region
, belonging to country
, during
. Again,
. Measuring value chain importance at three different levels sheds light on the effect of regionalization as opposed to globalization and provides further comments on how re-configuring value chains may affect economic performance.
shows the summary statistics of the variables whereas Appendix A shows the data sources and further information on these variables.
Table 2. Summary statistics of the variables.
highlights some interesting insights; the strong negative correlation between RVCI and GVCI, suggests that a region may either rely on regional or global trade links. Furthermore, also presents three variables that have not been discussed in the model specification. Agriculture, manufacturing and service share. Sectoral specification has been explored as it is suggested by literature (Groot et al. Citation2011) that some sectors may be more affected by economic cycles than others. However, as seen in manufacturing and service sectoral share and our variables of interest; TVCI, GVCI are highly correlated. To avoid multicollinearity issues these variables are omitted from the regression presented above (Equation 5 & 6).
Table 3. Correlation of the variables.
4. Results
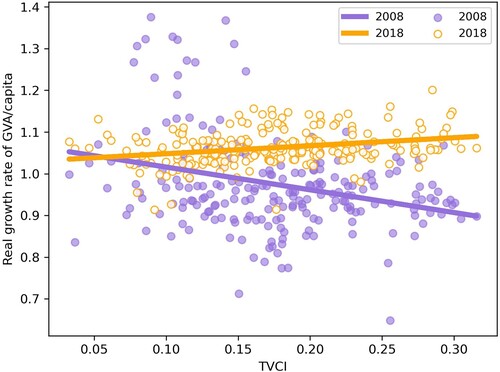
To understand the association between TVCI and per capita GVA growth at regional level, first, we plot . Here, we compare the relationship between the two variables at different points in time, between the first year of the crisis (2008) and the last year of our analysis (2018). demonstrates that even though regions relying more on GVC for the generation of value-added experienced greater shocks during the crisis, they also experienced higher growth post-crisis.
Figure 2. Correlation between TVCI and GVA with regression line.
We estimate equation (5) with a set of linear regression models. presents the results of the regressions. Column (1) shows the baseline model with only controls, column (2) shows the relationship between our dependent variable, the average real growth rates of regional gross value-added after the crisis (GVA T1) and our variable of interest, the crisis period TVCI (TVCI T0), by controlling for the average real growth rates of regional gross value-added (GVA T0) and the national level macroeconomic variables. Column (3) includes the regional factors, while column (4) includes the EU dummies.
Table 4. Regression results with country level clustered standard errors.
Across the various specifications, the positive and significant Total Value Chain Importance (TVCI) variable reflects the importance of being embedded in GVCs for regional GVA growth after the crisis. That is, there is a positive relationship between the long-term economic growth of EU24 regions and their value chain embeddedness measured by TVCI. This means that a 1 percentage point increase of TVCI (i.e. the ratio of total value chain income to GDP) during the crisis predicts a 0.056 percentage point increase in the average annual growth rate of regional GVA/capita post-crisis, ceteris paribus. Most importantly, crisis-time regional GVA per capita has the most consistent positive effect on post-crisis growth across all specification. This suggests that regions that had high growth rate during the crisis, continued to grow post-crisis. However, no inference can be drawn regarding convergence, as it is possible that high-growing regions are experiencing this growth as they have more room to grow. Crisis-period national control of debt and FDI show the expected relationship; the less debt a country has the higher the GVA growth of its regions and higher FDI net balance is associated with higher growth. A likely explanation of this is that countries with high levels of debt during the crisis, were more likely to introduce stricter austerity measures that would slow down growth (Ostry, Loungani, and Furceri Citation2016). Education and capital have no significant association with growth, even though the baseline model indicates some negative relationship between education and GVA growth. Finally, only being in the Eurozone shows statistically significant positive relation to growth among the EU related variables. Being an original member of the EU or having been an Objective 1 region are not statistically significant. Comparing the goodness of fit of the baseline model (1) and column (4) highlights that the controls already explain a large variance of the independent variable, however including the TVCI measure further adds explanatory power.
Secondly, we aim to break down which connections generate the most value-added, whether those from regional or global value chains and which are associated with long-term recovery. presents the results obtained when the value-added contribution is originating from within the EU (RVCI), or instead is international, i.e. from outside of the EU (GVCI). A larger statistically significant GVCI, compared to a RVCI would indicate that regions with stronger international connections achieve higher GVA growth in the long term. Across all columns (2–4), we see that GVCI is statistically significant in explaining GVA growth, while RVCI loses both significance and strength when all the controls are included (column 4). This indicates that not all value chains matter equally, instead international connections are the main driver behind fostering the growth of regional Gross Value Added. As in the first set of regressions presented in , we still find a positive relation between crisis-level GVA growth, FDI and using the euro and post-crisis GVA growth, while the relationship between debt and growth is negative.
Table 5. Regression results with country level clustered standard errors 2.
The regression results with the sub-set of regions excluding those in the UK are presented in Appendix E & H and highlight the non-significant relationship between level GVA/capita during the crisis and post-crisis growth. Furthermore, as a robustness check for spatial effect, we use country fixed effect in the additional models, that result in the emittance of the national level variables. Despite of the insignificant results of GVA/capita, we can confirm that TVCI and GVCI are both positively correlated with growth, similarly to GVA/growth. Suggesting that changing the control on initial economic conditions does not affect our understanding of the variables in question.
We carry out a set of robustness checks on the results of and . We estimate two additional sets of robust OLS regressions, where we include country fixed effects to understand spatial dependencies. The results of these regressions are shown in Section D and G of the Appendix and show consistent results for our variables of interest. The robustness checks confirm a similar magnitude, positive relationship between TVCI, GVCI and regional economic growth.
The last set of robustness checks considers the link between pre-crisis conditions on the long term development of regions. This check is in line with literature on resilience (e.g. Crescenzi, Luca, and Milio Citation2016; Giannakis and Bruggeman Citation2017 Lane and Milesi-Ferretti Citation2011) that consider how conditions prior to the crisis may affect resilience. In this model we use the 3-year average (2004–2006) of pre-crisis (T-1) VCI measures and controls (T-1). The results (shown in Appendix F & I) are consistent with those in and show a statistically significant and positive relation between TVCI, GVCI and GVA/growth in the long-run. However, due to data availability, the sample size is smaller.
Finally, in addition to controlling for spatial effect, the role of spatial spillovers is examined on GVA growth. The spatial autoregressive models show an insignificant effect for the spatial lag and little change of the variables of interest.Footnote2 The Moran’s test is shown in Appendix J, highlighting that we cannot reject the hypothesis that errors are independent and identically distributed.
5. Discussion and conclusion
In this paper, we examine the link between value chain importance – a measure of the degree of embeddedness of a sub-national region in global and/or regional value chains – and regional economic growth measured in terms of per capita GVA growth. We do so by controlling for the national and regional factors that correlate with the gross value-added growth of a region.
In order to shed light on how being embedded in value chains may aid recovery, we generate three value chain importance measures following IJtsma and Los (Citation2020), that measure how much of the value-added generated within a region can be accounted by different value chains. The three measures differentiate between the value-added contribution from the European Union (RVCI), non-European Union (GVCI), as well as a total value-added contribution (TVCI). The three value chain importance measures highlight in more granular detail, how participation in value chains is connected to long-term economic recovery and whether regional or global chains are more important for this purpose. To analyze the link between GVA growth and value chain importance in 226 NUTS2 regions of the EU24 we apply a linear regression model with country level clustered standard errors, that controls for regional and national macro-economic factors. We find that regions with higher value chain importance during the crisis had a higher average GVA growth in the 2011–2018 post-crisis period. We also find a statistically significant positive association between crisis period GVA growth, FDI and using the euro while government gross debt has a negative relation with the dependent variable. Only GVCI has a significant positive link with GVA growth, while RVCI shows no robust relationship across the various models.
Our results provide three take-away messages regarding the impact of GVCs on the long-term recovery of regions. First, regions that are more embedded in value chains suffer more from the magnified bullwhip effect along the chain and hence have small resistance. We can see this from the negative slope of GVA growth and TVCI. The higher the TVCI the lower the GVA growth was in 2008. This suggests the small resistance of GVCs immediately following a shock.
Secondly, however these same regions that had a high TVCI during the crisis also experience a stronger recovery in the long-run. The evolutionary resilience approach may provide possible explanations with regards to these results. As described by Martin (Citation2012), there are various inter-dependent factors of resilience, two of which we have not directly measured in this study; re-orientation and renewal. Since these factors are related to path-dependence, being more embedded into GVCs, means more available connections and the more extensive and more type of links are available, the more options a region has in re-orienting and renewing themselves.
Lastly, we find that only global links are important for long-term regional economic recovery, suggesting that the main driver behind the Value Chain Importance measure are global connections as opposed to regional ones. This finding contributes to the debate on regionalization, de-globalization and resilience. De-globalization – conceptualized in terms of being the least embedded in GVCs – has in our results a negative association with GVA growth. Furthermore, our results also show that regional value chains have no statistically significant relationship to GVA growth. This suggests that while the regionalization of supply chains may not affect growth negatively, it may also not contribute positively to GVA growth. It also illustrates that having only regional (as compared to global) connections may not be more economically beneficial.
The findings of this paper contribute to the debates on the role of GVCs sparked by the 2008 GFC and more recently fueled by the COVID-19 pandemic, geo-political tensions such as Brexit and the US–China trade war and the environmental emergency. In the face of the COVID-19 crisis, popular media echoed the heard-before narrative of snapping supply chains (O’Leary Citation2020), that will bring the end of globalization as we know it (Farrell and Newman Citation2020). These claims resurge at the time of crisis, when GVCs are at their most vulnerable point, but they often fail to incorporate longer-term considerations and address other inter-connected elements of resilience, recovery, re-orientation and renewal.
Further research on this topic would be welcome. We suggest here some possible avenues for future research which are important but beyond the scope of this paper. In this paper we focus on the GVA growth of EU regions and cannot comment on how these findings may differ for non-EU regions. Furthermore, the type of data used in this study does not allow us to comment on how the positioning of a region in GVCs may affect its growth. For example, Crescenzi et al. (Citation2014) in their analysis of FDI location decisions identify different value chain stages. In their work and in the GVC framework manufacturing is seen as one of many stages in a value chain that brings a product from its conception to end use and beyond. Some stages upstream (e.g. R&D) and downstream (e.g. marketing) are seen to add more value than others, such as manufacturing and assembly. This is important for individual firms, which can upgrade by moving towards stages of the value chain with higher value added within the same sector (functional upgrading) or across sectors (sectoral upgrading) (Humphrey and Schmitz Citation2002); and for individual countries that may remain locked in low value adding activities (Gibbon and Ponte Citation2005). It would be interesting to incorporate this in the analysis of how regions’ participation in value chains affect their growth, but the regional trade datasets currently available don’t allow to distinguish across different stages of the value chain.
Supplemental Material
Download MS Word (14.4 KB)Supplemental Material
Download MS Word (14.4 KB)Supplemental Material
Download MS Word (14.6 KB)Supplemental Material
Download MS Word (14.3 KB)Supplemental Material
Download MS Word (14.1 KB)Supplemental Material
Download MS Word (14.4 KB)Supplemental Material
Download JPEG Image (149.1 KB)
Supplemental Material
Download JPEG Image (143.5 KB)
Supplemental Material
Download MS Word (16.3 KB)Disclosure statement
No potential conflict of interest was reported by the author(s).
Notes
1 To avoid inflation bias we calculate proportional measures from the EUREGIO data.
2 These test are not included in the Appendix but are available on request.
References
- Altomonte, C., F. Di Mauro, G. Ottaviano, A. Rungi, and V. Vicard. 2012. “Global Value Chains During the Great Trade Collapse - A Bullwhip effect?” Working Paper Series 1412.
- Angulo, A., J. Mur, and F. Trívez. 2018. “Measuring Resilience to Economic Shocks: An Application to Spain.” The Annals of Regional Science 60 (2): 349–373. https://doi.org/10.1007/s00168-017-0815-8.
- Antràs, P. 2021. “De-Globalisation? Global Value Chains in the Post-COVID-19 Age [online].”
- Antràs, P., and A. Gortari. 2020. “On the Geography of Global Value Chains.” Econometrica 88 (4): 1553–1598. https://doi.org/10.3982/ECTA15362.
- Baldwin, R., and S. Evenett. 2020. “New eBook: COVID-19 and Trade Policy: Why Turning Inward Won’t Work.”
- Baldwin, R., and J. Lopez-Gonzalez. 2015. “Supply-chain Trade: A Portrait of Global Patterns and Several Testable Hypotheses.” The World Economy 38 (11): 1682–1721. https://doi.org/10.1111/twec.12189.
- Behrens, K., G. Corcos, and G. Mion. 2013. “Trade Crisis? What Trade Crisis?” Review of Economics and Statistics 95 (2): 702–709. https://doi.org/10.1162/REST_a_00287.
- Bems, R., R. Johnson, and K.-M. Yi. 2011. “Vertical Linkages and the Collapse of Global Trade.” American Economic Review 101 (3): 308–312. https://doi.org/10.1257/aer.101.3.308.
- Bhamra, R., S. Dani, and K. Burnard. 2011. “Resilience: The Concept, a Literature Review and Future Directions.” International Journal of Production Research 49 (18): 5375–5393. https://doi.org/10.1080/00207543.2011.563826.
- Boschma, R. 2015. “Towards an Evolutionary Perspective on Regional Resilience.” Regional Studies 49 (5): 733–751. https://doi.org/10.1080/00343404.2014.959481.
- Brada, J., P. Gajewski, and A. Kutan. 2021. “Economic Resiliency and Recovery, Lessons from the Financial Crisis for the COVID-19 Pandemic: A Regional Perspective from Central and Eastern Europe.” International Review of Financial Analysis 74: 101658. https://doi.org/10.1016/j.irfa.2021.101658.
- Brakman, S., H. Garretsen, and C. van Marrewijk. 2015. “Regional Resilience Across Europe: On Urbanisation and the Initial Impact of the Great Recession.” Cambridge Journal of Regions, Economy and Society 8 (2): 225–240. https://doi.org/10.1093/cjres/rsv005.
- Brakman, S., and C. van Marrewijk. 2019. “Heterogeneous Country Responses to the Great Recession: The Role of Supply Chains.” Review of World Economics 155 (4): 677–705. https://doi.org/10.1007/s10290-019-00345-2.
- Cainelli, G., R. Ganau, and M. Modica. 2019a. “Industrial Relatedness and Regional Resilience in the European Union.” Papers in Regional Science 98 (2): 755–778. https://doi.org/10.1111/pirs.12377.
- Cainelli, G., R. Ganau, and M. Modica. 2019b. “Does Related Variety Affect Regional Resilience? New Evidence from Italy.” The Annals of Regional Science 62 (3): 657–680. https://doi.org/10.1007/s00168-019-00911-4.
- Carpenter, S., B. Walker, J. Anderies, and N. Abel. 2001. “From Metaphor to Measurement: Resilience of What to What?” Ecosystems 4 (8): 765–781. https://doi.org/10.1007/s10021-001-0045-9.
- Christopherson, S., J. Michie, and P. Tyler. 2010. “Regional Resilience: Theoretical and Empirical Perspectives.” Cambridge Journal of Regions, Economy and Society 3 (1): 3–10. https://doi.org/10.1093/cjres/rsq004.
- Cingolani, I., P. Panzarasa, and L. Tajoli. 2017. “Countries’ Positions in the International Global Value Networks: Centrality and Economic Performance.” Applied Network Science 2 (1): 21. https://doi.org/10.1007/s41109-017-0041-4.
- Crescenzi, R., D. Luca, and S. Milio. 2016. “The Geography of the Economic Crisis in Europe: National Macroeconomic Conditions, Regional Structural Factors and Short-Term Economic Performance.” Cambridge Journal of Regions, Economy and Society 9 (1): 13–32. https://doi.org/10.1093/cjres/rsv031.
- Crescenzi, R., C. Pietrobelli, and R. Rabellotti. 2014. “Innovation Drivers, Value Chains and the Geography of Multinational Corporations in Europe.” Journal of Economic Geography 14 (6): 1053–1086. https://doi.org/10.1093/jeg/lbt018.
- Criscuolo, C., and J. Timmis. 2017. “The Relationship Between Global Value Chains and Productivity.” International Productivity Monitor 32: 61–83.
- Davoudi, S., K. Shaw, L. Haider, A. Quinlan, G. Peterson, C. Wilkinson, H. Fünfgeld, D. McEvoy, L. Porter, and S. Davoudi. 2012. “Resilience: A Bridging Concept or a Dead End? “Reframing” Resilience: Challenges for Planning Theory and Practice Interacting Traps: Resilience Assessment of a Pasture Management System in Northern Afghanistan Urban Resilience: What Does it Mean in Planning Practice? Resilience as a Useful Concept for Climate Change Adaptation? The Politics of Resilience for Planning: A Cautionary Note: Edited by Simin Davoudi and Libby Porter.” Planning Theory & Practice 13 (2): 299–333. https://doi.org/10.1080/14649357.2012.677124
- Di Stefano, E. 2021. “COVID-19 and Global Value Chains: The Ongoing Debate.” Questioni di Economia e Finanza (Occasional Papers), N.618.
- Diodato, D., and A. Weterings. 2015. “The Resilience of Regional Labour Markets to Economic Shocks: Exploring the Role of Interactions among Firms and Workers.” Journal of Economic Geography 15 (4): 723–742. https://doi.org/10.1093/jeg/lbu030.
- Farrell, H., and A. Newman. 2020. “Will the Coronavirus End Globalization as We Know It?” [online]. Foreign Affairs. Accessed August 6, 2021. https://www.foreignaffairs.com/articles/2020-03-16/will-coronavirus-end-globalization-we-know-it
- Fingleton, B., H. Garretsen, and R. Martin. 2012. “Recessionary Shocks And Regional Employment: Evidence On The Resilience Of U.K. Regions.” Journal of Regional Science 52 (1): 109–133. https://doi.org/10.1111/j.1467-9787.2011.00755.x.
- Frenken, K., F. Van Oort, and T. Verburg. 2007. “Related Variety, Unrelated Variety and Regional Economic Growth.” Regional Studies 41 (5): 685–697. https://doi.org/10.1080/00343400601120296.
- Fröhlich, K., and R. Hassink. 2018. “Regional Resilience: A Stretched Concept?” European Planning Studies 26 (9): 1763–1778. https://doi.org/10.1080/09654313.2018.1494137.
- Gereffi, G. 2020. “What Does the COVID-19 Pandemic Teach us About Global Value Chains? The Case of Medical Supplies.” Journal of International Business Policy 3 (3): 287–301. https://doi.org/10.1057/s42214-020-00062-w.
- Giannakis, E., and A. Bruggeman. 2017. “Determinants of Regional Resilience to Economic Crisis: A European Perspective.” European Planning Studies 25 (8): 1394–1415. https://doi.org/10.1080/09654313.2017.1319464.
- Gibbon, P., and S. Ponte. 2005. Trading Down: Africa, Value Chains, and the Global Economy. Philadelphia: Temple University Press.
- Gong, H., and R. Hassink. 2017. “Regional Resilience: The Critique Revisited.” In Creating Resilient Economies, edited by Nick Williams and Tim Vorley, 206–216. Cheltenham: Edward Elgar Publishing Limited. https://doi.org/10.4337/9781785367649.00021
- Groot, S. P.T., J. L. Mohlmann, H. Garretsen, and H. L. F. de Groot. 2011. “The Crisis Sensitivity of European Countries and Regions: Stylized Facts and Spatial Heterogeneity.” Tinbergen Institute Discussion Paper No. 11-071/3. http://doi.org/10.2139/ssrn.1823265.
- Hassink, R. 2010. “Regional Resilience: A Promising Concept to Explain Differences in Regional Economic Adaptability?” Cambridge Journal of Regions, Economy and Society 3 (1): 45–58. https://doi.org/10.1093/cjres/rsp033.
- Humphrey, J., and H. Schmitz. 2002. “How Does Insertion in Global Value Chains Affect Upgrading in Industrial Clusters?” Regional Studies 36 (9): 1017–1027. https://doi.org/10.1080/0034340022000022198.
- IJtsma, P., and B. Los. 2020. “UK Regions in Global Value Chains.” Economic Statistics Centre of Excellence (ESCoE) Discussion Papers No. ESCoE DP-2020-08.
- Ivanov, D., and A. Dolgui. 2020. “Viability of Intertwined Supply Networks: Extending the Supply Chain Resilience Angles Towards Survivability. A Position Paper Motivated by COVID-19 Outbreak.” International Journal of Production Research 58 (10): 2904–2915. https://doi.org/10.1080/00207543.2020.1750727.
- Johnson, R., and G. Noguera. 2012. “Accounting for Intermediates: Production Sharing and Trade in Value Added.” Journal of International Economics 86 (2): 224–236. https://doi.org/10.1016/j.jinteco.2011.10.003.
- Kleinert, J., J. Martin, and F. Toubal. 2012. “The Few Leading the Many: Foreign Affiliates and Business Cycle Comovement.” American Economic Journal: Macroeconomics 7 (4): 134–59. https://doi.org/10.1257/mac.20130234.
- Kogler, D. 2015. “Editorial: Evolutionary Economic Geography – Theoretical and Empirical Progress.” Regional Studies 49 (5): 705–711. https://doi.org/10.1080/00343404.2015.1033178.
- Lane, P., and G. Milesi-Ferretti. 2011. “The Cross-Country Incidence of the Global Crisis.” IMF Economic Review 59 (1): 77–110. https://doi.org/10.1057/imfer.2010.12.
- Laplume, A., B. Petersen, and J. Pearce. 2016. “Global Value Chains from a 3D Printing Perspective.” Journal of International Business Studies 47 (5): 595–609. https://doi.org/10.1057/jibs.2015.47.
- Leontief, W.W. 1936. “Quantitative Input and Output Relations in the Economic Systems of the United States.” The Review of Economics and Statistics 18 (3): 105–125. https://doi.org/10.2307/1927837.
- Livesey, F. 2018. “Unpacking the Possibilities of Deglobalisation.” Cambridge Journal of Regions, Economy and Society 11 (1): 177–187. https://doi.org/10.1093/cjres/rsx030.
- MacKinnon, D., and K. Derickson. 2013. “From Resilience to Resourcefulness: A Critique of Resilience Policy and Activism.” Progress in Human Geography 37 (2): 253–270. https://doi.org/10.1177/0309132512454775.
- Martin, R. 2012. “Regional Economic Resilience, Hysteresis and Recessionary Shocks.” Journal of Economic Geography 12 (1): 1–32. https://doi.org/10.1093/jeg/lbr019.
- Martin, R., and P. Sunley. 2006. “Path Dependence and Regional Economic Evolution.” Journal of Economic Geography 6 (4): 395–437. https://doi.org/10.1093/jeg/lbl012.
- Martin, R., and P. Sunley. 2015. “On the Notion of Regional Economic Resilience: Conceptualization and Explanation.” Journal of Economic Geography 15 (1): 1–42. https://doi.org/10.1093/jeg/lbu015.
- Martin, R., and P. Sunley. 2020. “Regional Economic Resilience: Evolution and Evaluation.” In Handbook on Regional Economic Resilience, edited by Bristow Gilian and Healy Adrian, 10–35. Cheltenham: Edward Elgar Publishing.
- Martin, R., P. Sunley, B. Gardiner, and P. Tyler. 2016. “How Regions React to Recessions: Resilience and the Role of Economic Structure.” Regional Studies 50 (4): 561–585. https://doi.org/10.1080/00343404.2015.1136410.
- Martin, R., and P. Tyler. 2000. “Regional Employment Evolutions in the European Union: A Preliminary Analysis.” Regional Studies 34 (7): 601–616. https://doi.org/10.1080/00343400050178410.
- OECD. 2020. COVID-19 and global value chains: Policy options to build more resilient production networks.
- O’Leary, L. 2020. “The Modern Supply Chain Is Snapping” [online]. The Atlantic. Accessed August 6, 2021. https://www.theatlantic.com/ideas/archive/2020/03/supply-chains-and-coronavirus/608329/
- Ostry, J., P. Loungani, and D. Furceri. 2016. “Neoliberalism: Oversold? - Instead of Delivering Growth, Some Neoliberal Policies Have Increased Inequality, in Turn Jeopardizing Durable Expansion.” Finance & Development 53 (2): 38–43. https://doi.org/10.5089/9781513549118.022.
- Pahl, S., and M. Timmer. 2020. “Do Global Value Chains Enhance Economic Upgrading? A Long View.” The Journal of Development Studies 56 (9): 1683–1705. https://doi.org/10.1080/00220388.2019.1702159.
- Pendall, R., K. Foster, and M. Cowell. 2010. “Resilience and Regions: Building Understanding of the Metaphor.” Cambridge Journal of Regions, Economy and Society 3 (1): 71–84. https://doi.org/10.1093/cjres/rsp028.
- Rivera, P. 2012. “Crisis and Regional Distribution in the European Union: Considerations of Economic Policy.” Journal of Economic Issues 46 (2): 459–468. https://doi.org/10.2753/JEI0021-3624460221.
- Rizzi, P., P. Graziano, and A. Dallara. 2018. “A Capacity Approach to Territorial Resilience: The Case of European Regions.” The Annals of Regional Science 60 (2): 285–328. https://doi.org/10.1007/s00168-017-0854-1.
- Sensier, M., G. Bristow, and A. Healy. 2016. “Measuring Regional Economic Resilience Across Europe: Operationalizing a Complex Concept.” Spatial Economic Analysis 11 (2): 128–151. https://doi.org/10.1080/17421772.2016.1129435.
- Sturgeon, T., J. Van Biesebroeck, and G. Gereffi. 2008. “Value Chains, Networks and Clusters: Reframing the Global Automotive Industry.” Journal of Economic Geography 8 (3): 297–321. https://doi.org/10.1093/jeg/lbn007.
- Thissen, M., M. Lankhuizen, F. van Oort, B. Los, and D. Diodato. 2018. “EUREGIO: The Construction of a Global IO Database with Regional Detail for Europe for 2000–2010.” Tinbergen Institute Discussion Paper No. TI 2018-084/VI. Amsterdam, The Netherlands: Tinbergen Institute.
- Tóth, G., Z. Elekes, A. Whittle, C. Lee, and D. Kogler. 2022. “Technology Network Structure Conditions the Economic Resilience of Regions.” Economic Geography 98 (4): 355–378. https://doi.org/10.1080/00130095.2022.2035715.
- UNCTAD. 2020. International Production Beyond the Pandemic. 30th Anniversary Edition. Geneva: United Nations.
- van Bergeijk, P. 2012. “The World Trade Collapse and International Value Chains: A Cross-Country Perspective.” International Economic Journal 27 (1): 41–53. https://doi.org/10.1080/10168737.2012.658833
- van Bergeijk, P., S. Brakman, and C. van Marrewijk. 2017. “Heterogeneous Economic Resilience and the Great Recession’s World Trade Collapse: Heterogeneous Resilience.” Papers in Regional Science 96 (1): 3–12. https://doi.org/10.1111/pirs.12279.
- van den Berg, M., and M. Jaarsma. 2017. “What Drives Heterogeneity in the Resilience of Trade: Firm-Specific Versus Regional Characteristics: What Drives Heterogeneity in the Resilience of Trade.” Papers in Regional Science 96 (1): 13–32. https://doi.org/10.1111/pirs.12233.
- Wagner, J., and J. Gelübcke. 2014. “Risk or Resilience? The Role of Trade Integration and Foreign Ownership for the Survival of German Enterprises During the Crisis 2008–2010.” Jahrbücher für Nationalökonomie und Statistik 234 (6): 757–774. https://doi.org/10.1515/jbnst-2014-0606
- Webber, D., A. Healy, and G. Bristow. 2018. “Regional Growth Paths and Resilience: A European Analysis.” Economic Geography 94 (4): 355–375. https://doi.org/10.1080/00130095.2017.1419057.
- World Bank. 2020. “World Development Report 2020: Trading for Development in the Age of Global Value Chains”.
- World Trade Organization. 2009. Trade Policy Commitments and Contingency Measures. Geneva: WTO Publ.
- Zhu, Z., G. Morrison, M. Puliga, A. Chessa, and M. Riccaboni. 2018. “The Similarity of Global Value Chains: A Network-Based Measure.” Network Science 6 (4): 607–632. https://doi.org/10.1017/nws.2018.8.