
 ?Mathematical formulae have been encoded as MathML and are displayed in this HTML version using MathJax in order to improve their display. Uncheck the box to turn MathJax off. This feature requires Javascript. Click on a formula to zoom.
ABSTRACT
The study explores how the territorial structure of manufacturing sectors with differing technological intensities is influencing the spatial pattern of digitalisation in the early stages of the fourth industrial revolution. Using data from 2014 to 2019 for sectors classified according to technology intensity and indicators measuring digitalisation trends, we have conducted a correlation and cluster analysis of Hungarian districts (formerly LAU1 level). We found that the geography of manufacturing sectors determines the spatial patterns of digitalisation, and the digitalisation is more advanced in districts that concentrate sectors with high and medium-high technological intensity.
Introduction
Throughout history, industrial revolutions have always resulted in radical economic and social transformation, taking different shape in space and time. The new technical achievements and important innovations of the given era always played a decisive role in each industrial revolution. The first one was generated by steam engines, the second by electricity, and the third by the advancement of computers and ICT (Ciffolilli and Muscio Citation2018; Mokyr Citation1985). The main driving forces of the fourth industrial revolution, which we are still at the beginning of, are the new technologies collectively referred to as Industry 4.0 (Reischauer Citation2017). This concept first appeared in Germany in 2011 and has since become widespread (Bartodziej Citation2017). The terms Industry 4.0 (I4.0) and the fourth industrial revolution (4IR) are often used interchangeably, though it has not yet been decided whether the two terms mean the same or not (Thoben, Alexander, and Thorsten Citation2017). In a broader sense, the 4IR signifies revolutionary changes not only in industry (as does I4.0), but also in the economy and society as a whole (Schwab Citation2016).
Some experts consider Industry 4.0 to be the second phase and a continuation of the third industrial revolution, because its technologies are essentially based on the achievements and further development of this third industrial revolution (computers, Internet) (Alcácer, Cantwell, and Piscitello Citation2016). It can therefore be considered as an evolutionary rather than a revolutionary change (Geissbauer, Vedso, and Schrauf Citation2016). Others define I4.0 as digital transformation, or the next phase in the digitalisation of the manufacturing industry (I-SCOOP Citation2017). It is also recognised as a trend towards a digital revolution in manufacturing (Santos et al. Citation2017). Despite the different definitions, the key elements of the Industry 4.0 concept are digitalisation and digital transformation, made possible by ICT devices (e.g. routers, broadband, cable wires) and digital technologies (e.g. Big data, Artificial Intelligence, Internet of Things, Cloud system) (Howaldt, Kopp, and Schultze Citation2017; Rueda-Sabater and Garrity Citation2010). In this study, we focus chiefly on digitalisation (by which is meant the extension of the digital infrastructures necessary for its expansion), and evaluate its territorial progress in the period before the COVID-19 pandemic (2014–2019). Since the concept of digitalisation appeared in 1971, it has undergone significant development and numerous definitions of it have become widespread (Gorenšek and Kohont Citation2019). In recent times, it is understood as the large-scale application of digital technologies, transforming the economy and society as a whole (Hellsten and Paunu Citation2020).
Digitalisation is usually more advanced in the more developed countries. According to the Digital Economy and Society Index used by the EU to measure digitalisation processes, Hungary’s position among the 28 countries hardly changed between 2014 and 2019, as it only moved from 22nd place to 21st, though this does indicate a constant falling behind. This was also confirmed by the values of other indicators, such as the Global Entrepreneurship Index and the European Index of Digital Entrepreneurship Systems (Éltető Citation2021; Szerb, Komlósi, and Páger Citation2020).
There may also be significant differences in the degree of digitalisation, not only between countries but also internally (Bailey and De Propis Citation2019; Balland and Boschma Citation2021; Muscio and Ciffolilli Citation2020). As a rule, digitalisation and new technologies is more prevalent in more developed and central areas such as in larger cities, rather than in backward, peripheral or rural areas (Nuccio et al. Citation2020; Šlander and Wostner Citation2019). The most frequently mentioned reasons for this include scarce financial resources, differing levels of social preparedness, lack of the necessary knowledge and competencies, and underdeveloped ICT infrastructure (Adebanjo et al. Citation2021; Bravi and Murmura Citation2021; Hamzeh, Zhong, and Xu Citation2018). In addition to these, the degree of digitalisation may even be influenced by the characteristics of companies operating in a given region (e.g. size, ownership, sectoral affiliation) (Fettermann et al. Citation2018; Kiss and Nedelka Citation2020). Building on this assumption, in this study the role of the sectoral affiliation of company characteristics is examined in relation to the spread of digitalisation and therefore indirectly to the advance of Industry 4.0 technologies. Using various databases and methods, we evaluate in terms of evolutionary economic geography, how the sectoral structure of the manufacturing industry of Hungarian districts affected the progress of digitalisation between 2014 and 2019. Based on the model of path dependence, which is a key element of the evolutionary approach, we also analyse the relationship between the progress of digitalisation and the presence of new manufacturing enterprises in various sectors: whether the appearance of new firms follows the digitalisation trends of the given sectoral structure, or whether other factors prevail rather than a kind of path dependency. Although a number of studies have been published on the factors influencing the spatial diffusion of digitalisation (e.g. Ghobakloo Citation2020; OECD Citation2019), the sectoral affiliation of firms has received little attention so far. Addressing this research gap is the novelty of this study, which also contributes to the theoretical debate (which always flares up when new technologies appear), as to whether digitalisation, as a new opportunity, as a ‘breaking point’, really brings about a marked change in the structure of an area's industry or whether ‘path dependence’ prevails in the evolution of the industrial landscape.
This study is structured into six main parts. Based on the literature, the factors determining the sectoral structure of manufacturing industry are briefly reviewed in Section 2, paying particular attention to new technologies. The data and methodology are described in Section 3. Section 4 presents the results of the correlation and cluster analysis, which are discussed in Section 5. Finally, conclusions follow.
Manufacturing sectors and their influencing factors
Manufacturing is the largest segment of industry and it includes several sectors. The spatial pattern of each sector is essentially the result of a long development process, which was shaped to varying degrees by the specific socio-economic conditions of different ages (Nuccio et al. Citation2020). Many factors play a role (e.g. natural, social, economic) as to which industrial sectors are established and where. In the beginning, it was enough to consider just a few factors when establishing a company (e.g. raw materials, transport costs, capital, labour, etc.) (Johnson Citation1981; Stevens and Brackett Citation1967). Later on, concurrently with the acceleration of globalisation, selecting a location became more complicated because many more factors had to be taken into account (Dunning Citation1998; Porter Citation1994). At the same time, the criteria for site selection have also changed over time: certain factors have come to the fore, others have been relegated to the background (Leamer and Storper Citation2001; Midelfart-Kvarnik et al. Citation2000). And then the site requirements of companies may also change, leading to the closure or relocation of a given plant (Dicken Citation2003).
The technical inventions of industrial revolutions are also important factors in shaping the geography of manufacturing sectors. As the drivers of economic development, they have a great impact on the spatial operation of the economy (Cameron Citation1994; Götz and Jankowska Citation2017). In recent decades, but especially during the 4IR, ICTs are gaining importance in the economy and companies, because their fusion with industrial technologies is rapidly approaching. I4.0 technologies enable the connection of the real with virtual world in cyber-physical systems and effective communication by creators (man-machine resources), which will radically transform industrial production and eventually the whole of life (Bartodziej Citation2017; Schwab Citation2016).
With the spread of the Internet-based economy, new or additional criteria are beginning to prevail in the search for sites by companies (Häider Citation2020). In the establishment of multinational companies, new OLI advantages will become increasingly important (open resource advantage, linkage advantage, integration advantage) in addition to the classic advantages (ownership, location, internationalisation) (Dunning Citation1998; Luo Citation2021). A new approach is also needed in that ‘spatial analysis’ predominates over ‘location analysis’ (Cano-Kollmann et al. Citation2016). This latter only entails the analysis of the geographical space, whilst the former focuses on the complex investigation of it (technological, social, cognitive, institutional). This therefore enables a much more informed decision to be made when choosing the site. The spread of I4.0 and the rise of digitalisation also place new expectations on workers, since the shift towards new production methods depends to a large extent on the competencies of the workforce (Nuccio et al. Citation2020). Human qualities such as creativity, social and emotional intelligence and cognitive ability, decision-making skills, technical and ICT expertise will receive greater attention (Fonseca Citation2018; Manyika et al. Citation2017).
In the era of digital globalisation, factors such as the distance will become a ‘weightless’ consideration for many businesses (Malecki Citation2017). The operation of companies is not significantly affected by where or how far away they are from each other. Geographical proximity is not necessary and agglomeration advantages lose their importance. Businesses that use digital technologies intensively can, in principle, be established anywhere (Brydges and Hracs Citation2019). In reality, however, other factors also play a role in where new businesses are founded. One of the most important of these is the provision of an advanced ICT infrastructure. With its territorial characteristics, diffusion, social, economic and geographical effects have long been considered (Billon, Ezcurra, and Lera-Lopez Citation2008; Duvivier et al. Citation2021; Forman, Goldfarb, and Greenstein Citation2005). In the first decade of the twenty-first century, there were sharp differences in the prevalence of ICT between countries or even internally (Billon, Marco, and Lera-Lopez Citation2009; Grasland and Puel Citation2007; Houzet Citation2007). These have diminished by today, but the digital divide can still be observed, if to a lesser extent (EC Citation2020; OECD Citation2019).
In the age of the 4IR, basic ICT devices are relevant ‘prerequisites’ for the spatial diffusion of I4.0 technologies, which provide many new opportunities. They not only accelerate the process of digitalisation, but also have the potential to transform the sectoral and territorial structure of manufacturing industry (Corradini, Santini, and Vecciolini Citation2021; Gress and Kalafsky Citation2015). In general, the industries appearing in a region are technologically related to preceding industries (Neffke, Henning, and Boschma Citation2011). It may also be assumed that certain sectors are ‘open’ and require I4.0 technologies, while other sectors are not or less so. And this may also affect the development dynamics and knowledge production of the given area (Balland and Boschma Citation2021; Corò et al. Citation2021).
The spatial spread of new technologies also depends on their nature, because not all I4.0 technologies have the same transformative capability (Teece Citation2018). The extent of their impact is also influenced by the characteristics, the ‘initial state’ of the regions (Bailey and De Propis Citation2019). This is also why there were significant differences in the geographical distribution of I4.0 between 2000 and 2014 in the regions of Europe (Corradini, Santini, and Vecciolini Citation2021). This research has also pointed out that the local industrial structure is an important factor among local features, as it may affect the adoption of I4.0 and the progress of digitalisation. Hence, we have formulated the following hypotheses:
H1: The level of digitalisation is more advanced in the districts where the concentration of higher-tech companies is greater.
H2: Digitalisation is generally higher in the more developed districts and where the proportion of knowledge-intensive workforce is higher.
In the following, we examine these hypotheses using the example of the spatial patterns of new and operating sectoral manufacturing structure and digitalisation in the Hungarian districts between 2014 and 2019.
Data and methods
Data description
Adopting the 2-digit classification of NACE Rev. 2, the 24 sectors of the manufacturing industry were classified into three groups according to their level of technological intensity and using the categorisation criteria of EUROSTAT1. Furthermore, modifying the original classification, the high-technology and medium-high-technology sectors were combined into one group as we assume that these sectors together cover those which use the most I4.0 technologies ().
Table 1. Classification of manufacturing sectors by technology intensity.
Using the data from new and operating companies, we compiled a database for the period between 2014 and 2019 for 24 manufacturing activities in 174 Hungarian districts (formerly LAU1 level) and Budapest. For lack of district-level sectoral employment data, we calculated concentration indicators (location quotient – LQ) based on new and incumbent companies in order to obtain an overview of the high – and low-level concentration of certain manufacturing sectors in the districts, compared with the national average (Szakálné Kanó et al. Citation2019). The data were provided by the Central Statistical Office. Since only a few long-term data series were available at the district-level, this largely determined the range of variables that could be examined ().
Table 2. The explanatory variables included.
Based on the classification of workers by major occupational groups, which is in line with the ISCO-08 classification, we created two main categories of workers: ‘knowledge-intensive’ workforce and the ‘labour-intensive’ or otherwise ‘assembling’ workforce ().
Table 3. Classification of manufacturing occupations.
We consider the period between 2014 and 2019 to be the early stage of the 4IR. The starting date is justified by the fact that the effects of the 2008 crisis had barely taken effect by then, and according to the results of searches in the two major literature databases (WoS, Scopus), the concept of I4.0 had also begun to appear in Hungary at that time. The end of the study period was determined by the COVID-19 pandemic that broke out in early 2020. We believe that the effects of this pandemic should be analysed separately due to its extreme impact on digitalisation, and what is more datasets for the period following 2019 were not available.
Methodology
The compiled dataset was processed using various methods with Stata 17 software. First, we performed a correlation analysis to reveal which group of manufacturing sectors aligns most closely with the digitalisation trends. Then, by conducting cluster analysis on the dataset, we tried to identify different groups of Hungarian districts that point to similar or different patterns of sectoral concentration and digitalisation.
Using the squared Euclidean distance between the elements, agglomerative hierarchical cluster analysis was performed. This type of approach underlines greater distances even more than others, while giving less weight to the smaller distances. In order to combine the individual elements (later groups) of differing clustering techniques, Ward’s method was used, which is a featured algorithm within the variance method (Saraçli, Doğan, and Doğan Citation2013).
To determine the optimal number of groups for our investigation, we used different specific indicators (known as cluster stops) the results of which suggest how close or how far the groups created by cluster analysis are from each other (Halpin Citation2016). First, we analysed the results of Caliński and Harabasz's Variance Ratio Criterion (CH), which indicates the ratio of sums of squares of between-group and within-group variances with different group numbers (Charrad et al. Citation2012). Equation 1:
(1)
(1) where:
within-group dispersion matrix for data grouped into ‘q’ clusters
between-group dispersion matrix for data grouped into ‘q’ clusters
xi = p-dimensional vector of observations of the ith object in cluster ‘k’
ck = centroid of cluster ‘k1’
c = centroid of data matrix
nk = number of objects in cluster Ck.
The higher the value of the indicator, the more possible it is to talk about groups with a relatively low-level of within-group variance (more homogenous) which are relatively far from each other (high level of between-group variance). Using this indicator, we examined the solutions that created at least two groups and at most fifteen (Appendix 1).
We also used another cluster-stop indicator, Duda and Hart’s (DH) index (Charrad et al. Citation2012). This measure compares the sum of squares of two separate clusters to the value of the sum of squares, which is obtained when these two clusters are merged. Here it is also valid to say that the higher the value of the indicator, the more possible it is to talk about different groups. Equation 2:
(2)
(2) where:
Je(2) is the sum of squared errors within clusters when the data are partitioned into two clusters (‘k’ and ‘l’) and
Je(1) gives the squared errors when only one cluster ‘m’ is present (assuming that cluster ‘k’ and ‘l’ are merged into cluster ‘m’).
Wk, Wl and Wm are defined as Wq in the CH index.
The modified version of the latter index, known as the pseudo-T2 statistic (Charrad et al. Citation2012), in contrast to Duda and Hart’s index, also considers the number of sample elements. In the case of this indicator, the lower values refer to groups that are more different from each other (Everitt et al. Citation2011; Halpin Citation2016). Equation 3:
(3)
(3) where:
Bkl is defined as the same as Bq in the CH index, while Wk and Wl are defined the same as in the DH index.
nk and nl are the number of objects in cluster Ck and cluster Cl.
Even though ours is a panel dataset having data from a number of years, we decided to conduct the cluster analysis on three different years: the first (2014), middle (2016) and last year (2019). This made possible to reveal the relationship between digitalisation and manufacturing activities in the districts over time and the new digitalisation trends before the pandemic.
Results
Spatial patterns of digitalisation and sectoral concentration
In the first phase of the correlation analysis, the 2014–2019 annual data were examined together, and the results were compared with those obtained during annual investigations. We found that the degree of digitalisation has a strong positive correlation with the amount of income per taxpayer and the proportion of the knowledge-intensive workforce. The quality of the digital infrastructure has a weak relationship with the proportion of Internet connections via the xDSL network. This type of connection is common, where the number of Internet subscribers is relatively low ().
Table 4. Correlation values between the variables studied, 2014–2019.
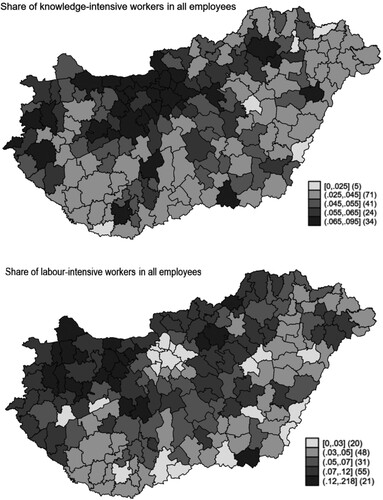
During the period under investigation, the proportion of the knowledge- and the labour-intensive workforce increased significantly, while the spatial distribution of these shows a stronger concentration. The knowledge-intensive workforce became more significant, mainly in the capital city region and Central Transdanubia, while the occurrence of a labour-intensive workforce is most closely related to Northern Transdanubia and Northern Hungary ( and ).
Figure 1. The spatial distribution of knowledge- and labour-intensive workers by district in Hungary, 2014.
Note: Numbers in the brackets show the members of each category. Source: Authors' edit.
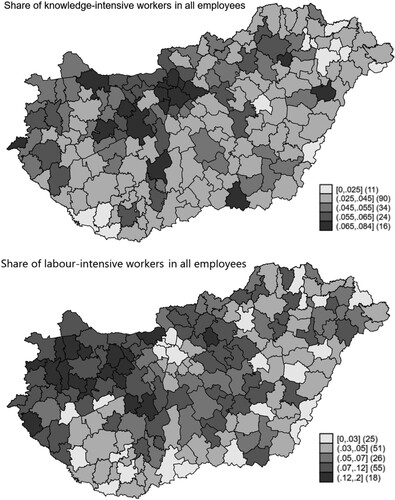
Figure 2. The spatial distribution of knowledge- and labour-intensive workers by district in Hungary, 2019.
Note: Numbers in the brackets show the members of each category. Source: Authors' edit.
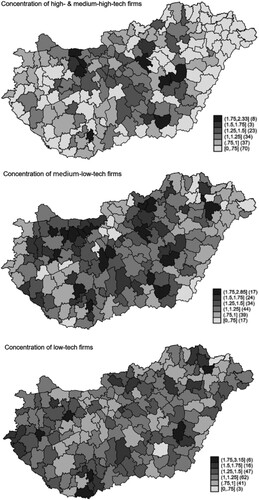
The concentration of companies indicates that, although the number of Internet subscribers is of medium strength, it is still significantly related to high and medium-high-technology sectors. At the same time, there is a significant negative relationship with low-tech sectors, which occurs mainly in Western Transdanubia. The geography of sectors with differing technology intensities did not change significantly between 2014 and 2019 ( and ).
Figure 3. The concentration of manufacturing companies with a different level of technology intensity by district in Hungary, 2014.
Note: Numbers in the brackets show the members of each category. Source: Authors' edit.
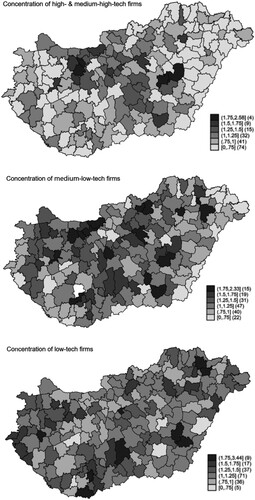
Figure 4. The concentration of manufacturing companies with a different level of technology intensity by district in Hungary, 2019.
Note: Numbers in the brackets show the members of each category. Source: Authors' edit.
The entry of new companies into certain sectors has been greatly influenced by the sectoral concentration of incumbent companies. Namely, the concentration of high and medium-high-technology sectors has had a positive correlation with the number of new companies in the high and medium-high-technology sectors. A similar pattern appears in the case of medium-low and low-tech companies. In other words, new companies appear in the given area in accordance with the technological level of the existing sectors.
In the second phase of the correlation analysis applied for each year separately, the indicators show almost the same pattern. Hence, there is a significant relationship between the technological level of the sectors and digitalisation in the case of operating companies, while the sectoral concentration of entering companies is primarily determined by that of incumbent firms in the region.
Groups of Hungarian districts by sectoral structure and digitalisation
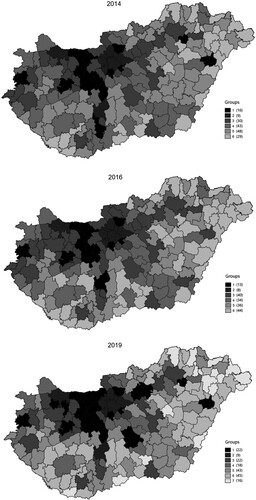
We formed six groups of districts by the values of 2014 and 2016, and seven clusters by the values of 2019. The groups were ordered according to the concentration of operating firms in high- and medium-high-technology sectors. The group with the highest concentration value was assigned the number 1, while the group with the lowest value was given the number 6, or number 7 in the case of 2019 (, and ).
Table 5. Average values of the groups by the 2014 values of the variables.
Table 6. Average values of the groups by the 2016 values of the variables.
Table 7. Average values of the groups by the 2019 values of the variables.
‘Group 1’ includes those districts in the economy of which the manufacturing sectors with a high- and medium-high-tech level play a relevant role. The proportion of the ‘labour-intensive’ workforce is also substantial due to the considerable foreign capital investments (Kiss Citation2007; Kuttor Citation2022). These areas, which are typically far from the largest cities, do not have the highest level of digitalisation and per capita income, although their values are significantly above the national average ().
Figure 5. Groups of Hungarian districts by cluster analysis, 2014–2019.
Note: Numbers in the brackets show the members of each category. Source: Authors' edit.
The values of digitalisation and socio-economic indicators (per capita income, knowledge-intensive workforce) are the highest in ‘Group 2’, but the importance of manufacturing industry is more modest. These districts, which can be at the forefront in the application of I4.0 technologies and related knowledge production are highly urbanised and may be classified as the most developed areas in the country.
In the districts belonging to ‘Group 3’, the share of the ‘assembling’ workforce is high, which may be a reason/consequence of the fact that companies at a lower technological level dominate the sectoral structure. Accordingly, the average income level and the degree of digitalisation are much lower than in the districts of the first two groups but they still exceed the national average. Medium-low and low-tech companies are in the majority among new companies as well, further strengthening the role of the manufacturing industry in the economy of these districts.
The values of most of the indicators for ‘Group 4’ are relatively close to the national average. The ratio of operating high-tech companies exceeds this average, while that of new high-tech companies falls short of it. The number of districts in this group decreased from 43 to 18, which indicates a strong spatial ‘narrowing’. These are located relatively far from county seats.
The sectoral structure of the districts in Groups 5, 6 and 7 is dominated by low-tech categories. The concentration of these mostly exceeds the national average. What is particularly unfavourable is that the proportion of low-tech firms among new manufacturing companies is also above average. These areas are usually located far from larger cities, where income conditions and digital infrastructure are characterised by unfavourable values, which can also hinder the adoption of I4.0.
The general trend is that the values of most indicators have become more favourable: there was a smaller improvement between 2014 and 2016, but by 2019 a greater improvement had occurred. The relationship between the concentration of high-tech and medium-high-tech companies and the spread of digitalisation was also essentially positive in the given period. Among new companies, however the concentration of the low-tech sectors increased, which suggests unfavourable processes in the Hungarian manufacturing industry.
Between 2014 and 2019, the districts in Groups 1–4 located primarily in the north-western and western parts of the country and in the region of the capital city became more spatially concentrated. These districts are the most developed regions in terms of economic and societal features. Digitalisation is significantly more advanced, and the spread of I4.0 technologies is probably the fastest here. The number of districts in Groups 5–7 increased from 77 to 104. Thus, in 2019, they already accounted for a larger share of the country's territory, where the values of different indicators are less favourable.
Discussion
In this study, we examined the correlations between the sectoral structure of the Hungarian manufacturing industry (by existing and newly established companies) and the spatial pattern of digitalisation. According to the literature review, the manufacturing sectors of an area are influenced by many factors. However, up till the end of the period reviewed, attention was only paid to exploring the impact of ICT and digitalisation on sectoral structures (Isaksen et al. Citation2020; Neffke, Henning, and Boschma Citation2011; Nuccio et al. Citation2020). This is why approaching the causal relationship from the other direction (Tranos Citation2012) is novel, namely, how the sectoral structure affects digitalisation, thereby contributing to reducing the research gap. Evaluating the matter from this angle is also necessary, because the economic development strategy of each region can be greatly influenced by how the technological adaptation and transformation of a given region are determined by the territorial concentration of certain manufacturing sectors. This defines a specific (industrial) development path for the manufacturing industry of the given area, and in a wider sense, for the further development of the whole territory.
Using various indicators and methods, we explored the idea that the existing structure of the manufacturing sectors plays a decisive role in the spread of digitalisation at the district-level. In the case of operating companies, the correlation between the values of the various indicators is closer than in the case of new companies. The digitalisation pattern of new and existing sectors with differing technological intensities shows a significant difference, suggesting that digitalisation has a marginal role in the spatial concentration of new industrial sectors. Approached from the perspective of evolutionary economic geography, this means that the existing sectoral structure actually determines the spatial appearance of new companies and thus the diffusion of digitalisation. This is consistent with the research results of Neffke, Henning, and Boschma (Citation2011), that industries that are technologically related to existing industries in a region are more likely to appear in that region than those that are not. The sectoral structure of industry in an area is therefore conserved to a certain degree by this process. It can thus be concluded that no marked change can be expected in the sectoral composition and technological intensity of the manufacturing sectors in a given area.
Where the concentration of low-technology-intensive sectors is higher, usually in peripheral, mostly rural areas, it is more likely that additional low-technology-intensive sectors will appear, and digitalisation will progress more slowly. This process, which indirectly supports the H1 hypothesis, is closely related to the less favourable social, economic, cultural, political, etc. characteristics of the areas (Bagchi Citation2005; Billon, Marco, and Lera-Lopez Citation2009; Chinn and Fairlie Citation2007). And this finding confirms the hypothesis H2. The role of human capital in these regions was deemed particularly important, not only in the emergence of the existing companies, but also in the appearance of new ones (Hasbi Citation2020). Socio-demographic features, especially age, have a great influence on Internet use (Büchi, Just, and Latzer Citation2016), which also affects the spread and application of I4.0 technologies. Although assumptions were also made in connection with I4.0 technologies, that they promote the spatial expansion of industrial production and the reduction of regional inequalities, this has not been confirmed by research (Ciffolilli and Muscio Citation2018; Coró et al. Citation2021; Greef and Schroeder Citation2021). Nor does the progress in digitalisation significantly contribute to the ‘industrialisation’ of less developed, often peripheral regions, to the emergence of new industrial activity, and thus to the development of the local economy and to the ‘breaking away’ from the previous development path.
Between 2014 and 2019 in Hungary, the number of districts increased to the greatest extent in Groups 5, 6 and 7. Although the values of the indicators improved, the extent to which they lagged behind was essentially reproduced at a higher level. These districts are primarily attractive to low-tech sectors, and thus the proportion of the labour-intensive workforce also increased. This suggests that new trends have begun to prevail in the Hungarian manufacturing industry, which may adversely affect the industry's further development, competitiveness, and technical and technological readiness. This is probably the result of industrial investments, mainly with foreign interests, which aimed at employing the less qualified workforce. This may be related to the latest political and economic policy strategy of the government, which has led to an increase in industrial investments from Asian countries (e.g. China, South Korea) (Kuttor Citation2022).
The spatial pattern of the first four groups is closely related to the spatial structure of Hungarian manufacturing industry, where there are many enterprises with foreign interests and where digitalisation and the application of Industry 4.0 technologies are more advanced (Corradini, Santini, and Vecciolini Citation2021; Kiss and Nedelka Citation2020). This can primarily be attributed to the fact that the use of new technologies in industrial production is the fastest (Fonseca Citation2018). Several of these companies belong to the electronics, automotive and chemical industries which are at the forefront of digital maturity. This is in line with the EU-28 sector ranking (EC Citation2020). However, the level of digitalisation in the food industry, light industry and metal industry fell far behind (Losonci, Takács, and Demeter Citation2019). The ‘digital divide’ is not only observed between sectors with different technological intensities, but it is also manifested in space (Haefner and Sternberg Citation2020).
In the rest (mainly southern part) of the country, the importance of manufacturing industry is much smaller. In addition, businesses with lower technological intensity occur more often there, and the degree of digitalisation is also lower. Since the proportion of low-tech companies among new firms has increased, and because their digitalisation is also at a low-level, it can be assumed that these regions will retain their unfavourable position in the long-term. In terms of digitalisation, the disadvantage of these will increase and become permanent. This is a ‘vicious circle’ because, the degree of digitalisation is low due to the existing sectoral structure, but the low-level of digitalisation also prevents the emergence of sectors with a higher technological level. This is essentially a ‘catch-22’ situation. Getting out of this trap is very difficult, almost impossible, without extra external intervention (domestic and foreign financial resources, political measures etc.) (Bailey and De Propis Citation2019).
Reducing the (digital) gap and enabling these areas of catch up in terms of digitalisation is made more difficult by the fact that other factors influencing the application of new technologies are also unfavourable (e.g. the low-level of education and training of the local population, ageing) (Kocsis et al. Citation2021). A significant proportion of these have been in less developed, backward, peripheral areas of the country for a long time. Among them there are settlements (‘gypsy’ or ‘retired’ villages) that can even be considered ‘digital deserts or semi-deserts’, because of the lack or low-level of digital infrastructure. ‘Path dependency’ strongly determines their future fate and can lead to serious fallback in the evolution of these areas in the era of Industry 4.0.
Conclusion
Overall, one of the most important findings of the study dealing with the early stages of the 4IR, is that there is a close correlation between the sectoral structure of the Hungarian manufacturing industry with differing technological intensities and the degree of digitalisation (especially the structure of the sectors representing the two extremes, the highest and lowest technological intensities). The other main conclusion is that the correlations between the sectoral structure and the spatial patterns of digitalisation draw attention to the increase in regional inequalities. By 2020, not only had the number of districts increased, but also the degree of their backwardness in digitalisation. The ‘digital divide’ among the districts has therefore become more intense. This indicates unfavourable processes within the Hungarian manufacturing industry, which may lead to the creation of new development paths in the initial phase of the 4IR.
The results of the research contribute to obtaining more accurate information on the digitalisation process taking place in the Hungarian manufacturing industry, and how this is influenced by the sectoral structure of manufacturing industry. Based on the literature, this novel approach is also important from a practical point of view. It provides deeper knowledge for economic policy specialists and decision-makers on the districts where the sectoral structure and digitalisation are in a closer or looser relationship, thus promoting the elaboration of regional (economic) development strategies.
The major findings would probably be further refined, and in some cases radically modified, by the expansion of the social and economic indicators examined. This is hindered, however, by the lack of long-term series data on the variables at the sub-district-level. On the other hand, the evaluation of the effects of the global pandemic that broke out in 2020 would also provide further details on the spatial dynamics of digitalisation and I4.0 in the Hungarian manufacturing industry. Studying digitalisation in each manufacturing sector with differing technology intensities could be another direction for continuation of the research. All of these, despite the limitations, may contribute to revealing deeper connections in the influence of the manufacturing sectors on the spatial patterns of digitalisation in Hungary in the early stages of the fourth industrial revolution.
Supplemental Material
Download MS Word (67.4 KB)Disclosure statement
No potential conflict of interest was reported by the authors.
Additional information
Funding
References
- Adebanjo, D., T. Laosirihongthonh, P. Samaranayake, and P. Teh. 2021. “Key Enablers of Industry 4.0 Development at Firm Level: Findings from an Emerging Economy.” IEEE Transactions on Engineering Management 70 (2): 400–416. doi:10.1109/TEM.2020.3046764.
- Alcácer, J., J. Cantwell, and L. Piscitello. 2016. “Internationalization in the Information age: A new era for Places, Firms, and International Business Networks?” Journal of International Business Studies 47 (5): 499–512. doi:10.1057/jibs.2016.22.
- Bagchi, K. 2005. “Factors Contributing to Global Digital Divide: Some Empirical Results.” Journal of Global Information Technology Management 8: 47–65. doi:10.1080/1097198X.2005.10856402.
- Bailey, D., and L. De Propis. 2019. “Industry 4.0, Regional Disparities and Transformative Industrial Policy.” Regional Studies Policy Impact Books 1 (2): 67–78. doi:10.1080/2578711X.2019.1621102.
- Bakucs, Zoltán, Imre Fertő, Ágnes Varga, and Zsófia Benedek. 2018. “Impact of European Union Development Subsidies on Hungarian Regions.” European Planning Studies 26 (6): 1121–1136. doi:10.1080/09654313.2018.1437394.
- Balland, P., and R. Boschma. 2021. “Mapping the Potentials of Regions in Europe to Contribute to new Knowledge Production in Industry 4.0 Technologies.” Regional Studies 55: 1652–1666. doi:10.1080/00343404.2021.1900557.
- Bartodziej, C. 2017. The Concept Industry 4.0. An Empirical Analysis of Technologies and Applications in Production Logistics. Berlin: Springer Gabler.
- Billon, M., R. Ezcurra, and F. Lera-Lopez. 2008. “The Spatial Distribution of the Internet in the European Union: Does Geographical Proximity Matter?” European Planning Studies 16 (1): 119–142. doi:10.1080/09654310701748009.
- Billon, M., R. Marco, and F. Lera-Lopez. 2009. “Disparities in ICT Adoption: A Multidimensional Approach to Study the Cross-Country Digital Divide.” Telecommunications Policy 33: 596–610. doi:10.1016/j.telpol.2009.08.006.
- Bravi, L., and F. Murmura. 2021. “Industry 4.0 Enabling Technologies as a Tool for the Development of a Competitive Strategy in Italian Manufacturing Companies.” Journal of Engineering and Technology Management 60: 101629. doi:10.1016/j.jengtecman.2021.101629.
- Brydges, T., and B. Hracs. 2019. “The Locational Choices and Interregional Mobilities of Creative Entrepreneurs Within Canada’s Fashion System.” Regional Studies 53: 517–527. doi:10.1080/00343404.2018.1478410.
- Büchi, M., N. Just, and M. Latzer. 2016. “Modeling the Second-Level Digital Divide: A Five-Country Study of Social Differences in Internet use.” New Media & Society 18: 2703–2722. doi:10.1177/1461444815604154.
- Cameron, R. 1994. A Világgazdaság Rövid Története. Budapest.: Maecenas Könyvkiadó.
- Cano-Kollmann, M., J. Cantwell, T. Hannigan, and R. Mudambi. 2016. “Knowledge Connectivity: An Agenda for Innovation Research in International Business.” Journal of International Business Studies 47 (3): 255–262. doi:10.1057/jibs.2016.8.
- Charrad, M., N. Ghazzali, V. Boiteau, and A. Niknafs. 2012. Package ‘NbClust’. Accessed 21 October, 2022. https://hal.science/hal-01126138/document.
- Chinn, M., and R. Fairlie. 2007. “The Determinants of the Global Digital Divide: A Cross-Country Analysis of Computer and Internet Penetration.” Oxford Economic Papers 59: 16–44. doi:10.1093/oep/gpl024.
- Ciffolilli, A., and A. Muscio. 2018. “Industry 4.0: National and Regional Comparative Advantages in key Enabling Technologies.” European Planning Studies 26 (12): 2323–2343. doi:10.1080/09654313.2018.1529145.
- Corò, G., M. Plechero, F. Rullani, and M. Volpe. 2021. “Industry 4.0 Technological Trajectories and Traditional Manufacturing Regions: The Role of Knowledge Workers.” Regional Studies 55 (10-11): 1681–1695. doi:10.1080/00343404.2021.1934433.
- Corradini, C., E. Santini, and C. Vecciolini. 2021. “The Geography of Industry 4.0 Technologies Across European Regions.” Regional Studies 55 (10-11): 1667–1680. doi:10.1080/00343404.2021.1884216.
- Dicken, P. 2003. Global Shift. Reshaping the Global Economic map in the 21st Century. London.: SAGE Publications Ltd.
- Dunning, J. 1998. “Location and the Multinational Enterprise: A Neglected Factor?” Journal of International Business Studies 29 (1): 45–66. doi:10.1057/palgrave.jibs.8490024.
- Duvivier, C., E. Cazou, S. Truchet-Aznar, C. Brunelle, and J. Dubé. 2021. “When, Where, and for What Industries Does Broadband Foster Establishment Births?” Papers in Regional Science, 1–25. doi:10.1111/pirs.12626.
- EC. 2020. A Digitális Gazdaság és Társadalom Fejlettségét Mérő Mutató, Magyarország. Brussels: European Commission. Accessed 5 September, 2021. https://digital-strategy.ec.europa.eu/en/policies/desi-hungary.
- Everitt, B., S. Landau, M. Leese, and D. Stahl. 2011. Cluster Analysis. 5th ed. Chichester: John Wiley & Sons. doi:10.1002/9780470977811.
- Éltető, A. 2021. “Digitalizáció és lokális előnyök Magyarországon.” Külgazdaság 65: 91–105. doi:10.47630/KULG.2021.65.5-6.91.
- Fettermann, D., C. Sá Cavalcante, T. de Almeida, and G. Tortorella. 2018. “How Does Industry 4.0 Contribute to Operations Management?” Journal of Industrial and Production Engineering 35 (4): 255–268. doi:10.1080/21681015.2018.1462863.
- Fonseca, L. 2018. “Industry 4.0 and the Digital Society: Concepts, Dimensions and Envisioned Benefits.” Proceedings of the International Conference on Business Excellence 12 (1): 386–397. doi:10.2478/picbe-2018-0034.
- Forman, C., A. Goldfarb, and S. Greenstein. 2005. “How Do Industry Features Influence the Role of Location on Internet Adoption?” Journal of the Association for Information Systems 6 (12): 383–408. doi:10.17705/1jais.00072.
- Geissbauer, R., J. Vedso, and S. Schrauf. 2016. “Industry 4.0: Building the Digital Enterprise.” Global Industry 4.0. Survey. PwC. Accessed 12 July, 2021. https://www.pwc.com/gx/en/industries/industries-4.0/landing-page/industry-4.0-building-your-digital-enterprise-april-2016.pdf.
- Ghobakloo, M. 2020. “Determinants of Information and Digital Technology Implementation for Smart Manufacturing.” International Journal of Production Research 58 (8): 2384–2405. doi:10.1080/00207543.2019.1630775.
- Gorenšek, T., and A. Kohont. 2019. “Conceptualization of Digitalization.” International Journal of Euro-Mediterranean Studies 12 (2): 93–116. Accessed 12 July, 2023. http://www.dlib.si/?URN=URN:NBN:SI:DOC-XBGA1JHF.
- Götz, M., and B. Jankowska. 2017. “Clusters and Industry 4.0 – do They fit Together?” European Planning Studies 25 (9): 1633–1653. doi:10.1080/09654313.2017.1327037.
- Grasland, L., and G. Puel. 2007. “The Diffusion of ICT and the Notion of the Digital Divide: Contributions from Francophone Geographers.” GeoJournal 68 (1): 1–3. doi:10.1007/s10708-007-9048-1.
- Greef, S., and W. Schroeder. 2021. “How Does Industry 4.0 Affect the Relationship Between Centre and Periphery? The Case of Manufacturing Industry in Germany.” European Planning Studies 29 (9): 1656–1671. doi:10.1080/09654313.2021.1963051.
- Gress, D., and R. Kalafsky. 2015. “Geographies of Production in 3D: Theoretical and Research Implications Stemming from Additive Manufacturing.” Geoforum; Journal of Physical, Human, and Regional Geosciences 60: 43–52. doi:10.1016/j.geoforum.2015.01.003.
- Haefner, L., and R. Sternberg. 2020. “Spatial Implications of Digitization: State of the Field and Research Agenda.” Geography Compass 14: 12544. doi:10.1111/gec3.12544.
- Halpin, B. 2016. “Multiple Imputation for Categorical Time Series.” Stata Journal 16 (3): 590–612. doi:10.1177/1536867X1601600303.
- Hamzeh, R., R. Zhong, and W. Xu. 2018. “A Survey Study on Industry 4.0 for New Zealand Manufacturing.” Procedia Manufacturing 26: 49–57. doi:10.1016/j.promfg.2018.07.007.
- Hasbi, M. 2020. “Impact of Very High-Speed Broadband on Company Creation and Entrepreneurship: Empirical Evidence.” Telecommunications Policy 44: 101873. doi:10.1016/j.telpol.2019.101873.
- Häider, M. 2020. “Electrifying Times: Restructuring and Decision-Making in an Automobile Concern in the 21st Century – The Case of BMW Group.” Hungarian Geographical Bulletin 69 (2): 119–135. doi:10.15201/hungeobull.69.2.3.
- Hellsten, P., and A. Paunu. 2020. “Digitalization: A Concept Easier to Talk About Than to Understand.” Knowledge Engineering and Knowledge Management 3: 226–233. doi:10.5220/0010145302260233.
- Houzet, S. 2007. “The Diffusion of ICT in France: Infrastructures, Services and Uses.” GeoJournal 68 (1): 5–17. doi:10.1007/s10708-007-9049-0.
- Howaldt, J., R. Kopp, and J. Schultze. 2017. “„Why Industrie 4.0 Needs Workplace Innovation – a Critical Essay About the German Debate on Advanced Manufacturing”.” In Workplace Innovation. Theory, Research and Practice, edited by R. Oeij, D. Rus, and F. Pot, 45–60. Berlin: Springer.
- I-SCOOP. 2017. Industry 4.0 and the Fourth Industrial Revolution Explained. Accessed 5 July, 2022. https://www.i-scoop.eu/industry-4-0/.
- Isaksen, A., M. Trippl, N. Kyllingstad, and J. Rypestøl. 2020. “Digital Transformation of Regional Industries Through Asset Modification.” Competitiveness Review 31 (1): 130–144. doi:10.1108/CR-12-2019-0140.
- Johnson, J. 1981. “Location and Trade Theory. Industrial Location, Comparative Advantage, and the Geographic Pattern of Production in the United States.” Research Paper 198. The University of Chicago.
- Kiss, E. 2007. “Foreign Direct Investment in Hungary: Industry and its Spatial Effects.” Eastern European Economics 45 (1): 6–28. doi:10.2753/EEE0012-8775450101.
- Kiss, E., and E. Nedelka. 2020. “Geographical Approach of Industry 4.0 Based on Information and Communication Technologies at Hungarian Enterprises in Connection with Industrial Space.” Hungarian Geographical Bulletin 69 (2): 99–117. doi:10.15201/hungeobull.69.2.2.
- Kocsis, K., Z. Kovács, Z. Nemerkényi, G. Gercsák, Á Kincses, and G. Tóth, eds. 2021. National Atlas of Hungary Society. Budapest: RCAES Geographical Institute.
- Kotarba, M. 2017. “Measuring Digitalization – Key Metrics.” Foundations of Management 9 (1): 123–138. doi:10.1515/fman-2017-0010.
- Kuttor, D. 2022. “New Drivers of Industrialization and Novel Aspects of Hungarian-Chinese Bilateral Cooperation. Chinese Foreign Investments in Hungary.” Tér és Társadalom 36: 99–121. doi:10.17649/TET.36.3.3436.
- Leamer, E., and M. Storper. 2001. “The Economic Geography of the Internet Age.” NBER Working Paper 8450, Cambridge. Accessed 1 July, 2021. http://www.nber.org/papers/w8450.
- Losonci, D., O. Takács, and K. Demeter. 2019. “Az Ipar 4.0 Hatásainak Nyomában – a Magyarországi Járműipar Elemzése.” Közgazdasági Szemle 66 (2): 185–218. doi:10.18414/KSZ.2019.2.185.
- Luo, Y. 2021. “New OLI Advantages in Digital Globalization.” International Business Review 30: 101797. doi:10.1016/j.ibusrev.2021.101797.
- Malecki, E. 2017. “Real People, Virtual Places, and the Spaces in Between.” Socio-Economic Planning Studies 58: 3–12. doi:10.1016/j.seps.2016.10.008.
- Manyika, J., C. Michael, M. Mehdi, B. Jacques, G. Katy, W. Paul, and D. Martin. 2017. A Future That Works: Automation, Employment and Productivity. San Francisco: McKinsey Global Institute.
- McCoy, D., S. Lyons, E. Morgenroth, D. Palcic, and L. Allen. 2018. “The Impact of Broadband and Other Infrastructure on the Location of new Business Establishments.” Journal of Regional Science 58: 509–534. doi:10.1111/jors.12376.
- Midelfart-Kvarnik, K., H. Overman, S. Redding, and A. Venables. 2000. “The Location of European Industry.” Economic Papers 142. European Communities.
- Mokyr, J. 1985. The New Economic History and the Industrial Revolution. Washington D.C: Rowman and Littlefield Publishers.
- Muscio, A., and A. Ciffolilli. 2020. “What Drives the Capacity to Integrate Industry 4.0 Technologies? Evidence from European R&D Projects.” Economics of Innovation and New Technology 29 (2): 169–183. doi:10.1080/10438599.2019.1597413.
- Neffke, F., M. Henning, and R. Boschma. 2011. “How Do Regions Diversify Over Time? Industry Relatedness and the Development of New Growth Paths in Regions.” Economic Geography 87 (3): 237–265. doi:10.1111/j.1944-8287.2011.01121.x.
- Nuccio, M., M. Guerzoni, R. Capelli, and A. Geuna. 2020. “Industrial Pattern and Robot Adoption in European Regions.” Working Paper Series 3: 1–33. Universitá Ca’ Foscari Venezia.
- OECD. 2019. Measuring the Digital Transformation: A Roadmap for the Future. Paris: OECD Publishing. Accessed 22 April, 2023. https://www.oecd.org/publications/measuring-the-digital-transformation-9789264311992-en.htm.
- Porter, M. 1994. “The Role of Location in Competition.” International Journal of the Economics of Business 1 (1): 35–40. doi:10.1080/758540496.
- Reischauer, G. 2017. “Industry 4.0 as Policy-Driven Discourse to Institutionalize Innovation Systems in Manufacturing.” Technological Forecasting and Social Change 132 (C): 26–33. doi:10.1016/j.tech-fore.2018.02.012.
- Rueda-Sabater, E., and J. Garrity. 2010. “The Emerging Internet Economy: Looking a Decade Ahead.” The Global Information Technology Report, 33–47. Accessed 18 July, 2021. http://reports.weforum.org/wp-content/pdf/gitr-2011/wef-gitr-2010-2011.pdf.
- Santos, C., A. Mehrsai, A. Barros, M. Araujo, and E. Ares. 2017. “Towards Industry 4.0: An Overview of European Strategic Roadmaps.” Procedia Manufacturing 13: 972–979. doi:10.1016/j.promfg.2017.09.093.
- Saraçli, Sinan, Nurhan Doğan, and İsmet Doğan. 2013. “Comparison of Hierarchical Cluster Analysis Methods by Cophenetic Correlation.” Journal of Inequalities and Applications 203 (1), doi:10.1186/1029-242X-2013-203.
- Schwab, K. 2016. “The Fourth Industrial Revolution.” Cologne/Geneva: World Economic Forum. Accessed 1 July, 2021. https://www.weforum.org/about/the-fourth-industrial-revolution-by-klaus-schwab.
- Stevens, B., and C. Brackett. 1967. Industrial Location. A Review and Annotated Bibliography of Theoretical, Empirical and Case Studies. Philadelphia: Regional Science Research Institute.
- Szakálné Kanó, I., B. Lengyel, Z. Elekes, and I. Lengyel. 2019. “Agglomeration, Foreign Firms and Firm Exit in Regions Under Transition: The Increasing Importance of Related Variety in Hungary.” European Planning Studies 27 (11): 2099–2122. doi:10.1080/09654313.2019.1606897.
- Szerb, L., É Komlósi, and B. Páger. 2020. “Új technológiai cégek az Ipar 4.0 küszöbén. A magyar digitális vállalkozási ökoszisztéma szakértői értékelése.” Vezetéstudomány/Budapest Management Review 51 (6): 81–96. doi:10.14267/VEZTUD.2020.06.08.
- Šlander, S., and P. Wostner. 2019. “Transformation and Transition to Industry 4.0: The Slovenian Smart Transformational Approach.” In Revitalising Lagging Regions: Smart Specialization and Industry 4.0. Regional Studies Policy Impact Books, 1(2), edited by M. Barzotto, C. Corradini, F. M. Fai, S. Labory, and P. R. Tomlinson, 55–66. Abingdon: Taylor & Francis Group. doi:10.1080/2578711X.2019.1621101.
- Teece, D. 2018. “Business Models and Dynamic Capabilities.” Long Range Planning 51 (1): 40–49. doi:10.1016/j.lrp.2017.06.007.
- Thoben, K., W. Alexander, and W. Thorsten. 2017. ““Industrie 4.0” and Smart Manufacturing – A Review of Research Issues and Application Examples.” International Journal of Automation Technology 11 (1): 4–16. doi:10.20965/ijat.2017.p0004.
- Tranos, E. 2012. “The Causal Effect of the Internet Infrastructure on the Economic Development of European City Regions.” Spatial Economic Analysis 7 (3): 319–337. doi:10.1080/17421772.2012.694140.
Appendix 1.
Values of indicators for determining the number of clusters, 2014–2019.
Clusters for the year 2014.
Clusters for the year 2016.
Clusters for the year 2019.