
 ?Mathematical formulae have been encoded as MathML and are displayed in this HTML version using MathJax in order to improve their display. Uncheck the box to turn MathJax off. This feature requires Javascript. Click on a formula to zoom.
ABSTRACT
Contemporary urban planning is permeated by the general goal of increasing the mix of activities in urban areas and subareas. This paper argues that there are several steps between plans for increased mix and the final urban improvements expected from such plans, and that a mix of activities (reside, work, visit) is a necessity for this line of thought to make sense. However, the main aim is to present a follow-up on these planning goals in a Swedish context. An empirical examination based on register data indicates that activities are most mixed in small-town centres and immediately outside the most central areas of larger cities. During the studied period of 1997–2017, most of the urban subareas have become more mixed. Nonetheless, most towns and cities in their entireties became less mixed, due to the simultaneous net redistribution of activities to monofunctional areas. As a consequence, the final objectives of the mixed-use planning are not achieved, regardless of whether mixed-use planning is connected to activity mix. Visiting activities (e.g. out-of-town retail developments) are the primary contributor to this counter-intentional redistribution, but work activities also contribute to some extent.
KEYWORDS:
1. Introduction
Towards the end of the twentieth century, new diversity-oriented ideals replaced earlier zoning ideas in urban planning (e.g. Commission of the E.C. Citation1990; Boverket, Swedish Planning Authority Citation1995). This shift was greatly influenced by the work of Jane Jacobs (Citation1961), which identified four conditions of diversity, supposed to facilitate urban vitality.
Nowadays, some evaluative studies consider Jacobs’ diversity idea as a whole (e.g. Huang et al. Citation2023), while others have focused on either of the four conditions it consists of (e.g. Powe et al. Citation2016 on building age, Mouratidis Citation2019 on density, van Nes Citation2021 on street intersections and Yoshimura et al. Citation2022 on urban mix). The focus of this study is on abilities to strengthen diversity.
An area cannot be retroactively supplied with buildings of various ages, and increasing the number of street intersections presupposes greenfield developments. Densification and increased mixing are options closer at hand for planning. Previous studies have established ongoing urban densification in the Nordic countries (e.g. Næss Citation2022; Tiitu, Naess, and Ristimäki Citation2021). The situation in other parts of Europe and worldwide is more diverse (e.g. Mahtta, Mahendra, and Seto Citation2019; Wolff, Haase, and Haase Citation2018). As early as 1996, Rowley claimed that ideas relying on the concept of ‘mixed use’ were both ambiguous and based on simplistic analysis and wishful thinking. Likewise, in the Swedish planning debate, Thunström (Citation2009) noted similar vaguenesses in the use of central concepts. Nonetheless, ‘to mix’ has remained a backbone of urban planning in Sweden and many other countries, and it is the main focus of this study.
Throughout the long history of urban planning, ideals have come and gone, and the localisation logics of various urban activities have evolved. Consequently, cities and towns have developed into mosaics of areas, each displaying a certain kind of environment. These urban landscapes constituted the starting points for the planners who aimed to achieve a greater mix of activities towards the end of the twentieth century in Sweden as well as in many other countries. Against this background, the aim of the present study is to explore to what extent Sweden’s urban localities (i.e. towns and cities), in their entireties and their subareas of various types, displayed more mixed activities in 2017 than they did in 1997. Sweden is one of the few countries where detailed register data is available, making it possible to study an entire country at two points in time. Thereby, the study also intends to reveal the kinds of urban areas and urban activities that contribute to – or counteract – the desired development towards increased activity mix. The study period is intended to roughly correspond to the period when efforts to mix were intensified in Sweden, but issues with availability and quality of data have also influenced its exact delimitation.
The next sections delimit the study object and presents a literature review. Subsequently, categorisations and operationalisation of data and analytical methods are presented. Then, the activity mix in urban Sweden in 2017 and how it has changed since 1997 are accounted for. The paper ends with a few explicit conclusions and a discussion of them.
2.1. From plans to their objectives
Although the final objectives vary, the overall intention of plans to mix residential dwellings with office spaces, premises for retail and restaurants, and so forth, is to achieve some kind of improved urban quality and conditions for the people in these areas. For example, the EU green paper (Commission of the E.C. Citation1990) mentioned objectives as different as providing an attractive environment for inhabitants, decreasing (private) transportation needs and – in its wake waters – decreased pollution, avoiding the negative effects of tourism and fostering creativity.
A conceptual model of the logical steps from planning ideas ‘to mix’, to achieving their final objectives, serving as a basis for this study, is sketched in . Plans for mixed use are made (1), and implemented by the construction of appropriate facilities, buildings, and premises (2), where the intended activities are established (3), contributing to vital and vibrant urban areas (4), and finally, the fulfilment of the final objectives (5).
Figure 1. The steps from a plan for mixed use to its final objectives.
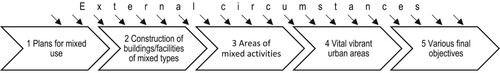
Each arrow represents a phenomenon that can be studied, and each gap between arrows represents an assumed link that can be questioned and tested. For example, the gap between arrows 1 and 2 indicates that plans are not necessarily implemented and, even when they are, they may be implemented in ways other than intended (cf. Talen et al. Citation2016). Furthermore, the gap between arrows 2 and 3 indicates that built premises are not necessarily used in their planned way (cf. Wandl and Hausleitner Citation2021), and the gap between arrows 3 and 4 that the impact of urban activity mix on vitality is unclear (cf. Hoppenbrouwer and Louw Citation2005; Jacobs-Crisioni et al. Citation2014). Finally, a vibrant atmosphere does not inevitably foster creativity, a decrease in car use, or any other final goal (gap between arrows 4 and 5). Furthermore, as Rowley (Citation1996) pointed out when the idea of mixed-use planning was fresh, an ascertained increase in activity mix (as well as the other steps) may be achieved in many other ways than through planning measures. Conversely, external circumstances can also spoil the most ambitious planning efforts, as recently demonstrated by Grant, Filion, and Low (Citation2019) and Limb et al. (Citation2021).
Aside from unconsidered circumstances, skipping one or more of the steps illustrated in may also explain why the messages from the literature can be contradictory. Thus, regarding the objectives in the EU green paper mentioned above, for example, Koster and Rouwendal (Citation2012) found that the price of houses is higher in mixed-use settings than elsewhere (indicating attractivness), but Park, Huang, and Newman (Citation2016) reported the opposite. A study by Ewing et al. (Citation2011) concluded with cautiously positive findings concerning the effects of mixed use on transportation, whereas a study by Zagow (Citation2020) hinted at increased carbon emissions. Similarly, although Sung, Lee, and Cheon (Citation2015) found urban life in Seoul to be more vital in mixed-built environments, Delclòs-Alió, Gutiérrez, and Miralles-Guasch (Citation2019) obtained more ambiguous results in Barcelona.
2.2. Previous studies of activity mix in various types of urban sub-areas
Thus far, only a limited number of studies have actually focused on activity mix, as such, in urban areas. Hoppenbrouwer and Louw (Citation2005) used register data to demonstrate mixed use at different levels of geographical resolution in part of Amsterdam. Rueda Palenzuela et al. (Citation2022) used data on urban legal entities in various sub-areas of Barcelona to conclude that the semi-central area Eixample is the most mixed, while peripheral areas are the least mixed. In another study of Amsterdam, Jacobs-Crisioni et al. (Citation2014) found that the level of mix of building and facility types in residential areas of Amsterdam is reflected in the geographical and temporal patterns of mobile phone usage. Kopáčik, Vaishar, and Šimara (Citation2021) analysed the activities in various subareas of three Moravian cities using a similar set of mobile phone data. Twenty-four-hour temporal variations, which indicate homogeneous activities, are greatest in work areas, areas with civic amenities, and the central parts of cities.
Khan, Pafka, and Dovey (Citation2023) mapped a large number of physical features of buildings within a 500 × 500-metre square in Dhaka and analysed its increased functional mix in the late 20th and early 21st centuries, thereby adding a time dimension. Gallagher, Sigler, and Liu (Citation2023) used data sourced from maps to study how zoning and land use have changed since the 1950s in Brisbane. They found an increase in homogeneous urban ‘blandscapes’, despite planning ambitions to achieve the opposite. Finally, Morawska et al. (Citation2024) employ a bottom-up approach, starting from two ‘naturally occurring’ dynamic city districts with mixed functions in Poland, to investigate their morphological (and other) qualities using ethnographic methods.
2.3. How to delimit urban areas and categorise the activities within them
Rowley (Citation1996) sketched an analytical model that considered urban texture and time, in order to more systematically examine mixed use. Hoppenbrouwer and Louw (Citation2005) developed Rowley’s thinking further. In addition to discussing the issues of which functions should be mixed and what diversity of these functions is desirable (e.g. should ‘residential’ be viewed as a function to be mixed with other functions, or should it first be subdivided further?), Hoppenbrouwer and Louw also focused on the matter of geographical scale (e.g. does the study object consist of buildings, blocks or neighbourhoods?) and how to handle mixes in the time dimension (e.g. a cinema used as a conference venue during the daytime).
Unfortunately, a lack of data prevents this time dimension from being considered here. Regarding scale, this study intends to reveal any increases in activity mix in towns and cities as wholes. However, as the planning efforts in Sweden (as well as in many other countries) are most evident in their various kinds of subareas, this spatial level will also be given attention. Too often, the modifiable areal unit problem, MAUP (Openshaw Citation1984), is ignored, although the way urban subareas are delimited may have a crucial impact on the results of any study. The activity mix of an area is often considered to be influenced by its physical setup (which, in turn, is connected to certain planning ideas; cf. ), and people’s use of space is structured by it (e.g. Huszti et al. Citation2021; Roberto and Korver-Glenn Citation2021). Thus, a subdivision suitable for this study should reflect variations in the ways in which towns and cities are planned and built, as well as urban barriers (e.g. rivers or railways).
While any category of activities can be subdivided, overly fine-grained taxonomies would bring about questionable classification decisions (cf. Dovey and Pafka Citation2017). Furthermore, planners attempting to achieve an activity mix likely do not expect every specialized type of retail, restaurant, theatre, etc., to be present in every subarea. Neither do they expect full setups of types of workplaces or dwellings. At the other end of the classification spectrum is a categorisation of only three types suggested by Le Corbusier (Citation[1957] 1973) and embraced by his major opponent, Jane Jacobs (Citation1961), in her discussion of primary and secondary urban functions: the use of an area for residential purposes, work and other visits. It is fairly obvious what residing and working (‘primary functions’, in Jacobs’ terminology) in an urban area comprise. Here, ‘visiting’ (generally ‘secondary functions’, according to Jacobs) refers to any activity beyond residing and working, for example shopping, dining and going to the theatre. This rough classification is sufficient for the purposes of the present study.
2.4. How to measure activity mix
Although there are several alternatives that can be used to measure activity mix, each with its own advantages and disadvantages (for an overview, see Dovey and Pafka Citation2017), entropy indices are widely used for this purpose. An entropy index is sensitive to varying sizes of classes and, of course, to classification as such, and has been criticized for ignoring the mix within the geographical units being analysed (e.g. Manaugh and Kreider Citation2013). Many scholars have developed and suggested other indexes, based on several types of data (e.g. Lan et al. Citation2021; Mavoa et al. Citation2018; Motieyan and Azmoodeh Citation2021) or alternative approaches (Dovey and Pafka Citation2017). Despite these efforts, such indices rarely seem to become widely used tools.
To be able to properly measure intra-urban variations in the mix of the three activity types residing, working and visiting, data on the number of people present is needed for each geographical subarea, categorized into the activities these people are involved in. Since such data are missing, it is necessary to employ proxies. As exemplified above, data on the positions of mobile phones was recently used for this purpose. A more old-school option would be travel diaries (cf. Sung, Lee, and Cheon Citation2015). Even more indirect data, such as water-consumption time series, may also be used (cf. Guan et al. Citation2021). However, as data from fairly recent times, as well as from a point 25–30 years ago, are needed for this study, register data appears as an appropriate alternative.
3. Preparing the data
Since the register data used here have been collected and compiled for purposes other than the study of urban activity mix, an appropriate geography and a suitable operationalisation of the three types of activities under consideration must be determined. Fortunately, Swedish register data are detailed enough to be aggregated in ways appropriate for this study, both in terms of geography and activities.
3.1. Various types of localities and morphological setups in urban Sweden
All urban localities in Sweden (≥2000 inhabitants) are divided into a total of 8,540 subareas known as ‘MorfO areas’. These subdivisions are primarily based on ensembles of buildings and various types of urban fault lines observed towards the end of the study period. The creation of MorfO areas was guided by the results of an automatic process of clustering nearby/adjacent real property units of similar types. Nevertheless, in the final step, MorfO areas are manually delimited by considering barriers (e.g. rivers, railway lines), plans, aerial photographs and other relevant information (Amcoff Citation2022).
MorfO is not assumed to be the definitive and final subdivision, even for the purpose at issue here. However, based on its delimitation procedure, it reflects the manifestations of various planning ideas, urban barriers, and the possible presence of prerequisites for various types of activities, better than any other urban subdivision provided in Sweden.
More than half of all present dwellings in Sweden were constructed during the post-war decades (i.e. 1945–1979). In line with the planning ideas of this era, the resulting residential areas are generally homogeneous. Thus, the two most common types of residential MorfO areas today are those dominated by blocks of flats and those dominated by detached single-family houses. MorfO areas dominated by non-detached single-family houses (e.g. row houses) are also distinguished, as are residential areas of mixed types of houses (residential, mixed). Finally, a residual area of undeveloped urban land is considered ().
Figure 2. Examples of the various types of MorfO areas. Sources: Google Maps.
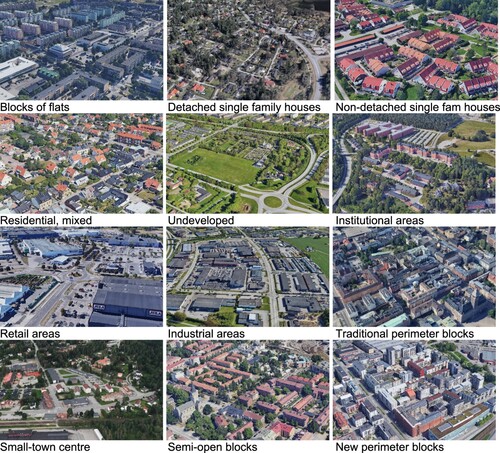
Among the MorfO areas dominated by buildings intended for various kinds of non-residential activities, three types can be distinguished. First, there are areas that predominantly contain societal buildings (e.g. large administrative centres, educational or hospital complexes), known as institutional areas. Then, there are purpose-built retail areas (i.e. out-of-town retail developments including car parks). Finally, there are industrial areas that predominantly contain blue-collar workplaces.
Additionally, there are a few types of MorfO areas consisting of more mixed building patterns, including the traditional perimeter blocks typically found in the central parts of historical towns and cities. These areas typically host premises intended for service or retail activities in their bottom floors and offices and/or residential space higher up. In Sweden, these central areas are often surrounded by less dense blocks, more open yards and greenery, and a mix of various residential and service buildings, semi-open blocks. The small-town centre may be described as an array of semi-open blocks, but it contains more buildings devoted to retail and service activities, as well as institutional buildings. Finally, the renaissance of the perimeter block since the 1990s is represented by the new perimeter blocks, which are more dominated by residential buildings than their historical counterparts.
A number of adjacent MorfO-areas together form an urban locality (e.g. town or city). Each urban locality has its specific raison d’être, history, age, size and so forth, which are reflected in their physical structures and rate of change. With the intention of considering such possible differences, the 476 Swedish urban localities (>2000 inhabitants) included in this study have been roughly categorized into six groups.
The three largest cities in the country (Stockholm, Gothenburg and Malmö) are widely analysed together in Sweden and thus form the first group, big cities. The second group consists of cities that function as regional hubs. All of them have a charter (indicating a long history) and either a status as a regional administrative capital (‘residensstad’) or at least 40,000 inhabitants. Small towns (with a charter but fewer than 40,000 inhabitants) make up the third group. In addition to these proper urban localities, three types of semi-urban localities are considered. Enequist’s state-of-the-art ‘Types of agglomerations and rural districts’ in the 1957 Atlas of Sweden is used to group them. Urban localities that exist today but not when Enequist did her work comprise the group new towns. The remaining localities are divided into industrial localities or other localities, depending on their classification by Enequist (Citation1957). Thus, ‘industrial’ primarily refers to heritage, which can be supposed to have made its mark on the urban morphologies (cf. Vikström Citation1991), regardless of the contemporary industrial status.
3.2. Operationalising activities
Register data is used to indicate the functions present in each MorfO area. Their numbers of residents and numbers of people employed are obtained from the PLACE database at Uppsala University, supplied by Statistics Sweden.
In terms of the functions in an area, attending school may be seen as an activity equivalent to work, since pupils spend most of their days at school. Unfortunately, data on the number of pupils per school is missing. Instead, a proxy for these numbers is added to the number of employed. It was calculated by multiplying the number of people employed in each kind of school (see Appendix for operationalisation) in each MorfO area with the national average number of pupils per employed individual in each kind of school ().
Table 1. Number of people employed in localized public activities and their stipulated numbers of clients in Sweden, in 1997 and 2017.
A proxy for the numbers of visitors is calculated in the same way (number of employed in retail and consumer services in a MorfO-area × (customer base per employed in Sweden)), with the population (16 + years) assumed to be the customer base, and localized retail activities and consumer services (see the Appendix for operationalisation). Obviously, these operationalisations result in rough approximations, and in reality, the types, lengths and frequency of visits vary. For example, during ages when educational activities are compulsory, pupils can be supposed to be present in school every weekday, whereas a university student may be present for just a few lectures per week (or even take a course online). Similarly, in terms of activities in a neighbourhood, a quick visit to the supermarket to buy a package of coffee is very different from spending a few hours at an outdoor café. Furthermore, these variations are not necessarily reflected in the spatial subdivision of towns and cities into MorfO-areas (cf. Jacobs-Crisioni et al. Citation2014; Kretzer, Kanashiro, and Tibiriçá de Saboya Citation2023). The compiled results of these data exercises are summarized in .
Table 2. Indicators of activities in the MorfO areas of urban Sweden.
3.3. Methods
An entropy index will be used to indicate activity mix in each urban area. It is a simple measure, but appropriate given the explorative aim of the study, the vagueness of the concept ‘mix’ in fundamental Swedish planning documents (Thunström Citation2009), the roughly categorised register data used to perform it, and their extent in space and time. Additionally, as the categories are reasonably similar in extent, a common critique against this type of index is mitigated here. The entropy score of a specific MorfO area is calculated as follows:
where k represents the number of categories and
is the proportion of the indicated activities of the jth category in MorfO area i (i.e.
, where
represents the indicated number of activities in the jth category in MorfO area i, and
is the total number of indicated activities in MorfO area i).
With three types of activities, the entropy score will be between 0 (only one type of use is present in the MorfO area) and 1.1 (all three types of uses are present in the MorfO area to the same extents). To calculate the total mix of activities in an urban locality as a whole, the method suggested by White (Citation1986) is used:
where
is the entropy score for the urban locality as a whole and
is the sum of the entropy scores (h) of all the MorfO areas in a locality. The score H = 0 indicates a state in which every MorfO area in an urban locality has the same mix of activities, while H = 1 indicates an urban locality in which every MorfO area is completely monofunctional.
The changes over time in single MorfO areas and entire urban localities are established simply, by comparing the scores of h and H. The redistribution rate is used to calculate the redistribution of the various kinds of activities between different kinds of MorfO areas. The redistribution rate is calculated as follows:
where sit1 and sit2 respectively denote the number of indicated activities at the beginning and end of the study period in MorfO i, and St1 and St2 respectively denote the total number of indicated activities at the beginning and end of the study period. Thus, R is a relative measure expressed in absolute figures. It indicates to what extent the change in the number of activities in a certain type of MorfO area diverges from the general increase or decrease in activities.
With the intention of achieving concreteness and verifying results, they have been followed up by investigations of their physical manifestations in the urban landscape.
4. Activity mix in various parts of urban Sweden in 2017
As some MorfO areas consist of a group of similar buildings intended to fulfil a specific function, whereas others consist of groups of various kinds of buildings, varying levels of activity mix are expected, as accounted for in . High levels of activity mix are common in MorfO areas with mixed building patterns and rare in MorfO areas where buildings are primarily devoted to a specific non-residential type of use, with retail areas in an extreme position (55% in h-quintile 1). In comparison, there are both monofunctional and mixed residential areas.
Table 3. Numbers of MorfO areas distributed into types of building patterns and shares of these sorted into quintiles according to the level of activity mix in 2017.
Given the operationalisation of ‘mixed’, some small MorfO areas appear in h-quintile 5, although these consist of just a few small groups of buildings that may host a few hundred inhabitants, a grocery store and a school. Such areas clearly do not exemplify what is referred to as ‘mixed use’ in the planning debate. Thus, a second criteria may be added: at least 10 facilities of each kind (dwellings, workplaces and facilities attracting visitors) must be present in addition to the specified level of activity mix. In , the shares of MorfO areas fulfilling these two-step criteria are accounted for in parentheses. Understood in this stricter way, 690 of the 8540 MorfO areas fulfil the criteria for ‘mixed’, and these are even more concentrated into areas with mixed building patterns (i.e. traditional perimeter blocks usually found in city centres and developed over long periods of time, and the disorderly patterns typical of small town centres).
4.1. The location of mixed areas in towns and cities
To obtain a rough impression of the location patterns of mixed functions, the MorfO areas that fulfil the two-step criteria are determined to be ‘mixed’. The remaining MorfO areas are seen as being dominated by whichever of the three types of activities is most common – that is, residential, work or visiting.
An explorative glance at the geographical situations of the areas with mixed activities reveals that their exact locations seem to differ, depending on type of host locality. Whereas the ultimate centres of small towns and many semi-urban localities generally qualify as mixed, the most central parts of seven out of eight cities with more than 100,000 inhabitants – all of which are characterized by traditional perimeter blocks – are dominated by visiting activities and lack residential use. In these cases, MorfO areas displaying activity mix tend to be localized just outside the most central parts of the cities, albeit still often in perimeter blocks. For illustrative purposes, the small town Arboga (10,000 inhabitants) and the regional hub of Linköping (115,000 inhabitants) are used as tangible examples ().
Figure 3. Dominant urban use in the MorfO areas of Arboga and Linköping. Sources: Lantmäteriet (buildings), Uppsala University (MorfO areas).
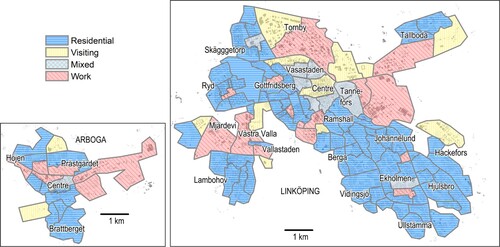
With 1,000 residents, 700 workplaces and 2,000 visitors (h = 0.99), Arboga centre is the only mixed MorfO-area in the town. The MorfO area of the Linköping centre is dominated by activities that attract visitors. With only 4,400 residents, compared with 12,000 workplaces and 28,000 visitors, the h-score is 0.87. However, the centre is surrounded by areas that fulfil our stipulated criteria for ‘mixed’, such as Vasastaden and Tannefors. Apart from these semi-central MorfO areas, a few residential areas host islands of services, retail, and office space among dwellings (Skäggetorp and Ekholmen). Otherwise, the outer parts of Linköping are monofunctional.
5. Changes in activity mix in urban Sweden 1997–2017
The roughest indicator of changes in activity mix is their directions. The shares of various types of MorfO areas displaying an increased activity mix from 1997 to 2017 are accounted for in . Overall, just over half of the MorfO areas display increased activity mix, although the directions of change vary both within and between all categories. Nonetheless, a few general tendencies are notable.
Table 4. Share of MorfO areas with an increasing activity mix from 1997 to 2017, distributed into types of building patterns and localities.
Firstly, there are a few categories in which most MorfO areas display an increased activity mix. Usually, the residential and work activities in traditional perimeter blocks and centres in historical small towns have slowly increased at the expense of the hitherto dominating visiting activities. Most MorfO areas of newly built perimeter blocks (in proper urban areas) have also become more mixed, as residential functions have been added to previous work and visiting activities. In the three big cities and in (often their surrounding) new towns, there are many residential MorfO areas of various kinds that had more mixed activities in 2017 than in 1997. In these cases, a closer investigation shows that some kinds of shops and/or services have usually been added to areas that were previously devoted to residential activities alone.
Secondly, some categories of MorfO areas have generally become more mono-functional. These include retail and institutional MorfO areas in proper urban localities (increased h only in 38%–45%). This shift is usually due to an increase in the already dominating functions of visiting and work, respectively. In , most small-town centres can be seen to be mixed in 2017. However, while mixing increased between 1997 and 2017 in the centre of most historic small towns, it decreased in the centre of most semi-urban localities due to a combination of fewer people working there, slightly fewer visitors, and an increase in dominating residential activities. Finally, most residential MorfO areas in semi-urban industrial localities have become more monofunctional.
Although a slight majority of MorfO areas display an increased activity mix from 1997 to 2017, most of the urban localities they make up do not (). In terms of categories, only new towns (and possibly big cities, as two out of three cities became more mixed) match the development at the MorfO level. This seemingly contradictive result may be due to systematic variations in the localities’ compositions of MorfO areas of different sizes, types and development level. However, based on the data, this result instead seems to be due to a redistribution of the activities between their MorfO areas.
Table 5. Numbers of Swedish urban localities (>2000 inhabitants) distributed into types and change in total activity mix (H).
5.2. Redistribution of activities between MorfO areas
To separate the effects related to changes within MorfO areas as such from those related to redistribution of activities between them, the activity mix of each MorfO area in 2017 is assigned a relative weight – that is, its share of activities within the locality it belongs to () as of 1997. Next, these hypothetical results in which there is no redistribution of activities between MorfO areas are calculated and compared with the real situation in 2017.
First, this experiment shows that – aside from redistributive effects – the development at the locality level would then have been roughly similar to the development at the MorfO level; a slight majority of the localities (239 out of 476) would have displayed an increased mix of activities (H-score). Second, focusing on redistribution instead, 92 proper urban localities out of 118, and 166 semi-urban localities out of 346, were affected by a redistribution of activities that counteracted the effects of the increased mix underway in most individual MorfO areas. Nonetheless, this redistribution differs between various kinds of MorfO areas. The redistribution is accounted for in , where each type of MorfO area is split depending on whether it is more or less mixed (in terms of activities) than the average in its host locality.
Table 6. Number of MorfO areas of various types of building patterns and with an activity mix above/below average in their host locality, and redistribution rates (R) from 1997 to 2017 between them of three activities and in total (thousands).
Several observations can be gleaned from . Firstly, although the total redistribution amounts to hundreds of thousands of people for each activity (out of 5–6 million in 1997; see ), the total redistribution of visiting activities stands out, at 884,000 people. Secondly, the total redistribution of all three types of activities is to the advantage of MorfO areas less mixed than average, although it is most pronounced in regard to visiting activities. Thirdly, among MorfO areas dominated by mixed and non-residential buildings, the less-mixed-than-average came better out of the 1997–2017 redistribution of activities than their more-mixed-than-average counterparts (with newly constructed perimeter blocks as an exception), whereas the opposite is true for the residential MorfO areas (with the residual category of ‘undeveloped’ as an exception).
More detailed observations can be made regarding the main redistributive effects within the three types of activities. Thus, fourthly, residential activities are redistributed from MorfO areas dominated by various types of single-family houses to newly constructed perimeter blocks and mixed residential areas. Fifthly, workplaces are redistributed from many types of MorfO areas to areas designated for such activities – particularly to homogeneous institutional areas. A closer investigation indicates that the gathering together of university facilities is a main contributor. Sixthly, a huge redistribution of visiting activities can be observed, primarily from MorfO areas dominated by traditional perimeter blocks (i.e. town centres) to designated homogeneous retail areas and industrial areas.
6. Conclusions and discussion
In terms of detailed urban geography, the results of this study show that mixed building patterns – which are most common in central urban locations – tend to display more mixed activities than areas with more homogeneous sets of buildings (although the largest cities may be an exception, due to the limited shares of residential activities in their centres). As a group, purpose-built areas devoted to types of non-residential activities (e.g. out-of-town retail or working) are the most monofunctional, whereas the levels of activity mix vary in residential areas. These conclusions are well in line with previous studies and align with the assumption that mixed building patterns may foster mixed activities (cf. for example Jacobs-Crisioni et al. Citation2014; Kopáčik, Vaishar, and Šimara Citation2021; Morawska et al. Citation2024).
Adding a time dimension reveals examples of MorfO areas with diminishing activity mixes over the studied period of 1997–2017, particularly among areas that were purpose-built to host retail and institutional activities. These examples also include some types of MorfO areas displaying mixed building patterns (e.g. small-town centres of semi-urban localities), hinting that the connection between mixed building patterns and mixed activities may not be straightforward. Nonetheless, a slight majority of the MorfO areas do indeed display increased activity mix; among these, areas dominated by both traditional and new perimeter blocks, as well as the centres of small towns, figure prominently. It is tempting to see this result as a consequence of planning efforts, and that may well be the case. Nevertheless, several studies have implied that other forces are also at work, both for and against an increased mix of activities (e.g. Grant, Filion, and Low Citation2019; Limb et al. Citation2021; Rowley Citation1996).
However, at a city-level, the redistribution of activities between the MorfO areas has occurred in such a way that the tendency towards an increased mix within most of these areas is generally offset when aggregated to the entire cities, towns or semi-urban localities they make up. Overall, this means that, despite the increased activity mix in many specific areas, Swedish towns and cities are generally not becoming more mixed in terms of activities. Thus, the final objectives of the mixing efforts will hardly be achieved, even if the assumed links () exist. These results are similar to the conclusions reported from Brisbane, Australia, by Gallagher, Sigler, and Liu (Citation2023), but deviate from the findings of Khan, Pafka, and Dovey (Citation2023) in their study of Dhaka, Bangladesh.
The type of activity that contributes most to offset the success at MorfO-level is visiting. During the study period of 1997–2017, about 10% of the visiting activities in urban Sweden were redistributed to retail or industrial MorfO areas that were more monofunctional than average, primarily from traditional perimeter blocks (i.e. city centres). In addition, about 3% of workplaces were redistributed from various locations to institutional areas that were more monofunctional than average. A glance at the most affected locations indicates that the expansion of out-of-town retail developments and the tendency to geographically gather university premises, are among the main drivers behind this redistribution of activities.
Gallagher, Sigler, and Liu (Citation2023) explain the increase of homogenous urban ‘blandscapes’ in Brisbane, Australia, with reference to a liberal planning approach in combination with varying abilities, between activities, to pay for locations. Although the planning procedures are different in Sweden, similar effects cannot be ruled out. However, there are additional conceivable explanations for the failure to achieve an increased activity mix in Swedish towns and cities (and elsewhere). Based on a literature review of ‘logistics sprawl’, a number of these are summarised by Aljohani and Thompson (Citation2016). Thus, an important task for future studies within this field is to shed more light on the strength of the planning process in various urban environments, compared with other forces at play.
Furthermore, the results are not clear-cut, and there are plenty of examples of single MorfO areas – as well as whole urban localities – going against the flow. Given that activity mix is still desirable in planning, future studies could focus on these examples and clearly expose how they deviate from other similar cases (cf. Morawska et al. Citation2024). To fully uncover the underlying processes, including the various forces at play, future studies of urban activity mix should also address the various steps that come between planning and any of the final objectives of interest.
Finally, some important limitations to this study should be pointed out. The use of register data enables the study of a whole country over a long period of time, but exposes the results to the downsides of a rough measure of mix, and the MorfO subdivision refers to the end of the study period. Due to a lack of real data, proxies are used to estimate visiting and schooling activities. In reality, the types, timing and duration of these activities will vary.
Disclosure statement
No potential conflict of interest was reported by the author(s).
Additional information
Funding
References
- Aljohani, K., and R. Thompson. 2016. “Impacts of logistics sprawl on the urban environment and logistics: Taxonomy and review of literature.” Journal of Transport Geography 57: 255–263. doi:10.1016/j.jtrangeo.2016.08.009.
- Amcoff, J. 2022. The construction of MorfO-areas. Uppsala: Department of Human Geography, Uppsala university. https://www.uu.se/en/department/human-geography/research/research-projects/morfo-studies
- Boverket. 1995. “Bättre plats för arbete.” Boverkets allmänna råd, 5.
- Commission of the European Communities. 1990. “Green paper on the urban environment.” COM 90: 218. Brussels
- Delclòs-Alió, X., A. Gutiérrez, and C. Miralles-Guasch. 2019. “The urban vitality conditions of Jane Jacobs in Barcelona: Residential and smartphone-based tracking measurements of the built environment in a Mediterranean metropolis.” Cities 86: 220–228. doi:10.1016/j.cities.2018.09.021.
- Dovey, K., and E. Pafka. 2017. “What is functional mix? An assemblage approach.” Planning Theory and Practice 18 (2): 249–267. doi:10.1080/14649357.2017.1281996.
- Enequist, G. 1957. “Types of agglomerations and rural districts.” In Atlas över Sverige, 59–60. Stockholm: Generalstabens litografiska anstalts förlag.
- Ewing, R., M. Greenwald, M. Zhang, J. Walters, M. Feldman, R. Cervero, L. Frank, and J. Thomas. 2011. “Traffic generated by mixed-use developments – six region study using consistent built environmental measures.” Journal of Urban Planning and Development 137 (3): 248–261. doi:10.1061/(ASCE)UP.1943-5444.0000068.
- Gallagher, R., T. Sigler, and Y. Liu. 2023. “Urban “blandscapes”: How the practical implementation of planning policy reduces land Use diversity.” Urban policy and research 41 (3): 295–313. doi:10.1080/08111146.2022.2122427.
- Grant, J., P. Filion, and S. Low. 2019. “Path dependencies affecting suburban density, mix, and diversity in Halifax.” The Canadian Geographer/Le Géograph canadien 63 (2): 240–253. doi:10.1111/cag.12496.
- Guan, Q., S. Cheng, Y. Pan, Y. Yao, and W. Zeng. 2021. “Sensing mixed urban land-use patterns using municipal water consumption time series.” Annals of the American Association of Geographers 111 (1): 68–86. doi:10.1080/24694452.2020.1769463.
- Hoppenbrouwer, E., and E. Louw. 2005. “Mixed-use development: Theory and practice in Amsterdam’s Eastern docklands.” European Planning Studies 13 (7): 967–983. doi:10.1080/09654310500242048.
- Huang, J., Y. Cui, L. Li, M. Guo, H. Ho, Y. Lu, and C. Webster. 2023. “Re-examining Jane Jacobs’ doctrine using new urban data in Hong Kong.” Environment and Planning B: Urban Analytics and City Science 50 (1): 76–93. doi:10.1177/23998083221106186.
- Huszti, É, F. Albert, A. Csizmady, I. Nagy, and B. Dávid. 2021. “When spatial dimension matters: Comparing personal network characteristics in different segregated areas.” Social Inclusion 9 (4): 375–387. doi:10.17645/si.v9i4.4520.
- Jacobs, J. 1961. The death and life of great American cities. New York: Random House.
- Jacobs-Crisioni, C., P. Rietveld, E. Koomen, and E. Tranos. 2014. “Evaluating the impact of land-use density and mix on spatiotemporal urban activity patterns: An exploratory study using mobile phone data.” Environment and Planning A 46: 2769–2785. doi:10.1068/a130309p.
- Khan, F., E. Pafka, and K. Dovey. 2023. “Understanding informal functional mix: Morphogenic mapping of Old Dhaka.” Journal of Urbanism 16 (3): 267–285. doi:10.1080/17549175.2021.1979085.
- Kopáčik, G., A. Vaishar, and E. Šimara. 2021. “The dynamics of population distribution in cities based on daily mobile phone operations: A case study of some Moravian cities.” Moravian Geographical Reports 29 (1): 71–86. doi:10.2478/mgr-2021-0006.
- Koster, H., and J. Rouwendal. 2012. “The impact of mixed land use on residential property values.” Journal of Regional Science 52 (5): 733–761. doi:10.1111/j.1467-9787.2012.00776.x.
- Kretzer, G., M. Kanashiro, and R. Tibiriçá de Saboya. 2023. “Complementarity between urban land uses: A temporal analysis.” Journal of Urban Design, 1–18. doi:10.1080/13574809.2023.2280272.
- Lan, T., G. Shao, Z. Xu, L. Tanf, and L. Sun. 2021. “Measuring urban compactness based on functional characterization and human activity intensity by integrationg multiple geospatial data sources.” Ecological Indicators 121: 1–12. doi:10.1016/j.ecolind.2020.107177.
- Le Corbusier. [1957] 1973. The Athens Charter. New York: Grossman Publishers.
- Limb, M., C. Grodach, P. Donehue, and S. Mayere. 2021. “When plans are used to no effect: Considering implementation performance of greater Brisbane’s compact activity centre policies.” Environment and Planning B 47 (8): 1860–1875. doi:10.1177/2399808320951583.
- Mahtta, R., A. Mahendra, and K. Seto. 2019. “Building up or spreading out? Typologies of urban growth across 478 cities of 1 million+.” Environmental Research Letters 14 (12): 124077. doi:10.1088/1748-9326/ab59bf.
- Manaugh, K., and T. Kreider. 2013. “What is mixed use? Presenting an interaction method for measuring land use mix.” The Journal of Transport and Land Use 6 (1): 63–72. doi:10.5198/jtlu.v6i1.291.
- Mavoa, S., S. Eagleson, H. Badland, and L. Gunn. 2018. “Identifying appropriate land-use mix measures for use in a national walkability index.” The Journal of Transport and Land Use 11 (1): 681–700. doi:10.5198/jtlu.2018.1132.
- Morawska, I., K. Anielska, J. Gądecki, and Ł Afeltowicz. 2024. “Changes in urban fabric–a cause or a result of an innovation district?” Journal of Urbanism 17 (1): 89–110. doi:10.1080/17549175.2021.2005118.
- Motieyan, H., and M. Azmoodeh. 2021. “Mixed-use distribution index: A novel bilevel measure to address urban land-use mix pattern (a case study in Tehran, Iran).” Land Use Policy 109: 105724. doi:10.1016/j.landusepol.2021.105724.
- Mouratidis, K. 2019. “Compact city, urban sprawl, and subjective well-being.” Cities 92: 261–272. doi:10.1016/j.cities.2019.04.013.
- Næss, P. 2022. “Compact urban development in Norway: Spatial changes, underlying policies and travel impacts.” In Advances in transport policy and planning, edited by X. Cao, C. Ding, and J. Yang, Vol. 29, 95–133. Academic Press. doi:10.1016/bs.atpp.2021.02.003.
- Openshaw, S. 1984. “The modifiable areal unit problem.” Catmog, 38. Norwich: Geo Books.
- Park, Y., S. Huang, and G. Newman. 2016. “A statistical meta-analysis of the design components of new urbanism on housing prices.” Journal of Planning Literature 31 (4): 435–451. doi:10.1177/0885412216667898.
- Powe, M., J. Mabry, E. Talen, and D. Mahmoudi. 2016. “Jane Jacobs and the value of older, smaller buildings.” Journal of the American Planning Association 82 (2): 167–180. doi:10.1080/01944363.2015.1135072.
- Roberto, E., and E. Korver-Glenn. 2021. “The spatial structure and local experience of residential segregation.” Spatial Demography 9: 277–307. doi:10.1007/s40980-021-00086-7.
- Rowley, A. 1996. “Mixed-use development: Ambiguous concept, simplistic analysis and wishful thinking?” Planning Practice and Research 11 (1): 85–97. doi:10.1080/02697459650036477.
- Rueda Palenzuela, S., A. Santasusagna Riu, B. Cormenzana Izquierdo, J. Tort Donada, and X. Úbeda. 2022. “Understanding urban complexity via the spatial diversity of activities: An application to Barcelona (Spain).” Sustainability 22 (14): 1298. doi:10.3390/su14031298.
- Sung, H., S. Lee, and S. Cheon. 2015. “Operationalising Jane Jacobs’s urban design theory: Empirical verification from the great city of Seoul, Korea.” Journal of Planning Education and Research 35 (2): 117–130. doi:10.1177/0739456X14568021.
- Talen, E., L. Anselin, S. Lee, and J. Koschinsky. 2016. “Looking for logic: The zoning—land use mismatch.” Landscape and Urban Planning 152: 27–38. doi:10.1016/j.landurbplan.2016.04.002.
- Thunström, M. 2009. “The vital city: Constructions and meanings in the contemporary Swedish planning discourse.” Town Planning Review 78 (6): 681–698. doi:10.3828/tpr.78.6.2.
- Tiitu, M., P. Naess, and M. Ristimäki. 2021. “The urban density in two Nordic capitals–comparing the development of Oslo and Helsinki metropolitan regions.” European planning studies 29 (6): 1092–1112. doi:10.1080/09654313.2020.1817865.
- van Nes, A. 2021. “Spatial configurations and walkability potentials. Measuring urban compactness with space syntax.” Sustainability 13 (11): 5785. doi:10.3390/su13115785.
- Vikström, E. 1991. Platsen, bruket och samhället: tätortsbildning och arkitektur 1860-1970. Stockholm: Statens råd för byggforskning.
- Wandl, A., and B. Hausleitner. 2021. “Investigating functional mix in Europe’s dispersed urban areas.” Environment and Planning B Urban Analytics and City Science 48 (9): 2862–2879. doi:10.1177/2399808320987849.
- White, M. 1986. “Segregation and diversity measures in population distribution.” Population Index 52 (2): 198–221. doi:10.2307/3644339.
- Wolff, M., D. Haase, and A. Haase. 2018. “Compact or spread? A quantitative spatial model of urban areas in Europe since 1990.” PLoS One 13 (2): e0192326. doi:10.1371/journal.pone.0192326.
- Yoshimura, Y., Y. Kumakoshi, S. Milardo, P. Santi, J. Arias, H. Koizumi, and C. Ratti. 2022. “Revisiting Jane Jacobs: Quantifying urban diversity.” Environment and Planning B: Urban Analytics and City Science 49 (4): 1228–1244. doi:10.1177/23998083211050935.
- Zagow, M. 2020. “Does mixed-use development in the metropolis lead to less carbon emissions?” Urban Climate 34: 100682. doi:10.1016/j.uclim.2020.100682.
Appendix
Table A1. Activities stipulated as localized retail or consumer services.
Table A2. Activities stipulated as educational.