
Abstract
Genetic affiliation, nuclear DNA content, and gamete functioning were examined in small salt marsh Fucus from three localities in western Ireland. Individuals with small and dioecious receptacles were found at all localities, but production of germlings was only evident at Locality 1. Here, the Fucus vegetation formed a morphological cline from F. vesiculosus with bladders in the mid-intertidal to small Fucus individuals lacking bladders in the salt marsh of the upper intertidal. Measurements of nuclear DNA content ranged from 1–1.8 pg at this locality, with F. vesiculosus individuals in the lower range. At the two other localities, the small salt marsh Fucus consisted of distinct morphological entities. Microsatellite analyses revealed that individuals at Locality 2 were derived mainly from F. vesiculosus, whereas those from Locality 3 were hybrids between F. vesiculosus and F. spiralis with greatest affiliation to F. spiralis. While the small salt marsh Fucus forms from Locality 2 had high nuclear DNA content (c. 4 pg) and were probably octoploids, the small salt marsh Fucus from Locality 3 formed two groups: one with high (3.9–4.6 pg) and one with low (1.5–1.9 pg) nuclear DNA content. Nuclear DNA content measured in individuals from Locality 3 varied between 1.1–2.8 pg in F. vesiculosus and 2–3.5 pg in F. spiralis, and showed a more or less stepwise increase in both species, consistent with polyploidy. We hypothesize that the small salt marsh Fucus forms originate from genome size changes in the parental taxa.
Introduction
The brown macroalgal genus Fucus is remarkably adaptive and consequently has evolved into several species in the North Atlantic since the migration of ancestral forms from the North Pacific across the Bering Strait (Cánovas et al., Citation2011). Two main lineages are apparent within the genus, one consisting of F. distichus L. and F. serratus L. and the other one comprising several species including F. spiralis L. and F. vesiculosus L., all of which are widespread on shores of the North Atlantic (Cánovas et al., Citation2011). Fucus vesiculosus and F. spiralis are closely related and frequently hybridize (Engel et al., Citation2005) and two new European species within the F. vesiculosus–F. spiralis lineage have been recognized: F. radicans L.Bergstrøm & L.Kautsky from the Baltic Sea (Bergström et al., Citation2005) and F. guiryi G.I.Zardi, K.R.Nicastro, E.S.Serrão & G.A.Pearson, distributed from Ireland and Britain to the Canary Islands (Zardi et al., Citation2011). Fucus radicans has evolved in sympatry with F. vesiculosus after the Last Glacial Maximum in Europe (Pereyra et al., Citation2009), whereas F. guiryi (F. spiralis-south in Coyer et al., Citation2011) is a sister species of F. spiralis (Cánovas et al., Citation2011).
A miniaturized Fucus form without holdfasts occurring only in high intertidal salt marshes has been described as F. cottonii M.C.Wynne & Magne (Wynne & Magne, Citation1991). Another small Fucus species, F. chalonii Feldmann, has similarities with F. cottonii but is not associated with salt marsh habitats and only occurs in a few localities on rocky shores in northern Spain (Feldmann, Citation1941). The small (1–5 cm tall) F. chalonii is distinguished from the small salt marsh forms by always being attached and by forming verrucose receptacles.
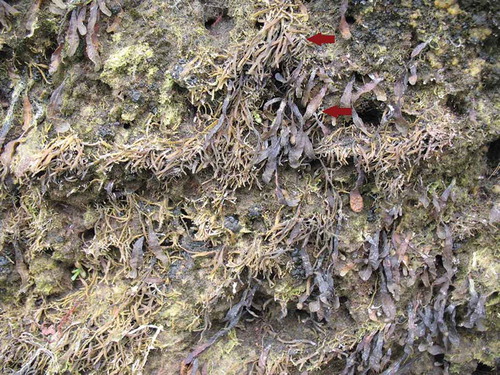
The small salt marsh form of F. cottonii, however, does not represent one genetic entity. Molecular studies have demonstrated that it can be a hybrid between F. vesiculosus and F. spiralis in the USA and Iceland (Wallace et al., Citation2004, Coyer et al., Citation2006), and either a polyploid form of F. vesiculosus (Coyer et al., Citation2006) or derived from F. spiralis (Neiva et al., Citation2012) in Ireland. Miniaturized salt marsh forms have also been observed in F. distichus from the F. distichus–F. serratus lineage, suggesting that small salt marsh fucoids represent convergent growth forms (Neiva et al., Citation2012). However, while growth and morphology of small salt marsh F. cottonii was shown to vary with tidal level in a transplant study in a salt marsh locality in Maine, USA (Mathieson et al., Citation2006), high stress does not fully explain the habit of these small salt marsh fucoids. For example, Fucus individuals with normal morphology are often found growing side by side with the miniaturized forms (), and the latter retain their miniaturized morphology when incubated for several weeks in culture with normal salt water (K. Sjøtun, pers. obs.).
Fig. 1. Co-occurring morphological forms. Individuals of small salt marsh Fucus with narrow thalli adjacent to F. spiralis with broader thalli and receptacles (examples shown by arrows) at Locality 3 (Achill Sound) in June 2014.
A characteristic feature of small salt marsh F. cottonii (hereafter abbreviated ssmF) is their vegetative reproduction, by which side branches eventually form new, but genetically identical individuals (Cotton, Citation1912). However, ssmF from Ireland occasionally develop receptacles, and the original description of F. cottonii (as F. vesiculosus var. muscoides Cotton) included individuals with small and dioecious receptacles (Cotton, Citation1912). On the other hand, receptacles have not been observed in ssmF in France (Wynne & Magne, Citation1991), the USA (Mathieson et al., Citation2006) or in Norway (K. Sjøtun, pers. obs.).
The findings of Coyer et al. (Citation2006) and Neiva et al. (Citation2012) that the ssmF forms can have multiple independent origins suggest some common processes leading to a miniaturized growth form. Coyer et al. (Citation2006) showed that ssmF could display at least partial genome duplication, suggesting that processes involved in genome size changes can be an underlying cause of miniaturization of Fucus. To address this possibility, we collected ssmF forms from three sites in western Ireland including Achill Sound, which is close to the type locality of F. cottonii. Microsatellite analysis was combined with analysis of nuclear DNA content (from DAPI analysis of nuclear DNA) and tests of gamete functionality.
Materials and methods
Sampling sites and collections
Small salt marsh forms of Fucus were collected from three localities on the western coast of Ireland () in June 2012 and June 2014. Locality 1 is situated in an enclosed estuary north-west of Galway (Illaunnginga, 53°23′02N, 09°33′50W) and Locality 2 is in the bay outside Clifden (53°29′04N, 10°01′49W). At Locality 3, most individuals were collected on the shore below Achill Sound village (53°55′53.22′′N, 09°56′48.44′′W), with additional specimens collected at a similar site around 2.5 km further south within Achill Sound (53°54′36.23′′N, 09°57′26.87′′W).
Fig. 2. Sample localities in Ireland. Fucus spp. were sampled during 2012 and 2014 at Locality 1 (Illaunnginga), Locality 2 (Clifden) and Locality 3 (Achill Sound).
At Locality 1 (Illaunnginga), the Fucus vegetation consisted of F. vesiculosus attached to rock in the lower zone, gradually transforming into small salt marsh-like individuals in mud and turf substrata of the middle and upper zones. In the middle zone, Fucus individuals possessed small and evesiculate thalli (up to about 10 cm) with rounded receptacles (), whereas in the upper zone, the individuals decreased further in size and all were vegetative. At both Locality 2 (Clifden) and Locality 3 (Achill Sound), the Fucus vegetation consisted of F. vesiculosus, F. spiralis and ssmF, with ssmF growing in the upper part of the Fucus zone at both localities. Some ssmF individuals bearing receptacles were found at both Localities 2 and 3 (, ), but less abundantly than at Locality 1. Fucus spiralis formed a broad band above F. vesiculosus at Locality 3, but was less abundant at Locality 2. Individuals of all taxa were collected haphazardly but normally separated by at least one metre. An overview of sampling dates, collection data and numbers of individuals analysed is given in . The sampled material was transported back to the laboratory in a cool bag.
Table 1. Sampling specifics. Dates of field sampling, taxa sampled and numbers of individuals per taxon examined or processed are presented for: Fucus spiralis (Fs), F. vesiculosus (Fv) and small salt marsh Fucus (ssmF).
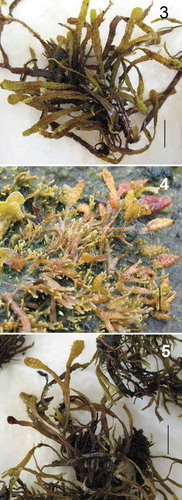
Figs 3–5. Small salt marsh Fucus with receptacles from: Fig. 3. Locality 1 (Illaunnginga), Fig. 4. Locality 2 (Clifden) and Fig. 5. Locality 3 (Achill Sound). Scale bar is 1 cm.
Gamete functionality test
Individuals of ssmF bearing receptacles were collected at all three localities during June 2012, and receptacles from 11–27 individuals per site were examined, i.e. one receptacle per individual (). A microscope was used for the examination of ssmF individuals and receptacles. Separate receptacles with male and female gametes were found at Localities 1 and 3, and a test of gamete functionality was conducted with material from these localities. For each locality, three receptacles of each sex that appeared to be mature were dried at air temperature for 2.5 hours to initiate gamete release. Thereafter, pairs of male and female receptacles were added to small beakers with sterile unenriched seawater, incubated in a culture chamber (SanyoMLR-351, Sanyo Electric Co., Osaka, Japan) at 10°C with a photon fluence rate of 20–50 μmol photons m–2 s–1 (18:6 h light:dark), and examined for released eggs or developing germlings after 1, 4 and 6 days.
Microsatellite analyses
In order to determine the genetic origins of ssmF, samples of F. vesiculosus (all localities), F. spiralis (Localities 2 and 3) and ssmF (all localities) were collected for microsatellite analyses in June 2012. After returning to the laboratory, one clean (no epiphytes) branch tip per individual was excised and dried in silica gel crystals. Tissue from 10–29 individuals per taxon per locality was collected (). Individuals other than those examined for gamete functionality were selected for microsatellite analyses to ensure extraction of high quality DNA. Vouchers of 10–20 ssmF were preserved from each locality (photos of pressed voucher specimens are added as Supplementary figs S, S, S3–1, S3–2). DNA was extracted from 8–16 individuals per taxon per locality using a modification of the CTAB method (Coyer et al., Citation2009) and purified with Zymo One-Step-96 PCRTM Inhibitor Removal Kit (Zymo Research) following the manufacturer’s protocol. 8–16 individuals of each taxon per locality () were genotyped using four microsatellite loci (L20, L38, L58 and L94) and the protocols by Engel et al. (Citation2003). Due to methodological problems, no individuals from Locality 1 were successfully amplified, thus this locality was not included in the microsatellite analyses. Genotypes were visualized on an ABI 3730 gene analyser (Applied Biosystems) and analysed using GENOTYPER (Applied Biosystems) software.
Genetic diversity measured as Nei’s non-biased Hexp (Nei, Citation1978) and estimators of FIS and FST (Wright, Citation1969) (as f and θ; Weir & Cockerham, Citation1984) were calculated using GENETIX 4.02 (Belkhir et al., Citation2001). Standardized allelic richness was determined for each population with GENCLONE 2.0 (http://wwz.ifremer.fr/clonix/Logiciels/GenClone-2.0).
Clustering of microsatellite genotypes used STRUCTURE (Pritchard et al., Citation2000) through the Lifeportal computing service at the University of Oslo. STRUCTURE uses a Bayesian algorithm to identify clusters or groups of genetically homogeneous individuals (K), and has been used to study hybridization in Fucus (e.g. Engel et al., Citation2005, Coyer et al., Citation2006). Analyses were run with K = 1–6, and each run was replicated 10 times to ensure proper convergence of the MCMC with the parameters: ancestry model = admixture (to account for recent divergence and shared ancestral polymorphisms); frequency model = independent; burn-in = 1 000 000; MCMC length = 2 000 000 after burn-in. Since ssmF show vegetative reproduction and potentially form clones and F. spiralis has a high degree of selfing (Engel et al., Citation2005), clustering of the microsatellite genotypes was also examined with INSTRUCT (Gao et al., Citation2007), which eliminates the assumption of Hardy–Weinberg equilibrium within clusters and calculates expected genotype frequencies on the basis of inbreeding or selfing rates. In both cases the most likely K value was inferred from the rate of change in estimated Ln probability of data between successive K values (delta K) (Evanno et al., Citation2005), using STRUCTURE HARVESTER web version 0.6.94 (Earl & vonHoldt, Citation2012) and CLUMPAK beta version (Kopelman et al., Citation2015). The results were visualized with DISTRUCT 1.1 (Rosenberg, Citation2004). The genetic affinities of ssmF from Localities 2 and 3 were further analysed with principal component analysis (PCA) in R 3.2.5 using the R package ADEGENET (Jombart, Citation2008). Genotype spreading was very wide in F. vesiculosus from Locality 3, and two extreme outliers were removed before the final PCA. Multivariate statistical methods such as PCA are free from assumptions of underlying population genetic models and represent an independent method of measuring population differentiation (Jombart et al., Citation2010).
Nuclear DNA content analyses
To detect variation in genome size and possible polyploidy in the ssmF individuals, nuclear DNA content was estimated with microspectrofluorometry analyses of DAPI stained tissue. Individuals of ssmF collected at all three localities in June 2014 were included, but F. vesiculosus and F. spiralis were only collected from Localities 1 and 3, and Locality 3, respectively (), since we initially did not expect a large variation in nuclear DNA content of these species on a small spatial scale (Gómez Garreta et al., Citation2010). A small tissue section was excised from each individual and fixed in Carnoy’s solution (3:1 100% ethanol:glacial acetic acid, mixed just before use) for 24 h, then stored in 70% ethanol at 4°C. Fixation in Carnoy’s solution prevents staining inhibition due to phlorotannins. Nuclear DNA content was estimated by image analysis using METAMORPH software (Molecular Devices, Toronto, Ontario, Canada) and comparing the If (Intensity of fluorescence) of Fucus nuclei with those of chicken erythrocytes, which have a DNA content of 2.4 pg (Clowes et al., Citation1983). Analyses of nuclear DNA content were carried out using an AxioCam HRm Zeiss digital camera on an Axioplan Zeiss fluorescence microscope (see Gómez Garreta et al., Citation2010). Estimates of nuclear contents were obtained from 3–7 ssmF from each locality (). Additionally, nuclear contents were estimated for three F. vesiculosus individuals from Localities 1 and 3, and five F. spiralis individuals from Locality 3. Mean nuclear DNA contents per individual were based on 68–247 nuclei ().
Table 2. Calculated FIS, Hexp and allelic richness (Å) for n individuals from populations of Fucus spiralis (Fs), F. vesiculosus (Fv) and small salt marsh Fucus (ssmF) from Locality 2 (Clifden) and Locality 3 (Achill Sound).
Table 3. Pairwise FST values comparing populations of Fucus spiralis (Fs), F. vesiculosus (Fv) and small salt marsh Fucus (ssmF) from Locality 2 (Clifden) and Locality 3 (Achill Sound).
Table 4. Overview of results from estimated nuclear DNA content from Localities (Loc.) 1 (Illaunnginga), 2 (Clifden) and 3 (Achill sound) of small salt marsh Fucus (ssmF), F. vesiculosus (Fv) and F. spiralis (Fs).
Results
Gamete functionality test
Since Fucus species can be dioecious (male antheridia and female oogonia on separate individuals, e.g. F. vesiculosus) or hermaphroditic (male antheridia and female oogonia within a single receptacle, e.g. F. spiralis), ssmF receptacles were examined in order to sex the individuals. Only female receptacles (n = 11) were found at Locality 2 (), while eight female and six male receptacles were found at Locality 1 (, ), and 11 female and six male receptacles at Locality 3 (, ). The male receptacles from Locality 3 had relatively few conceptacles. No hermaphroditic receptacles of the ssmF individuals were found, except for four of 25 receptacles from Locality 3, which had oogonia and structures that may have been immature antheridia. A few sterile receptacles were found at both Localities 2 and 3. Receptacles of ssmF from Locality 1 were normal in appearance with viable and functioning gametes, and after 6 days numerous normal-looking germlings were observed in the incubated beakers (Fig. 8). The ssmF individuals from Locality 1 differed further from those of the other localities by having a more conspicuous mid-rib (). Only a few oogonia with division lines were observed in receptacles from Localities 2 and 3, and oogonia from these localities frequently were abnormal with cell contents concentrated in the middle (Figs 9, 10). None of the incubations from Locality 3 produced germlings.
Microsatellite analyses
The microsatellite analyses gave results for 5–6 individuals of each taxon from Locality 2, and for 6–15 individuals per taxon from Locality 3. Significant FIS values were found for all three taxa from Locality 3 and for F. spiralis from Locality 2, which suggests more inbreeding in these populations than in the others (). A relatively high expected heterozygosity (Hexp=0.813) was found for F. vesiculosus at Locality 3 (), probably reflecting the larger sampling area. Pairwise FST comparisons revealed an overall greater genetic distance among populations at Locality 3 than among those at Locality 2, except for the comparison between F. spiralis and F. vesiculosus, which showed a lower FST value at Locality 3 than at Locality 2 (). Fucus spiralis showed the highest inbreeding coefficients (FIS) at Localities 2 and 3. At Locality 3 also ssmF and F. vesiculosus had significant inbreeding coefficients (). The microsatellite analyses did not reveal clones of ssmF. Allelic richness for F. vesiculosus was higher than for ssmF and F. spiralis at Locality 3, while at Locality 2 F. vesiculosus and ssmF had similar and higher allelic richness than F. spiralis (). Information about allele proportions is included in Supplementary table S4.
According to the delta K plots from the STRUCTURE and INSTRUCT analyses, the most likely distribution of the microsatellite genotypes at Localities 2 and 3 (not available for Locality 1) was K = 2, followed by K = 3. The two clusters obtained by K = 2 corresponded largely to the individuals sampled as F. spiralis and F. vesiculosus. Genotyped ssmF individuals from Locality 2 showed highest similarity to F. vesiculosus as shown by both STRUCTURE and INSTRUCT (). Genotyped ssmF individuals from Locality 3 showed admixture between F. vesiculosus and F. spiralis according to the STRUCTURE results, but were similar to F. spiralis according to the INSTRUCT results ().
Figs 6–11. Conceptacle structure and germling growth. Fig. 6. Mature oogonium containing egg cells ready to be released; Figs 7-8. Antheridia (Fig. 7) and germlings (Fig. 8) after 6 days in culture from Locality 1 (Illaunnginga) (possible damage to the attachment rhizoids due to transfer to microscope slide). Fig. 9. Immature oogonia from Locality 2 (Clifden). Fig. 10. Immature oogonia. Fig. 11. Antheridia both from Locality 3 (Achill Sound). Scale bar is 50 μm.
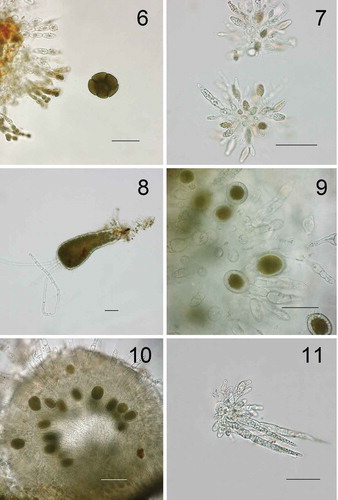
Fig. 12. Results from STRUCTURE (A) and INSTRUCT (B) analyses with K = 2; and from INSTRUCT analysis with K = 3 (C). Localities 2 and 3 consist of individuals sampled as Fucus spiralis (Fs), F. vesiculosus (Fv) and small salt marsh Fucus (ssmF). Each individual is represented by a bar and colours represent the proportional assignment to the STRUCTURE/INSTRUCT groups.
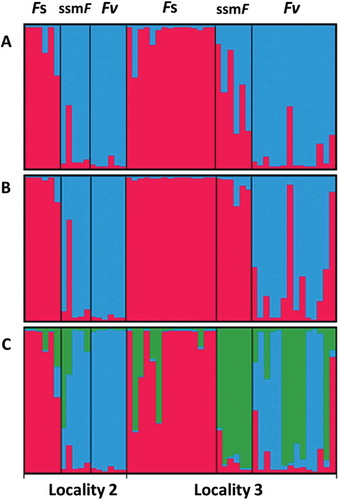
With K = 3, the STRUCTURE and INSTRUCT analyses showed identical patterns (only the result of the INSTRUCT analysis is shown in ). In this case, the ssmF from Locality 3 formed a separate group, but shared this haplotype combination with some F. spiralis and F. vesiculosus individuals from the same locality. At Locality 2 the analyses indicated some admixture with F. spiralis in some of the ssmF individuals.
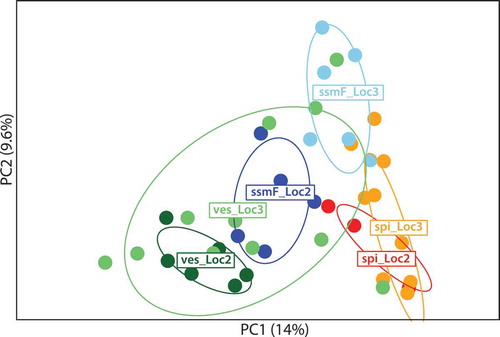
The results of the PCA analysis largely confirmed the results from the STRUCTURE and INSTRUCT analyses (), except that the ssmF individuals clustered in a more intermediate position relative to F. spiralis and F. vesiculosus at both localities. The high genetic diversity of F. vesiculosus from Locality 3 was also evident in the PCA, with these individuals spread throughout the plot, overlapping totally with individuals of F. vesiculosus and ssmF from Locality 2, and partly with ssmF from Locality 3.
Fig. 13. The two first principal components (PC) of a Principal Component Analysis showing genetic affiliation of haplotype composition of ssmF (blue), F. vesiculosus (ves) (green) and F. spiralis (spi) (orange-red) from Locality 2 (Loc2) and Locality 3 (Loc3). The circles represent 95% inertia ellipses for the populations, which characterizes the dispersion of each population around its centre of gravity. Percentages along axes indicate the proportion of overall variability explained by the principal components.
Nuclear DNA content analyses
Nuclear DNA content was reported as C-value units (), with C representing the estimated weight (pg) of the nuclear DNA content of non-replicated gametes. Very few direct C values (from sperm) were obtained from the examined individuals, and none from the receptacle-bearing ssmF (). Members of Fucus are characterized by a diplontic life cycle with diploid 2C nuclei in non-replicated vegetative cells (G1-phase) and 4C in replicated cells (G2-phase) (Gómez Garreta et al., Citation2010). Most recordings of nuclear DNA content were 2C- or 4C-values (). The 2C-values of three ssmF individuals from Locality 1 ranged from 1 to 1.8 pg, whereas the values of the three individuals from Locality 2 ranged from 4 to 4.3 pg (). The ssmF individuals from Locality 3 formed two groups, with three individuals in the lower (1.5–1.9 pg) and four individuals in the upper (3.9–4.6 pg) range (). The three F. vesiculosus individuals from Locality 1 had an overall lower but overlapping range of nuclear DNA content with the ssmF individuals from the same locality (). At Locality 3, the three F. vesiculosus individuals showed a variable nuclear DNA content, ranging from 1.1 to 2.8 pg. The F. spiralis individuals from Locality 3 had 2C estimates of 2–3.5 pg (with four out of the five estimates between 3 and 3.5 pg). Unfortunately, we have no analyses of nuclear DNA content for F. vesiculosus and F. spiralis from Locality 2.
Fig. 14. Average nuclear DNA content (2C; pg) in Fucus vesiculosus (Fv, black circles), F. spiralis (Fs, grey circles) and small salt marsh Fucus (ssmF, white circles). Data from Illaunnginga (Locality 1), Clifden (Locality 2) and Achill Sound (Locality 3) are shown, together with unpublished data from Norway (**) and earlier published data (*) from Spain (Gómez Garreta et al., Citation2010), USA (Kapraun, Citation2005) and France (Phillips et al., Citation2011, recalculation from Peters et al., Citation2004).
Discussion
The ssmF showed surprisingly high variation between the three localities in western Ireland with respect to reproduction mode, genetic affiliation and nuclear DNA content. Previous studies have indicated that ssmF can originate from different Fucus taxa, even between localities in Ireland (Coyer et al., Citation2006; Neiva et al., Citation2012). This is supported by our microsatellite results, which showed that ssmF from Locality 2 were derived mainly from F. vesiculosus, whereas the ssmF individuals from Locality 3 revealed a higher degree of hybridization or introgression, but with greatest affiliation to F. spiralis. The fact that ssmF had a significant inbreeding coefficient at Locality 3 but not at Locality 2 also suggests a connection of ssmF to F. spiralis at Locality 3, since a high degree of inbreeding is found in F. spiralis. At Locality 3 the sampling was done at two sites about 2.5 km apart, but the microsatellite clustering did not reveal genetic separation between the sites.
Only ssmF from Locality 1 displayed successful sexual reproduction as shown by a test of gamete functionality. Unfortunately, no individuals from Locality 1 were included in the microsatellite analyses (due to unsuccessful amplification). However, since the Fucus vegetation formed a cline from F. vesiculosus-like individuals in the lower intertidal to ssmF-like and dioecious individuals in the upper intertidal, and no F. spiralis were observed at or in the vicinity of Locality 1, we assume that ssmF at Locality 1 were derived from F. vesiculosus. Both F. vesiculosus and ssmF from Locality 1 had mature receptacles during June, and are likely to be interfertile.
Coyer et al. (Citation2006) examined ssmF from one locality in Ireland and showed that ssmF were polyploids derived from F. vesiculosus. To investigate this further, we estimated the nuclear DNA contents of ssmF, F. vesiculosus and F. spiralis. Generally, we found both much higher estimates of, and variability in, nuclear DNA content than has previously been measured for these Fucus taxa, even within a single locality (). Previously published estimates of nuclear DNA content (2C) of F. vesiculosus from different geographical areas (Norway, Spain, USA and France; ) varied between 1 and 2.3 pg (Kapraun, Citation2005; Gómez Garreta et al., Citation2010; Phillips et al., Citation2011). We obtained estimates between 1 and 2.8 pg for this taxon from two localities less than 100 km apart. The highest nuclear DNA content (up to 4.6 pg) was found in a group of ssmF individuals from Locality 3. Variable genome sizes have been reported for some brown algae (Kapraun, Citation2005; Gómez Garreta et al., Citation2010; Phillips et al., Citation2011), but little is known about the mechanisms causing such variation.
Variation in genome size has long been studied in land plants, and several mechanisms have been demonstrated (Šmarda & Bureš, Citation2010; Leitch & Leitch, Citation2013). Even though it is likely that processes influencing genome size are different in land plants compared with brown algae, which are evolutionarily distant from Archaeplastida (Yoon et al., Citation2004), there are probably also similarities. For example, a commonly occurring process in land plants is polyploidy, a rapid and dramatic doubling of the genome size sometimes from one generation to the next (Bennetzen et al., Citation2005), which can, if repeated, result in a range of ploidy levels. Newly evolved polyploids are expected to increase the genome size in direct proportion with ploidy. However, many polyploids also show a reduction over time in DNA content relative to diploids as a result of genome downsizing through various processes (Leitch & Bennett, Citation2004; Leitch & Leitch, Citation2013).
Autopolyploids arise within or among populations of a single species by the doubling of homologous chromosome sets. Allopolyploids, on the other hand, combine two or more genomes from different species as a result of interspecific hybridization. In nature, both autopolyploids and allopolyploids often result from the formation of unreduced gametes (Tayalé & Parisod, Citation2013; De Strome & Mason, Citation2014) and usually through a triploid intermediate formed by the union of unreduced and reduced gametes. The triploid may in turn produce tetraploids either through selfing, or by crossing with other triploids or diploids. Triploids may produce viable gametes of varying ploidy (n = x, 2x, 3x), leading to individuals with variable genome sizes (Mason & Pires, Citation2015). Diploids and tetraploids in a population may further cross and form triploids, which in turn may produce viable gametes (Birchler, Citation2012). As more and more population-scale studies on genome size variation are published, it is clear that odd-numbered ploidies exist within species and populations, suggesting that successful intercytotype crossings may be more widespread than previously thought (Husband et al., Citation2013).
Production of unreduced gametes in land plants occurs more frequently under environmental stress such as low and fluctuating temperatures, water stress and disease (Tayalé & Parisod, Citation2013; De Strome & Mason, Citation2014). The estuarine conditions of the localities in the present study provide similar stressful habitats with regard to salinity and temperature variation in the intertidal, which consequently may favour formation of unreduced gametes and further facilitate polyploidization. Polyploidization, followed by repeated crossings between individuals with different ploidy levels, may explain the variable genome sizes observed in Fucus at Locality 3. The lowest 2C value found in F. vesiculosus is 1 pg (Kapraun, Citation2005; this study). Under the assumption that this value represents a diploid genome size, the more or less stepwise increase in genome size suggests that tetraploids and hexaploids were found at Locality 3. If the diploid genome size of F. spiralis is c. 1.5 pg (as reported from Spain, ), most of the F. spiralis from Locality 3 could be considered tetraploids with genome sizes around 3 pg. However, with the small number of analysed individuals and the relatively high variation in nuclear DNA estimates, we cannot exclude the possibility that a smaller diploid genome size exists for F. spiralis at Locality 3 (e.g. 1 pg). In this case the individual at Locality 3 with a genome size of c. 2 pg may be a tetraploid, and those with higher ploidy could be hexaploids.
Assuming polyploid origins, the ssmF individuals at Locality 2 with large genome sizes (c. 4 pg) can be considered octoploids that have originated mainly from F. vesiculosus. The ssmF individuals at Locality 3, however, can be separated into two groups, one with genome sizes ≥ 4 pg (which can be interpreted as hexa- or octoploid), and the other with genome sizes of 1.5–2 pg. No sexual recruitment was observed for ssmF from Locality 3, suggesting that both groups originated from the reproducing Fucus populations at the site. Microsatellite analyses showed that ssmF from Locality 3 most likely were hybrids and/or introgressed F. spiralis. Fucus vesiculosus and F. spiralis are closely related and may easily hybridize, but a ‘normal’ F1 hybrid has an intermediate morphology between the two species (Burrows & Lodge, Citation1951). We propose that different ploidies and inter- or intraploidy crossings between individuals of F. vesiculosus and F. spiralis may be responsible for the varying ploidy, deviating morphology, and loss of function among ssmF from Localities 2 and 3.
The ssmF at Locality 1 seem to represent a special case, since they had functional gametes and sexual reproduction. They also deviated morphologically from the ssmF at Localities 2 and 3 by having a more conspicuous mid-rib. Compared to estimates from the other localities, the genome size estimates from Locality 1 were at the lower end of the range. However, ssmF here also had the highest genome sizes, though overlapping with those of F. vesiculosus. The processes leading to variable genome sizes at Locality 1 are unknown, but are probably due to processes other than polyploidization (e.g. Piegu et al., Citation2006).
It is not clear what causes the miniaturization of ssmF that was observed at all three localities, but it seems to be unrelated to genetic affiliation or genome size per se (see also Wallace et al., Citation2004; Coyer et al., Citation2006; Neiva et al., Citation2012). We hypothesize that occurrence of ssmF is connected to processes causing variable genome sizes in Fucus populations, and that formation of ssmF occurs most frequently at localities where one or more members of Fucus have an unstable genome. Our hypothesis may explain why ssmF are not present in all salt marshes with apparently suitable habitat. For example, Sheehy Skeffington & Curtis (Citation2000) found that the distribution of ssmF was limited to the west coast of Ireland, and connected to high precipitation and low salinity in the local salt marshes. A stressful environment may cause genome size instability and variation in plants in various ways (e.g. Mirouze & Paszkowski, Citation2011; De Strome & Mason, Citation2014), and estuaries with very low or strongly variable salinity may in a similar way represent stressful biotopes for fucoids, resulting in genome size variations.
Furthermore, in plants it has been demonstrated that high variation in genome size, as a result of polyploidization and subsequent genome downsizing, or activation of epigenetics and transposable elements, can influence gene functioning and expression, through chromosome rearrangements and epigenetic mobilizations (Song & Chen, Citation2015). Interestingly, a recent study of speciation in angiosperms showed that high rates of phenotypic changes and speciation are positively and strongly correlated with genome size changes, but not with absolute genome size (Puttick et al., Citation2015). Processes that change genome sizes, therefore, may influence both growth and functioning of organisms. Here, variation in genome size could have resulted in malfunction of genes necessary for normal development of antheridia (male gametangia) in ssmF from Locality 2.
Our study shows that members of the genus Fucus display a surprisingly large variation in genome size, even within populations. Although processes regulating speciation in angiosperms and brown algae may be quite different, it is possible that the high genome size variation observed in Fucus may partially explain the observed high capacity for morphological plasticity. While we cannot determine the underlying processes causing the patterns reported in the present study, our results clearly show that these processes need to be investigated further in Fucus. The genus, therefore, may be an excellent model for testing the connection between variable genome sizes, population adaptation to different environmental conditions, and speciation.
Supplementary information
The following supplementary material is accessible via the Supplementary Content tab on the article’s online page at http://dx.doi.org/10.1080/09670262.2017.1309688
Supplementary fig. S1. Voucher specimens (6 of 10 pressed) of ssmF from Locality 1 Illaunnginga, collected 14 June 2012.
Supplementary fig. S2. Voucher specimens of ssmF from Locality 2 (Clifden), collected 14 June 2012.
Supplementary fig. S3–1. Voucher specimens of ssmF from Locality 3 (Achill Sound, by Achill Sound village), collected 18 June 2012.
Supplementary fig. S3-2. Voucher specimens of ssmF from Locality 3 (Achill Sound, about 2.5 km south of Achill Sound village), collected 18 June 2012.
Supplementary table S4. Proportions of alleles of the four microsatellite loci, L20, L38, L58 and L94.
Supp_material.zip
Download Zip (3.7 MB)Acknowledgements
We thank Sarah Helyar and Steinunn Magnúsdottir at MATIS, Iceland, for all their help with microsatellite analyses, Kerstin Johannessen, Richardo Pereyra, Mike Guiry, Ester Serrão and an anonymous reviewer for helpful comments on the manuscript, and Ilia J. Leitch for information about processes of genome size variation in land plants.
Disclosure statement
No potential conflict of interest was reported by the authors.
Additional information
Funding
Notes on contributors
Kjersti Sjøtun
K. Sjøtun: original concept, field and laboratory work, drafting and editing manuscript; S. Heesch: field work, interpretation and editing manuscript; J. Rull Lluch, R. Martin Martin, A Gomez Garreta: analysis of DNA content and interpreting of results; A.K. Brysting: interpreting results and editing manuscript; J.A. Coyer: microsatellite analysis, interpreting the results and editing the manuscript.
Svenja Heesch
K. Sjøtun: original concept, field and laboratory work, drafting and editing manuscript; S. Heesch: field work, interpretation and editing manuscript; J. Rull Lluch, R. Martin Martin, A Gomez Garreta: analysis of DNA content and interpreting of results; A.K. Brysting: interpreting results and editing manuscript; J.A. Coyer: microsatellite analysis, interpreting the results and editing the manuscript.
Jordi Rull Lluch
K. Sjøtun: original concept, field and laboratory work, drafting and editing manuscript; S. Heesch: field work, interpretation and editing manuscript; J. Rull Lluch, R. Martin Martin, A Gomez Garreta: analysis of DNA content and interpreting of results; A.K. Brysting: interpreting results and editing manuscript; J.A. Coyer: microsatellite analysis, interpreting the results and editing the manuscript.
Rafael Martín Martín
K. Sjøtun: original concept, field and laboratory work, drafting and editing manuscript; S. Heesch: field work, interpretation and editing manuscript; J. Rull Lluch, R. Martin Martin, A Gomez Garreta: analysis of DNA content and interpreting of results; A.K. Brysting: interpreting results and editing manuscript; J.A. Coyer: microsatellite analysis, interpreting the results and editing the manuscript.
Amelia Gómez Garreta
K. Sjøtun: original concept, field and laboratory work, drafting and editing manuscript; S. Heesch: field work, interpretation and editing manuscript; J. Rull Lluch, R. Martin Martin, A Gomez Garreta: analysis of DNA content and interpreting of results; A.K. Brysting: interpreting results and editing manuscript; J.A. Coyer: microsatellite analysis, interpreting the results and editing the manuscript.
Anne K. Brysting
K. Sjøtun: original concept, field and laboratory work, drafting and editing manuscript; S. Heesch: field work, interpretation and editing manuscript; J. Rull Lluch, R. Martin Martin, A Gomez Garreta: analysis of DNA content and interpreting of results; A.K. Brysting: interpreting results and editing manuscript; J.A. Coyer: microsatellite analysis, interpreting the results and editing the manuscript.
James A. Coyer
K. Sjøtun: original concept, field and laboratory work, drafting and editing manuscript; S. Heesch: field work, interpretation and editing manuscript; J. Rull Lluch, R. Martin Martin, A Gomez Garreta: analysis of DNA content and interpreting of results; A.K. Brysting: interpreting results and editing manuscript; J.A. Coyer: microsatellite analysis, interpreting the results and editing the manuscript.
Related Research Data
References
- Belkhir, K., Borsa, P., Goudet, J., Chikhi, L. & Bonhomme, F. (2001). GENETIX 4.02, logiciel sous Windows TM pour la génétique des populations. Laboratoire Génome, Populations, Interactions: CNRS UMR 5000, Université de Montpellier II, Montpellier.
- Bennetzen, J.L., Jianxin, M.A. & Devos, K.M. (2005). Mechanisms of recent genome size variation in flowering plants. Annals of Botany, 95: 127–132.
- Bergström, L., Tatarenkov, A., Johannesson, K., Jönsson, R.B. & Kautsky, L. (2005). Genetic and morphological identification of Fucus radicans sp. nov. (Fucales, Phaeophyceae). Journal of Phycology, 41: 900–905.
- Birchler, J.A. (2012). Genetic consequences of polyploidy in plants. In Polyploidy and Genome Evolution (Soltis, P.S. & Soltis, D.E., editors), 21–32. Springer-Verlag, Berlin-Heidelberg.
- Burrows, E.M. & Lodge, S. (1951). Autecology and the species problem in Fucus. Journal of the Marine Biological Association of the United Kingdom, 30: 161–176.
- Cánovas, F.G., Mota, C.F., Serrão, E.A. & Pearson, G.A. (2011). Driving south: a multi-gene phylogeny of the brown algal family Fucaceae reveals relationships and recent drivers of a marine radiation. BMC Evolutionary Biology, 11: 371.
- Clowes, A.W., Reidy, M.A. & Clowes, M.M. (1983). Kinetics of cellular proliferation after arterial injury. I. Smooth muscle growth in absence of endothelium. Laboratory Investigation, 49: 327–333.
- Cotton, A.D. (1912). Marine algae. In A Biological Survey of Clare Island in the County of Mayo, Ireland and of the Adjoining District (Praeger, R. L. editor), 1–178. Ireland: Hodges, Figgis and Co., Ltd. Sections 1–3, part 15, vol.31.
- Coyer, J.A., Hoarau, G., Pearson, G.A., Serrão, E.A., Stam, W.T. & Olsen, J.L. (2006). Convergent adaptation to a marginal habitat by homoploid hybrids and polyploid ecads in the seaweed genus Fucus. Biology Letters, 2: 405–408.
- Coyer, J.A., Hoarau, G., Beszerti, B., Pearson, G. & Olsen, J.L. (2009). Expressed sequence tag derived polymorphic SSR markers for Fucus serratus and amplification in other species of Fucus. Molecular Ecology Resources, 9: 168–170.
- Coyer, J.A., Hoarau, G., Costa, J.F., Hogerdijk, B., Serrão, E.A., Billard, E., Valero, M., Pearson, G. & Olsen, J.L. (2011). Evolution and diversification within the intertidal brown macroalgae Fucus spiralis/F. vesiculosus species complex in the North Atlantic. Molecular Phylogenetics and Evolution, 58: 283–296.
- De Strome, N. & Mason, A. (2014). Plant speciation through chromosome instability and ploidy change: cellular mechanisms, molecular factors and evolutionary relevance. Current Plant Biology, 1: 10–33.
- Earl, D.A. & vonHoldt, B.M. (2012). STRUCTURE HARVESTER: a website and program for visualizing STRUCTURE output and implementing the Evanno method. Conservation Genetics Resources, 4: 359–361.
- Engel, C.R., Brawley, S., Edwards, K.J. & Serrão, E. (2003). Isolation and cross-species amplification of microsatellite loci from the fucoid seaweeds Fucus vesiculosus, F. serratus, and Ascophyllum nodosum (Heterokontophyta, Fucaceae). Molecular Ecology Notes, 3: 180–182.
- Engel, C.R., Daguin, C. & Serrão, E. (2005). Genetic entities and mating system in hermaphroditic Fucus spiralis and its close dioecious relative F. vesiculosus (Fucaceae, Phaeophyceae). Molecular Ecology, 14: 2033–2046.
- Evanno, G., Regnaut, S. & Goudet, J. (2005). Detecting the number of clusters of individuals using the software STRUCTURE: a simulation study. Molecular Ecology, 14: 2611–2620.
- Feldmann, J. (1941). Sur une nouvelle espèce de Fucus de la côte Basque: Fucus chalonii nov. sp. Bulletin de la Société Botanique de France, 88: 143–147.
- Gao, H., Williamson, S. & Bustamante, C.D. (2007). A Markov chain Monte Carlo approach for joint inference of population structure and inbreeding rates from multilocus genotype data. Genetics, 176: 1635–1651.
- Gómez Garreta, A., Ribera Siguan, M.A., Salvador Soler, N., Rull Lluch, J. & Kapraun, D.F. (2010). Fucales (Phaeophyceae) from Spain characterized by large-scale discontinuous nuclear DNA contents consistent with ancestral cryptopolyploidy. Phycologia, 49: 64–72.
- Husband, B.C., Baldwin, S.J. & Suda, J. (2013). The incidence of polyploidy in natural plant populations: major patterns and evolutionary processes. In Plant Genome Diversity Vol. 2 (Leitch, I.J., Greilhuber, J., Dolezel, J. & Wendel, J.F., editors), 255–277. Springer-Verlag, Vienna.
- Jombart, T. (2008). ADEGENET: an R package for the multivariate analysis of genetic markers. Bioinformatics, 24: 1403–1405.
- Jombart, T., Devillard, S. & Balloux, F. (2010). Discriminant analysis of principal components: a new method for the analysis of genetically structured populations. BMC Genetics, 11: 94.
- Kapraun, D.F. (2005). Nuclear DNA content estimates in multicellular green, red and brown algae: phylogenetic considerations. Annals of Botany, 95: 7–44.
- Kopelman, N.M., Mayze, J., Jakobsson, M., Rosenberg, N.A. & Mayrose, I. (2015). Clumpak: a program for identifying clustering modes and packaging population structure inferences across K. Molecular Ecology Resources, 15: 1179–1191.
- Leitch, I.J. & Bennett, M.D. (2004). Genome downsizing in polyploid plants. Biological Journal of the Linnean Society, 82: 651–663.
- Leitch, I.J. & Leitch, A.R. (2013). Genome size diversity and evolution in land plants. In Plant Genome Diversity Vol. 2 (Leitch, I.J., Greilhuber, J., Dolezel, J. & Wendel, J.F., editors), 307–322. Springer-Verlag, Vienna.
- Mason, A.S. & Pires, J.C. (2015). Unreduced gametes: meiotic mishap or evolutionary mechanism? Trends in Genetics. doi: 10.1016/j.tig.2014.09.011.
- Mathieson, A.C., Clinton, J.D., Wallace, A.L. & Klein, A.S. (2006). Distribution, morphology, and genetic affinities of dwarf embedded Fucus populations from the Northwest Atlantic Ocean. Botanica Marina, 49: 283–303.
- Mirouze, M. & Paszkowski, J. (2011). Epigenetic contribution to stress adaptation in plants. Current Opinion in Plant Biology, 14: 267–274.
- Nei, M. (1978). Estimation of average heterozygosity and genetic distance from a small number of individuals. Genetics, 89: 583–590.
- Neiva, J., Hansen, G.I., Pearson, G.A., Van De Vliet, M.S., Maggs, C.A. & Serrão, E.A. (2012). Fucus cottonii (Fucales, Phaeophyceae) is not a single genetic entity but a convergent salt-marsh morphotype with multiple independent origins. European Journal of Phycology, 47: 461–468.
- Pereyra, R.T., Bergström, L., Kautsky, L. & Johannesson, K. (2009). Rapid speciation in a newly opened postglacial marine environment, the Baltic Sea. BMC Evolutionary Biology, 9: 70.
- Peters, A.F., Marie, D., Scornet, D., Kloareg, B. & Cock, J.M. (2004). Proposal of Ectocarpus siliculosus (Ectocarpales, Phaeophyceae) as a model organism for brown algal genetics and genomics. Journal of Phycology, 40: 1079–1088.
- Phillips, N., Kapraun, D.F., Garreta, A.G., Siguan, M.A.R., Rull, J.L., Soler, N.S., Lewis, R. & Kawai, H. (2011). Estimates of nuclear DNA content in 98 species of brown algae (Phaeophyta). AoB PLANTS, 2011: plr001. doi: 10.1093/aobpla/plr001.
- Piegu, B., Guyot, R., Picault, N., Roulin, A., Saniyal, A., Kim, H., Collura, K., Brar, D.S., Jackson, S., Wing, R.A. & Panaud, O. (2006). Doubling genome size without polyploidization: dynamics of retrotransposition-driven genomic expansions in Oryza australiensis, a wild relative of rice. Genome Research, 16: 1262–1269.
- Pritchard, J.K., Stephens, P. & Donnelly, P. (2000). Inference of population structure using multilocus genotype data. Genetics, 155: 945–959.
- Puttick, M.N., Clark, J. & Donoghue, C.J. (2015). Size is not everything: rates of genome size evolution, not C-value, correlate with speciation in angiosperms. Proceedings of the Royal Society B, 282: 20152289. org/10.1098/rspb.2015.2289.
- Rosenberg, N.A. (2004). DISTRUCT: a program for the graphical display of population structure. Molecular Ecology Notes, 4: 137–138.
- Sheehy Skeffington, M.J. & Curtis, T.G.F. (2000). The Atlantic element in Irish salt marshes. In Biodiversity: The Irish dimension (Rushton, B.S., editor), 179–196. Royal Irish Academy, Dublin.
- Šmarda, P. & Bureš, P. (2010). Understanding intraspecific variation in genome size in plants. Preslia, 82: 41–61.
- Song, Q. & Chen, Z.J. (2015). Epigenetic and developmental regulation in plant polyploids. Current Opinion in Plant Biology, 24: 101–109.
- Tayalé, A. & Parisod, C. (2013). Natural pathways to polyploidy in plants and consequences for genome reorganization. Cytogenetic and Genome Research, 140: 79–96.
- Wallace, A.L., Klein, A.S. & Mathieson, A.C. (2004). Determining the affinities of salt marsh fucoids using microsatellite markers: evidence of hybridization and introgression between two species of Fucus (Phaeophyta) in a Maine estuary. Journal of Phycology, 40: 1013–1027.
- Weir, B.S. & Cockerham, C.C. (1984). Estimating F-statistics for the analysis of population structure. Evolution, 38: 1358–1370.
- Wright, S. (1969). Evolution and the Genetics of Populations, Vol. 2. The Theory of Gene Frequencies. University of Chicago Press, Chicago.
- Wynne, M.J. & Magne, F. (1991). Concerning the name Fucus muscoides (Cotton) J. Feldmann et Magne. Cryptogamie, Algologie, 12: 55–65.
- Yoon, H.S., Hackett, J.D., Ciniglia, C., Pinto, G. & Bhattacharya, D. A. (2004). Molecular timeline for the origin of photosynthetic eukaryotes. Molecular Biology and Evolution, 21: 809–818.
- Zardi, G.I., Nicastro, K.R., Canovas, F., Costa, J.F., Serrão, E.A. & Pearson, G.A. (2011). Adaptive traits are maintained on steep selective gradients despite gene flow and hybridization in the intertidal zone. PLoS ONE, 6: 1–13.