
 ?Mathematical formulae have been encoded as MathML and are displayed in this HTML version using MathJax in order to improve their display. Uncheck the box to turn MathJax off. This feature requires Javascript. Click on a formula to zoom.
Abstract
Intertidal macroalgae are exposed to many biotic and abiotic stressors, including significant fluctuations in environmental parameters such as salinity, temperature, pH and solar radiation. This study characterized populations of the intertidal calcifying red alga Corallina officinalis across its geographic distribution in the North-east Atlantic. Processes examined included primary production, respiration, light and dark calcification, photosynthesis-irradiance, and calcification-irradiance evolution. Results confirmed significant differences in the physiology of C. officinalis between latitudes with a clear north-to-south gradient. Compared with central and southern populations of this species, northern populations appeared to be the most robust, showing potential for local physiological adaptation in response to increased variability in environmental factors present within their habitat. Conversely, southern populations displayed a distinct lack of local adaptation compared with northern populations. This is possibly due to southern populations being located within an environment at the upper limit of their stress tolerance, therefore restricting the species’ ability to adapt. As a result, future permanent decline, or even disappearance, of C. officinalis within southern locations of the North-east Atlantic could occur, a process that is likely to be accelerated by predicted future climatic changes. Furthermore, given the essential role these ecosystem engineers play within their habitat, any loss of C. officinalis is also expected to have a strongly negative impact on the surrounding environment.
HIGHLIGHTS
Decoupled photosynthesis and calcification in Corallina. officinalis show complex relationships, not direct dependencies.
Most physiological characteristics in northern C. officinalis populations differ significantly from those in central and southern locations.
Species adaptation is predominantly to lower light and temperature conditions.
Introduction
Marine calcifying organisms such as coralline red algae (Corallinales, Rhodophyta) are critical components of marine shallow-water ecosystems from polar regions to the tropics (Adey & MacIntyre, Citation1973; Steneck, Citation1986). They function as important ecosystem engineers and play a crucial role as an essential structural element in most rocky coastal zones by providing a rigid substratum for organisms to attach to (Dayton, Citation1972; Johansen, Citation1981; Kelaher et al., Citation2001; Nelson, Citation2009; Noël et al., Citation2009). They often form complex, exceptionally dense and highly branched turfs, considered to be at the extreme end of algal structural complexity (Coull & Wells, Citation1983; Davenport et al., Citation1999). In order to maintain abundance in temperate intertidal ecosystems, it is suggested that coralline algae possess the ability to adapt to extreme and rapid changes in environmental conditions such as levels of solar irradiance, physical stress, water temperature and carbonate chemistry (e.g. significant pH variations), which fluctuate tidally, diurnal, monthly and seasonally (Martone et al., Citation2010; Hofmann et al., Citation2014; Williamson et al., Citation2014). Furthermore, it is known that all these factors can influence the physiology and morphology of organisms and the shallow-water ecosystem they dominate (Wilson et al., Citation2004; McCoy, Citation2013). However, it is also recognized that species with a wide geographic range, such as coralline algae, also display a certain level of plasticity in their ability to be able to acclimatise to a variety of habitats through morphological and functional responses (Brody, Citation2004; Ragazzola et al., Citation2013; McCoy & Widdicombe, Citation2019).
Geniculate (articulated) coralline algae, such as Corallina officinalis, form turfs on hard substrata across large areas of the intertidal ecosystems of the North-east Atlantic. Corallina officinalis commonly occurs in sheltered, low intertidal zones, where it primarily inhabits the lower part of rock pools and channels that remain damp or are filled during extreme tides or conditions (Brodie et al., Citation2013; Guiry & Guiry, Citation2021). However, it may also be found at the edge of the intertidal to subtidal zones (Digby, Citation1977; Williamson et al., Citation2014). Without C. officinalis, it has been estimated that up to 80% of other organisms would not survive in coastal rocky shore habitats, and shores would be drastically depleted in diversity (Grahame & Hanna, Citation1989; Kelaher et al., Citation2001, Citation2003; Liuzzi & Gappa, Citation2008; Ragazzola et al., Citation2021). In the future, C. officinalis, and indeed many other organisms independent of their classification, may not be able to inhabit the same ecosystems they are found in today, due to the effect of climate changes, leading with high probability to a shift in distribution and species range margins (Parmesan et al., Citation1999; Parmesan & Yohe, Citation2003; Eckert et al., Citation2008; Kolzenburg et al., Citation2019, Citation2021).
Successful adaptation of species to predicted climate changes will need to include the facilitation of all metabolic processes, notably photosynthesis, respiration, calcification and growth. For the widely distributed, turf-forming alga C. officinalis, it remains unclear whether and, if so, how this species will be able to withstand such changes. At present, there are very few studies that compare the physiology of intertidal benthic organisms across the species’ latitudinal distribution gradient. In the case of C. officinalis, this knowledge gap complicates establishing detailed predictions for the future of this species (Nelson, Citation2009; Brodie et al., Citation2014; Williamson et al., Citation2017). Our study represents a physiological characterization of C. officinalis across its distribution in the North-east Atlantic and includes measurements of primary production, respiration, calcification, photosynthesis-irradiance curves and calcification-irradiance curves.
Until recently, it was generally assumed that the genetic diversity, genetic flow and population abundance of a species are highest at the centre of the species’ geographic distribution. However, this ‘centre-periphery’ and ‘abundant centre’ hypothesis (Mayr, Citation1963; Brown, Citation1984; Sagarin & Gaines, Citation2002) has been questioned by recent research which found alternative responses and confounding factors such as latitude, ecological environmental gradients, phylogeographic history, seawater pH and temperature (reviewed by Gaston, Citation2009; Bozinovic et al., Citation2011; Calosi et al., Citation2017; Kolzenburg et al., Citation2021). Even though marginal populations are lower in genetic diversity than central populations, they engender exceptional genetic variation, enabling species to adapt to new abiotic and biotic stressors (Abeli et al., Citation2014). Studies analysing the demographic pattern between core and edge populations show a complex arrangement in which peaks of abundances are shifted towards one end of the species range edge or show no pattern (Sagarin & Gaines, Citation2006; Sagarin et al., Citation2006).
To determine patterns for C. officinalis, we hypothesized that central populations would show the greatest rates of productivity and calcification, reflecting their assumed position within the most favourable conditions across the species’ range (Whittaker, Citation1956; Brussard, Citation1984). In contrast, we predicted that latitudinal northern and southern margin populations present higher variations within their physiological characterization, representing their resilience to higher in situ fluctuations.
Materials and methods
Species collection
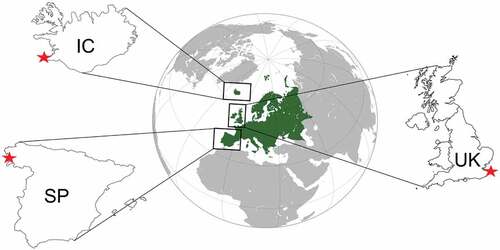
Corallina officinalis was collected from two populations at each of the three locations (northern, central and southern) across the North-east Atlantic: South-west coast of Iceland (northern margin population 1: Stafnes South: N 63.968444, W 22.750861; northern margin population 2: Stafnes North: N 63.974380, W 22.753610, beeline distance between populations: 1.59 km; NP), the South-east coast of the UK (central population 1: St Margarets Bay: N 51.148056, E 1.385056; population 2: Westbrook Bay: N 51.388840, E 1.367170; beeline distance between populations: 26.85 km; CP) and the North-west coast of Spain (southern margin population 1: Illa del Arousa: N 42.56870, W 8.89171; population 2: Tragove: N 42.52444, W 8.82772; beeline distance between populations: 7.19 km; SP; ). For each population, 72 specimens from intertidal channels were collected (total n = 432) during low tide, at a depth of ~0.25 m from the water surface. The species had been genetically identified in previous studies in all locations (Tavares et al., Citation2018; Kolzenburg et al., Citation2019).
Fig. 1. Sampling locations of Corallina officinalis across the latitudinal distributional gradient in the North-east Atlantic: IC: Iceland representing poleward populations, UK: United Kingdom representing central populations, SP: Spain representing equatorward populations. Red stars represent sampling sites.
Corallina officinalis specimens from each population at each site were cleaned of visually identifiable epiphytes using forceps and kept aside in separate insulated containers for in situ incubation, performed after sampling procedures and seawater measurements. The remaining specimens were cleaned the same way and transported to the laboratories of the collaborating universities of the respective countries (University of Portsmouth, University of Vigo and University of Iceland) in temperature-insulating containers. Specimens were immediately placed into an ambient, flow-through holding tank for acclimatisation before further incubations in the laboratory facilities. Only healthy individuals without epiphytes and indications of bleaching or damage were selected for further studies.
Measurements of environmental parameters
During field sampling, data loggers (Tempcon Instrumentation Ltd, Arundel, UK; HOBO UA-002-64 Pendant Temp/Light, accuracy: 0.47°C, resolution: 0.1°C) were deployed, immersed at the lowest boundary between exposed and submerged substrata at the point of sampling around low spring tide at each site, to record temperature and light regimes every 30 minutes for 3, 14 and 17 months for NP, CP and SP, respectively. Data logger measurements at northern sites were not recorded throughout the period of one year due to adverse environmental conditions, time and financial limitations. However, both incubation seasons, summer and winter, were during the available records and were comparable with those recorded at Associated Icelandic Ports (Mortensen, Citation2019) for the respective years and months (Supplementary fig. S1).
Temperature, salinity, dissolved oxygen (DO), pH, irradiance and total alkalinity (AT) were measured (n = 1 in 2016 and n = 3 in 2017 and 2018) during sample collection. Temperature and salinity were measured with a CO310-1 portable salinity and temperature probe (VWR, Leicestershire, UK; accuracy: 0.2% for salinity, ± 0.2°C for temperature; resolution: 0.1 for salinity, 0.1°C for temperature). Dissolved oxygen and pH were recorded using an HQ30d portable multi-parameter meter and a luminescent DO (HACH, Manchester, UK; LDO101, accuracy: ± 0.1 mg/l, HACH, Manchester, UK) and pH probe (PHC301, accuracy: ± 0.02 pH). The pH probe was calibrated on the National Bureau of Standards (NBS) scale and values were converted into total scale values using Tris/HCl and 2-aminopyridine/HCl buffer solutions after Dickson (Citation2007). Irradiance was measured with a Hansatech Quantitherm PAR/Temperature Sensor with a QTP1 probe (resolution: 1 μmol photons m–2 s–1, ± 0.02°C, respectively).
Prior to transportation and immediately after collection, water samples for AT determination were sterile-filtered through a syringe filter (Fisherbrand, hydrophilic 25 mm, 0.2 μm PTFE) into sterile 50 ml tubes (Fisherbrand, Plastic Centrifuge Tubes). Using the alkalinity technique after Smith & Key (Citation1975), Chisholm & Gattuso (Citation1991) and Dickson (Citation2007), AT was determined in the laboratory at the University of Portsmouth promptly upon arrival via potentiometric titrations using an automatic titrator (Schott SI Analytics, Farnborough, UK; TitroLine 7000; measurement accuracy: 0.002 ± 1 digit, dosing accuracy: 0.15%, dosing precision: 0.05–0.07%) calibrated on the NBS scale, to ensure minimal variation. As titrant 0.1 N hydrochloric acid (HCl; Thermo Fisher Scientific, UK) was used and validated against certified reference material provided by Andrew G. Dickson (Batch 154, Scripps Institution of Oceanography).
The weight of algal fronds used in the incubations was transformed from fresh weight (FW) to dry weight (DW) using weight comparison following Kolzenburg et al. (Citation2019).
In situ incubations – photosynthesis, respiration and calcification
Incubations to determine in situ photosynthesis, respiration, light and dark calcification were performed with a mean of 0.53 ± 0.11 g, 0.59 ± 0.20 g and 0.79 ± 0.25 g dry weight (DW) of C. officinalis, for central (CP), southern (SP) and northern populations (NP), respectively. At 12:00 noon, replicates (n = 3) were incubated bubble-free, in clear, closed-cell 58 ml incubation chambers (Fisherbrand, Plastic Centrifuge Tubes). Incubation chambers were placed for 60 minutes in a secure location close to the sampling location and open to the water to ensure in situ conditions. The open water also provided some water movement inside the incubation chambers (even though not as much as the water motion provided by a stirrer). DO concentrations, pH and AT were determined before and after the incubations, to calculate photosynthesis, respiration and calcification rates in the light and in the dark. Reference incubations without the C. officinalis samples were performed in conjunction with those with the alga to account and correct for metabolism effects by microscopic organisms in the water column. Aluminium foil covering each incubation chamber was used to cut out the light in order to determine calcification and respiration rates in the dark.
Laboratory incubations – oxygen and calcification evolution
In respective university laboratories, incubations were conducted to determine oxygen (P-I curve) and calcification evolution (G-I curve) of the samples from the study populations. Specimens of C. officinalis were incubated at increasing light intensities (0, 20, 80, 160, 320, 500 and 700 μmol photons m–2 s–1; AQUARAY Nature Perfect, Tropic Marine Centre, London; Egilsdottir et al., Citation2016; Kolzenburg et al., Citation2019), for 60 and 30 min for low and high light intensities, respectively, and under ambient temperature conditions and in natural seawater. For each light intensity, a new set of five clear incubation chambers were filled with 0.62 ± 0.03 g DW, 0.59 ± 0.03 g DW and 0.63 ± 0.04 g DW, for CP, SP and NP, respectively, of C. officinalis and closed bubble-free. The incubation chambers were floating in a water bath to keep the conditions as close as possible to the field conditions. Reference incubations without algal samples were performed alongside to account and correct for metabolism effects from other organisms. Aluminium foil covering each incubation chamber was used to cut out the light in order to determine calcification and respiration rates in the dark. At the end of the incubation, DO, pH and temperature measurements were taken. Water samples for AT analyses were sterile-filtered and treated in the same way as the field samples.
Data and statistical analysis
P-I (or G-I) curves were used to establish the relationship between irradiance (I, μmol photons m–2 s–1) and PN (or G) following Platt et al. (Citation1980) with the addition of dark respiration (R) (or dark calcification, Gd):
where α is the initial slope of the relationship and β is the photoinhibition coefficient, which is set to zero in the absence of photoinhibition. Modelled values for Pmax and Gmax following Platt et al. (Citation1980) can be found in Supplementary table S4 in the supplementary information.
The maximum potential photosynthetic and calcification rates (Pmax and Gmax [mg O2 (or CaCO3) gDW –1 h–1]) was directly determined from the oxygen (P-I) and calcification (G-I) evolution curves. The slope of the light-limited region of the respective curve before data reached saturation levels represents the light-harvesting efficiency of the alga (α), which was calculated using a hyperbolic tangent fit (Platt et al., Citation1980). The irradiance at which photosynthesis is saturated (IK [μmol photons m–2 s–1]) was calculated using the following relationship:
Primary production was measured using oxygen fluxes such as photosynthesis (PN [µmol O2 g DW –1 h–1]) and respiration (R [µmol O2 g DW–1 h–1]) and was calculated as follows:
with ∆O2 as the change in dissolved oxygen concentration [µmol /l], V as the volume of the incubation chamber [l], ∆t as the incubation time [h] and DW as the dry weight of the samples [g] (Martin et al., Citation2013). Calcification rates can be determined from changes in AT due to the chemical reaction of formation and dissolution of CaCO3, and the concomitant change in ions and charges in seawater.
Calcification (G [µmol CaCO3 g DW –1 h–1]) rates were estimated using the following equation:
with ∆AT as the change in total alkalinity [meq/l], obtained through the alkalinity anomaly technique described above.
Curves were fitted in R (Version 4.1.2; R Development Core Team, Citation2017). Statistical analyses were performed in SPSS Statistics 25 (IBM Corp, 2016). Prior to analyses, data were tested for normality and homogeneity of variance (Shapiro–Wilk and Levene’s test). Data for primary production (n = 4), respiration (n = 4), light calcification (n = 4) and dark calcification (n = 4) were not normally distributed and showed unequal population variances. Thus, data were analysed using the non-parametric Kruskal–Wallis H test. Pmax (n = 5) and Gmax (n = 5) displayed normality and homogeneity of variance and were subsequently analysed using two-way analyses of variances (ANOVAs) for replicates from each population (n = 6), within seasons (n = 2; summer and winter) as the fixed factors. Where significant, data were further explored by post hoc Tukey HSD tests. Lower in situ compared with laboratory replication was caused by logistical and time restrictions. Data (mean ± SE) and statistical results of production, respiration and calcification rates are summarized for individual populations and pooled into geographic locations in Supplementary tables S1 and S2, respectively. Individual and pooled data, including statistical results for production and calcification evolution curves, can be found in Supplementary tables S3 and S4.
Results
Environmental variability
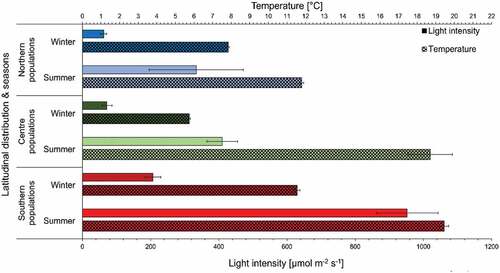
With the focus of this study on the geographic differences, only pooled data are presented and discussed here. Details on individual population performances can be found in the supplementary information (SI). During long-term in situ measurements, northern environments presented the lowest light and temperature levels, central and southern environments showed comparable values. However, maximum temperature and irradiance occurred earlier in central as compared with southern sampling locations (, Supplementary fig. S2). These data showed significant variability in temperature and irradiance levels and corresponding variability between seasons at all locations (). Northern sampling sites showed the lowest whereas central and southern locations experienced comparable thermal variability (Δ) between maximum summer and minimum winter values (). Over a 4-year period, in situ midday point measurements of temperature (mean ± SD) showed the expected increasing gradient with decreasing latitude, although, central summer temperatures (18.38 ± 2.44°C) were comparable to regions closer to the equator (19.76 ± 0.87°C) and central winter temperatures (6.39 ± 0.41°C) to northern regions (5.22 ± 1.44°C; ). Northern and central environments showed the highest and lowest thermal variability in winter, although the converse was true in summer. In situ midday point measurements of light intensities revealed between 2.5- and 4.7-times higher irradiance in southern than in central and northern environments (, ).
Table 1. Maximum (Max) and minimum (Min) temperature (°C) and light irradiance (µmol photons m–2 s–1) (mean ± SD) in summer and winter measured by data logger deployment next to the sampling sites in the respective region. Highest variability (Δ) for each sampling location, measured as difference between the maximum summer and the minimum winter temperatures.
Table 2. Ambient sampling details (mean ± SD): atmospheric pressure, pH, dissolved oxygen (DO), salinity, temperature and irradiance, as well as daylight hours and weather conditions across Corallina officinalis distribution in the North-east Atlantic. Data represent point measurements during sample collection at different sampling occasions over a four-year period.
Fig. 2. Data logger records of temperature (°C) and light intensity (irradiance; μmol photons m–2 s–1) at northern sites of Corallina officinalis distribution in the North-east Atlantic, Iceland, between July and October 2017. Light intensity is represented as yellow line and temperature is represented as the in situ records in the multiple-colour line. Temperatures above 20°C and below 10°C are coloured in red and blue, respectively.
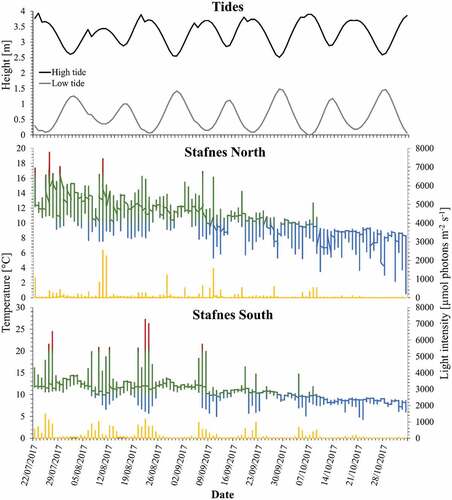
Fig. 3. Data logger records of temperature (°C) and light intensity (irradiance; μmol photons m–2 s–1) at central sites of Corallina officinalis distribution in the North-east Atlantic, UK, between January 2017 and March 2018. Light intensity is represented as a yellow line and temperature is represented as the in situ records in the multiple-colour line. Temperatures above 20°C and below 10°C are coloured in red and blue, respectively. Grey areas mark time periods not directly comparable with the other locations, but data loggers continued recording.
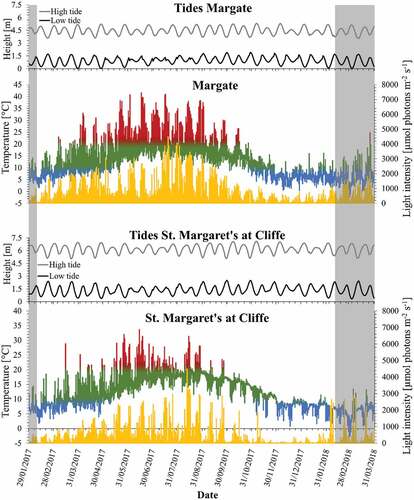
Fig. 4. Data logger records of temperature (°C) and light intensity (irradiance; μmol photons m–2 s–1) at southern sites of Corallina officinalis distribution in the North-east Atlantic, Spain, between February 2017 and July 2018. Light intensity is represented as a yellow line and temperature is represented as the in situ records in the multiple-colour line. Temperatures above 20°C and below 10°C are coloured in red and blue, respectively. Grey areas mark time periods not directly comparable with the other locations, but data loggers continued recording.
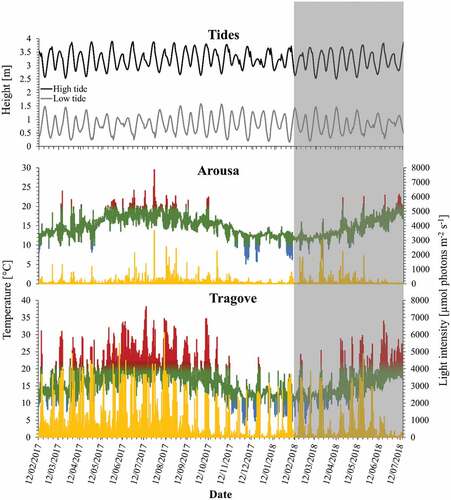
Fig. 5. In situ temperature (°C) and light intensity (irradiance; µmol photons m–2 s–1) before noon-incubations across sites (mean ± SE, n = 2 per latitudinal region) of Corallina officinalis in the North-east Atlantic. Chequered and solid bars represent temperature and light intensity, respectively. Coloured bars represent individual regions.
Primary production and respiration
In situ production rates (PN) in NP and CP but not SP were significantly lower in winter compared with summer (, Supplementary table S2), although amongst all regions, CP displayed highest rates in summer and NP presented lowest rates in winter, the latter showing significantly lower rates than all others. Unlike CP and NP, SP presented no difference between summer and winter and showed higher rate variation in winter than summer. Northernmost populations were significantly lower than southern populations in winter (Supplementary table S2(B)).
Fig. 6. Primary production and dark respiration rates (µmol O2 h−1 gDW−1) mean ± SE (n = 10) of in situ incubations of Corallina officinalis across its distribution in the North-east Atlantic in summer and winter. Pmax added for comparison.
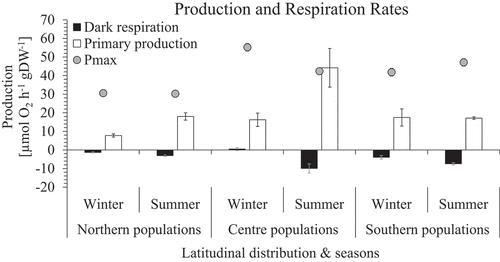
In situ respiration rates (R) of NP were only significantly different to SP in summer (Supplementary table S2(B)). Only CP and NP showed a significant increase from winter to summer (Supplementary table S2(B)).
Seasonal mean daily production revealed the highest and lowest rates in central and northern marginal populations, respectively (). This observation reflected the summer mean daily production rates in relation to long-term light measurements and P-I curves. Seasonal mean daily production rates were not available for NP in winter but were calculated for CP (21.05 ± 1.13 µmol O2 h–1 g DW–1) and SP (21.09 ± 1.24 µmol O2 h–1 g DW–1), evincing equal values.
Fig. 7. Seasonal daily production (left) and calcification (right) rates (mean ± SE) of northern (blue), central (green) and southern (red) populations (n = 2) of Corallina officinalis in summer (light colours) and winter (dark colours).
Calcification
Only in situ light calcification (GN) in summer was significantly higher in central than marginal populations. SP revealed the highest light calcification rates in winter, significantly different to NP but not to CP (, Table S2). CP showed similar GN value ranges in both seasons. Rates for GN were drastically lower in NP compared with CP in both seasons. NP and CP showed a rate increase from winter to summer in contrast to SP which showed a highly significant decrease from high winter to much lower summer rates.
Fig. 8. Light and dark calcification rates (µmol CaCO3 h–1 gDW–1) mean ± SE (n = 10) of in situ incubations of Corallina officinalis across its distribution in the North-east Atlantic in summer and winter. Gmax added for comparison.
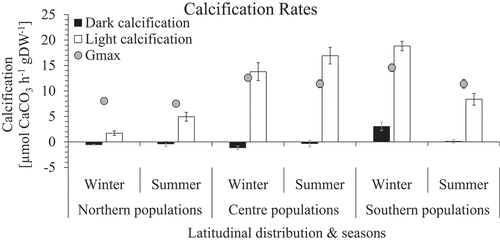
In situ calcification rates in the dark (GD) showed no differences between CP and NP; however, they showed a highly significant increase in both seasons between SP (0.11 ± 0.33 and 3.04 ± 0.81 µmol CaCO3 h–1 g DW–1 for summer and winter, respectively) and CP (−0.33 ± 0.63 and –1.15 ± 0.35 µmol CaCO3 h–1 g DW–1 for summer and winter, respectively), and NP (−0.39 ± 0.47 and −0.55 ± 0.08 µmol CaCO3 h–1 gDW–1 for summer and winter, respectively; , Supplementary table S2). Positive dark calcification – meaning CaCO3 precipitation instead of dissolution – was visible in SP. Highest and lowest in situ dissolution rates were found in CP and NP, respectively. No region showed significant differences in GD between seasons (, Supplementary table S2(B)).
Seasonal mean daily calcification showed highest rates in SP, followed by CP and NP (). In summer, mean daily calcification was 2.6- and 2.4-times lower in NP relative to SP and CP. In winter, SP showed 2.4-times higher daily calcification rates than CP.
Photosynthesis and calcification evolution
The mean saturating production rates (Pmax) of CP were significantly higher than those of NP in both seasons and those of SP in summer (), Supplementary table S4). NP showed significantly lowest Pmax compared with CP and SP. SP and CP showed a significant increase and decrease, respectively, of Pmax from summer to winter conditions. Unfitted and fitted curves for individual and pooled data can be found in Supplementary figs S2–S4.
Fig. 9. Evolution curve characteristics for production and calcification (mean ± SE, n = 10) of northern, central and southern populations (n = 2; n = 5 per population) of Corallina officinalis in summer and winter. (A): Pmax/Gmax = maximum production, (B) α = initial slope as indicator for photosynthetic or calcification efficiency, (C) IK = saturating irradiance. For detailed graphs: Fig. S1 (A–M), Fig. S5.
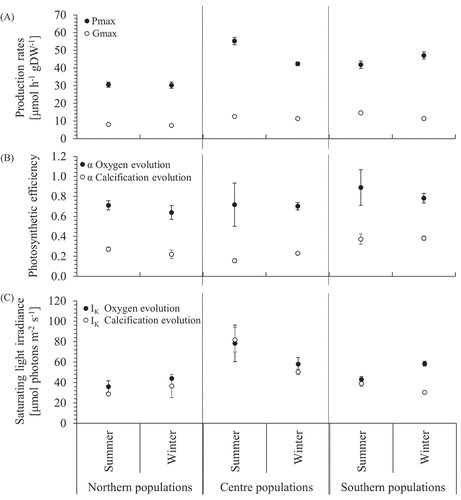
The photosynthetic efficiency (α) of the oxygen evolution was overall lowest and highest in NP and SP, respectively, with SP showing the greatest differences between seasonal data. Both marginal populations showed a noticeable decreasing trend from summer to winter efficiency, whereas CP remained stable (), Supplementary table S4(A)).
The saturating light intensity (IK) of P-I curves were highest in CP, decreased in SP and further decreased in NP (), Table S4). Mean values for IK in both marginal populations decreased from winter to summer but increased in CP (), Supplementary fig. S2(E–H), Supplementary table S4). Curves fitted after Platt et al. (Citation1980) did not show photoinhibition in any P-I curve (Supplementary figure S4).
The mean saturating light for calcification (Gmax) was significantly higher in SP (>11.4 µmol h–1 g DW–1 for both seasons) and significantly lower in NP (8.04 ± 0.60 and 7.52 ± 0.35 µmol h–1 g DW–1 for summer and winter, respectively) (), Supplementary table S4). All populations showed a reduction in Gmax from summer to winter rates, with the greatest and smallest decline in SP and NP, respectively. Only SP showed a significant difference from winter to summer.
On average, SP showed the highest and NP the lowest α values of G-I curves. Populations showed a change of α by +23%, −30% and −0.03% from winter to summer for NP, CP and SP, respectively (), Supplementary fig. S2(E–H), Supplementary table S4(A)).
IK of G-I curves was highest in CP compared with both marginal populations. SP and NP showed similar values (), Supplementary fig, S2(E–H), Supplementary table S4(A)). In summer, IK for CP was more than double that of SP and triple than that of NP; in winter, this discrepancy shrank, only to be 1.66- and 1.38-times higher in CP than SP and NP, respectively.
Photoinhibition of production and calcification rates was not observed in fitted curves in any region (max. light intensity: 700 µmol photons m–2 s–1). However, it was shown in un-fitted curves, and β is presented in Supplementary table S3 and S4, for individual and pooled data, respectively; Pmax and Gmax were reached in all populations and treatments.
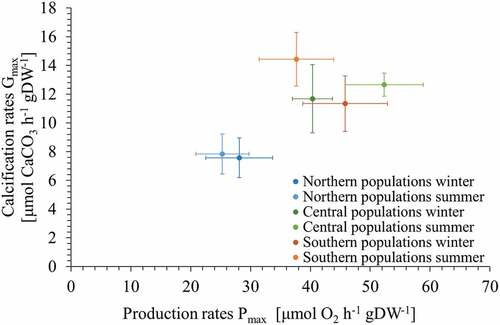
When relating seasonal maximum production (Pmax) and calcification (Gmax) rates, a clear separation of NP from CP and SP was observed (). CP and SP clustered together and NP showed the lowest rates in both Pmax and Gmax leading to the lowest overall production of oxygen in relation to precipitation of calcium carbonate. Interestingly, there was no difference between seasons in any of the regions.
Fig. 10. Seasonal production versus calcification rates (mean ± SE) of northern (blue), central (green) and southern (red) populations (n = 2) of Corallina officinalis in summer (light colours) and winter (dark colours).
Discussion
In this study, physiological traits of C. officinalis across its geographic range in the North-east Atlantic showed different local and seasonal adaptations to the regions in response to exposure to a wide range of abiotic and biotic factors.
Temperature and light intensities measured in this study across the geographic range of C. officinalis in the North-east Atlantic were highly variable, which led to some overlap of these environmental conditions during either the winter or summer season between northern, southern and central populations. Despite this overlap, there were still differences in the physiology of C. officinalis (e.g. PN and R) across the distributional gradient suggesting considerable capacity for local adaptation and acclimation. For instance, in northern populations, where environmental conditions in summer showed similarities with those of southern environments in winter, comparable physiological rates would have been expected. Despite similar PN and R rates, northern populations revealed much lower seasonal daily production and calcification rates than more southerly populations.
There is also evidence that photosynthetic responses can occur on a smaller geographic scale, for example in the brown alga Fucus sp. (Rothäusler et al., Citation2018) where differences were linked to genotypes expressing variation in their ETRmax values. These findings suggest that there might be genetic variation within Fucus sp. populations in photosynthetic efficiency. For C. officinalis, the genetic difference of the northern populations compared with the central and southern populations was studied by Yesson et al. (Citation2018), and showed a very different genetic makeup for the northern populations compared with central and southern populations. These genetic differences could also explain why northern populations showed a distinct cluster away from central and southern populations when correlating the amount of oxygen produced in relation to the amount of CaCO3 precipitated.
Oxygen and calcification evolution curves were performed for every region and season in order to correct for potentially misleading comparisons of light intensities. In this study, the field incubation showed, in most cases, much lower Pmax and Gmax rates compared with the experimentally determined rates. Calcification in central and southern populations reach their respective Gmax levels during the field incubation, although the same populations did not reach their respective Pmax levels except for centre populations in summer, suggesting that this may not fully derive from the influence of light but rather from an uncoupling of both processes (Kolzenburg et al., Citation2019). Additionally, calcification performance seems faster than photosynthetic performance which suggests either a greater impact of light on calcification rather than on photosynthesis or this more rapid calcification response could be caused by organismal processes using up a considerable amount of energy that may thus not be readily available for photosynthetic processes. The first theory is supported by a steeper increase in light-harvesting efficiency (α) and therefore reaching more rapidly saturating light irradiance (IK) levels in calcification evolution curves. All these seemingly contradictory but actually complementary findings highlight the dynamic interactions between processes and reveal complex relationships instead of direct dependencies.
Northern populations had the lowest production rates (Pmax) and the lowest saturation irradiance (IK) but with comparable photosynthetic efficiency (α) to all the other populations. Central populations had the highest Pmax in summer with higher IK but similar α to all the other populations. The similar α suggests that across the geographic distribution, individuals of C. officinalis have the same efficiency in light-harvesting. Measurements for IK in this study (min. 30, max. 95 µmol photons m–2 s–1) are considerably lower compared with findings by Hofmann et al. (Citation2012) where values from 240–327 µmol photons m–2 s–1 were reported for a central population of C. officinalis in Helgoland, Germany. A study on a closely related species of C. officinalis, Ellisolandia elongata, in France revealed comparable Pmax and slightly lower Gmax values in summer and winter (Egilsdottir et al., Citation2016).
In our study, in winter, the respiration rates of southern populations are highest of all populations showing stress and lack of adaptation. Northern populations show the lowest respiration rates, implying the expression of the lowest stress levels as well as temperature-induced deceleration of photosynthetic processes. Production and respiration rates determined in this study were found to be comparable with values for the related species E. elongata of 14.14 ± 0.91 for net production and −3.80 ± 0.29 µmol O2 h–1 g DW–1 for respiration in a central population (Egilsdottir et al., Citation2013). However, the same study reported lower calcification rates of 2.14 ± 0.16 and −0.73 ± 017 µmol CaCO3 h–1 g DW–1 for light and dark calcification, respectively, under natural light conditions. Similar to our study, the authors also found a strong seasonality between primary production and respiration in northern and central populations, although not in southern populations which instead showed an apparent decoupling of photosynthesis and calcification. Such a decoupling was also indicated by Johansen (Citation1981) and Kolzenburg et al. (Citation2019), both studies report the lack of a close relation between both physiological processes. This shows the high variability even within closely related coralline algae and underlines the importance of studying not only indicator species but a broad spectrum of representatives of macroalgae in the intertidal across the globe.
Higher light and dark calcification rates in southern populations compared with central and northern populations in winter, are potentially caused by continuous calcification in both light and dark conditions, and the lack of dissolution. However, the addition of reduced primary production in southern populations, suggests a focus on processes to maintain structural properties rather than investment in physiological surplus of biomass production through photosynthesis. Another species displaying maladaptation and reduced ecological potential of southern populations to factors exacerbated by future climatic changes (e.g. heat stress) in the intertidal is Fucus serratus (Pearson et al., Citation2009). The authors described a reduced resilience of maximum PSII quantum yield to heat shocks and an increased expression of heat shock genes, suggesting greater cellular stress, above a certain crucial thermal threshold in these populations. Marginal populations in our study showed the highest (southern populations) and lowest (northern populations) as well as more constant calcification rates, but lower production and respiration rates.
As a result of only single incubations during seasons, which are greatly dependent on weather and environmental conditions, values of parameters may be under- or overestimated, depending on temperatures and light intensities. It has been already shown by Martínez et al. (Citation2012) that environmental variations during low tide on days with harsh weather conditions yielded the greatest physiological variations in F. serratus. Additionally, due to size restrictions, the water movement inside the incubation chambers relied exclusively on the surface disturbance of the water at the sampling site (due to the floating/partial submersion of the chambers in the water during the incubation time), and so potentially could have led to an underestimation of physiological response rates due to a build-up of the diffusive boundary layer around the thalli (Noisette & Hurd, Citation2018; Schubert et al., Citation2021). In light of this, to maintain methodological continuity and comparability between in situ and laboratory incubations, stirring was therefore also not introduced during laboratory incubations and the water movement relied on a water bath (mimicking the surface disturbance). Both the environmental variations during low tide and minimum water movement could explain potentially high differences within populations in in situ midday incubations, and so results are highly dependent on external conditions and should be addressed through an adaptation of future experimental designs.
Physiological properties of populations across the geographic distributions differ between northern and central, as well as northern and southern populations. However, central populations are not always different to southern populations. From this, it can be understood that the centre-to-margin hypothesis (Sagarin & Gaines, Citation2002), must be adjusted and transformed into a north-to-south gradient regarding the physiology of C. officinalis. Its characterization across the North-east Atlantic validated the physiological adaptation and acclimation capacity of C. officinalis, predominantly to low light and temperature conditions and revealed already stressed populations at the southern margin, equatorward locations of this species distribution. Studies of other intertidal macroalgae have already revealed a dramatically reduced reproductive capacity of southern compared with central populations and found a risk to the viability of those marginal populations (Viejo et al., Citation2011). A future approach, therefore, would want to look not only into structural integrity of the calcified skeleton of C. officinalis but also into potential impairment of reproductive processes.
Supplementary table S1: (A) Mean ± SE (n = 4) of production, respiration, light and dark calcification rates of field populations (n = 2) of Corallina officinalis across its geographic distribution in the North-east Atlantic. (B) Statistical comparison between populations within season and between seasons within populations.
Supplementary table S2: (A) Mean ± SE (n = 8) of production, respiration, light and dark calcification rates of field populations (n = 2) of Corallina officinalis across its geographic distribution in the North-east Atlantic. (B) Statistical comparison between regions within season and between seasons within region.
Supplementary table S3: (A) Mean ± SE (n = 5) for saturating photosynthesis (Pmax) and calcification (Gmax) levels, photosynthetic efficiency (α), photoinhibition coefficient (β) and saturating light intensity (IK) of field populations (n = 2) of Corallina officinalis across its geographic distribution in the North-east Atlantic. (B) Statistical comparison of Pmax and Gmax between populations within season and between seasons within populations.
Supplementary table S4: (A) Mean ± SE (n = 10) of pooled saturating photosynthesis (Pmax) and calcification (Gmax) levels, photosynthetic efficiency (α), photoinhibition coefficient (β) and saturating light intensity (IK) of field populations (n = 2) of Corallina officinalis across its geographic distribution in the North-east Atlantic. (B) Statistical comparison of Pmax and Gmax between regions within season and between seasons within region.
Supplementary table S5: Maximum (Max) and minimum (Min) temperature [°C] and light irradiance [µmol photons m–2 s–1] in summer and winter measured by data logger deployment next to the sampling sites in the respective location. Numbers in brackets represent the number of days where temperature exceeded 20°C or fell below 10°C, respectively. Highest variability (Δ) for each sampling location, measured as difference between the maximum summer and the minimum winter temperatures.
Supplementary table S6: Ambient sampling details (mean ±SD): atmospheric pressure, pH, DO (dissolved oxygen), salinity, temperature and irradiance, and weather conditions at all sites across Corallina officinalis distribution in the North-east Atlantic. Data represent point measurements during sample collection at different sampling occasions over a four-year period.
Supplementary figure S1: Annual sea surface temperature at coastline (°C) at Reykjavik, Iceland between 29 January 2017 and 31 March 2018. Temperatures above 20°C and below 10°C are coloured in red and blue, respectively. Grey areas mark time periods not directly comparable with the same timeframe at other locations. Data retrieved from Hafrannsóknastofnun, Marine Research Institute, MRI, Iceland (https://sjora.hafro.is/).
Supplementary figure S2: P-I and G-I curves of all populations across the geographic distribution of Corallina officinalis in the North-east Atlantic and season. A-D, E-H and I-M represent northern, central and southern populations, respectively. Countries of origin are abbreviated as Iceland (NP), United Kingdom (CP) and Spain (SP). Grey closed circles represent calcification rates, black closed circles represent production rates. Trend lines are shown as dashed lines of the respective colour.
Supplementary figure S3: Fitted P-I (top two rows) and G-I curves (lower two rows) following Platt & Jassby (Citation1976) of individual Corallina officinalis populations (n = 2) across the species distributional gradient in the North-east Atlantic and season (summer and winter). Original curves can be found in Supplementary figure S1.
Supplementary figure S4: Fitted P-I (top two rows) and G-I curves (lower two rows) following Platt et al. (Citation1980) of pooled Corallina officinalis populations (n = 2) across the species distributional gradient in the North-east Atlantic and season (summer and winter). Original, individual curves can be found in Supplementary figure S1.
Supplementary figure S5: Primary production (white bars) and dark respiration rates (black bars; µmol O2 h–1 g DW–1) mean ± SE (n = 5) of in situ incubations of Corallina officinalis across its distribution in the North-east Atlantic in summer and winter.
Supplementary figure S6: Light (white bars) and dark (black bars) calcification rates (µmol CaCO3 h−1 gDW−1) mean (n = 5) of in situ incubations of individual Corallina officinalis populations across their distribution in the North-east Atlantic in summer and winter.
Supplementary figure S7: Evolution curve characteristics for net production and calcification (mean ± SE, n = 5) of northern, central and southern populations (n = 2) of Corallina officinalis in summer and winter. (A): Pmax/Gmax = maximum production, (B) α = initial slope as indicator for photosynthetic efficiency, (C) IK = saturating irradiance. For detailed graphs, Supplementary figure S1 (A–M).
Author’s contributions
R. Kolzenburg: original concept, performed measurements and analysis, drafting and editing manuscript; D. J. Coaten: advised on fieldwork, editing manuscript; F. Ragazzola: original concept, fieldwork, editing manuscript.
Supplemental Material
Download PDF (3.1 MB)Acknowledgements
The authors would like to thank all volunteers for their help with sampling and field incubations. A big thanks also goes to the staff at the Applied Engineering Centre, University of Iceland, the Suðurnes Science and Learning Centre, and Juan José Pasantes Ludeña from the University of Vigo and the Toralla Marine Science Station for their great help and support.
Disclosure statement
No potential conflict of interest was reported by the authors.
Supplementary information
The following supplementary material is accessible via the Supplementary Content tab on the article’s online page at https://doi.org/10.1080/09670262.2022.2066188
Additional information
Funding
References
- Abeli, T., Gentili, R., Mondoni, A., Orsenigo, S. & Rossi, G. (2014). Effects of marginality on plant population performance. Journal of Biogeography, 41: 239–249.
- Adey, W.H. & MacIntyre, I.G. (1973). Crustose coralline algae: a re-evaluation in the geological sciences. Geological Society of America Bulletin, 84: 883–904.
- Bozinovic, F., Calosi, P. & Spicer, J.I. (2011). Physiological correlates of geographic range in animals. Annual Review of Ecology, Evolution, and Systematics, 42: 155–179.
- Brodie, J., Walker, R.H., Williamson, C. & Irvine, L.M. (2013). Epitypification and redescription of Corallina officinalis L., the type of the genus, and C. elongata Ellis et Solander (Corallinales, Rhodophyta). Cryptogamie, Algologie, 34: 49–56.
- Brodie, J., Williamson, C.J., Smale, D.A., Kamenos, N.A., Mieszkowska, N., Santos, R., Cunliffe, M., Steinke, M., Yesson, C., Anderson, K.M. & Asnaghi, V. (2014). The future of the north-east Atlantic benthic flora in a high CO2 world. Ecology and Evolution, 4: 2787–2798.
- Brody, H.M. (2004). Phenotypic Plasticity: Functional and Conceptual Approaches. Oxford University Press, Oxford.
- Brown, J.H. (1984). On the relationship between abundance and distribution of species. American Naturalist, 124: 255–279.
- Brussard, P.F. (1984). Geographic patterns and environmental gradients: the central-marginal models in Drosophila revisited. Annual Review of Ecology and Systematics, 15: 25–64.
- Calosi, P., Melatunan, S., Turner, L.M., Artioli, Y., Davidson, R.L., Byrne, J.J., Viant, M.R., Widdicombe, S. & Rundle, S.D. (2017). Regional adaptation defines sensitivity to future ocean acidification. Nature Communications, 8: 1–10.
- Chisholm, J.R.M. & Gattuso, J. (1991). Validation of the alkalinity anomaly technique for investigating calcification of photosynthesis in coral reef communities. Limnology and Oceanography, 36: 1232–1239.
- Coull, B.C. & Wells, J.B.J. (1983). Refuges from fish predation – experiments with phytal meiofauna from the New Zealand rocky intertidal. Ecology, 64: 1599–1609.
- CSL Computer Service Langenbach GmbH. (2019). Online Tides and Currents Predictions. Retrieved from: https://tides.mobilegeographics.com/.
- Davenport, J., Butler, A. & Cheshire, A. (1999). Epifaunal composition and fractal dimensions of marine plants in relation to emersion. Journal of the Marine Biological Association of the United Kingdom, 79: 351–355.
- Dayton, P.K. (1972). Toward an understanding of community resilience and the potential effects of enrichments to the benthos at McMurdo Sound, Antarctica. Proceedings of the Colloquium on Conservation Problems in Antarctica. Allen Press, Lawrence, KS.
- Dickson, A.G. (2007) Guide to Best Practices for Ocean CO2 Measurement. Sidney, British Columbia, North Pacific Marine Science Organization.
- Digby, P.S.B. (1977). Growth and calcification in the coralline algae, Clathromorphum circumscriptum and Corallina officinalis, and the significance of pH in relation to precipitation. Journal of the Marine Biological Association of the United Kingdom, 57: 1095–1109.
- Eckert, C.G., Samis, K.E. & Lougheed, S.C. (2008). Genetic variation across species’ geographical ranges: the central–marginal hypothesis and beyond. Molecular Ecology, 17: 1170–1188.
- Egilsdottir, H., Noisette, F., Noel, L.M.-L.J., Olafsson, J. & Martin, S. (2013). Effects of pCO2 on physiology and skeletal mineralogy in a tidal pool coralline alga Corallina elongata. Marine Biology, 160: 2103–2112.
- Egilsdottir, H., Olafsson, J. & Martin, S. (2016). Photosynthesis and calcification in the articulated coralline alga Ellisolandia elongata (Corallinales, Rhodophyta) from intertidal rock pools. European Journal of Phycology, 51: 59–70.
- Gaston, K.J. (2009). Geographic range limits: achieving synthesis. Proceedings of the Royal Society B, 276: 1395–1406.
- Grahame, J. & Hanna, F.S. (1989). Factors affecting the distribution of the epiphytic fauna of Corallina officinalis (L.) on an exposed rocky shore. Ophelia, 30: 113–129.
- Guiry, M.D. & Guiry, G.M. (2021). AlgaeBase. World-wide electronic publication, National University of Ireland, Galway. https://www.algaebase.org; searched on April 4, 2022.
- Hofmann, G.E., Evans, T.G., Kelly, M.W., Padilla-Gamiño, J.L., Blanchette, C.A., Washburn, L., Chan, F., McManus, M.A., Menge, B.A., Gaylord, B. & Hill, T.M. (2014). Exploring local adaptation and the ocean acidification seascape-studies in the California Current Large Marine Ecosystem. Biogeosciences, 11: 1053–1064.
- Hofmann, L., Yildiz, G., Hanelt, D. & Bischof, K. (2012). Physiological responses of the calcifying rhodophyte, Corallina officinalis (L.), to future CO2 levels. Marine Biology, 159: 783–792.
- IBM Corporation (2016). IBM SPSS Statistics for Windows, Version 25.0. (software). IBM Corporation, Armonk, NY.
- Johansen, H.W. (1981). Coralline Algae, A First Synthesis. CRC Press, Boca Raton, FL.
- Kelaher, B.P., Chapman, M.G. & Underwood, A.J. (2001). Spatial patterns of diverse macrofaunal assemblages in coralline turf and their associations with environmental variables. Journal of the Marine Biological Association of the United Kingdom, 81: 917–930.
- Kelaher, B.P., Underwood, A.J. and Chapman, M.G. (2003). Experimental transplantations of coralline algal turf to demonstrate causes of differences in macrofauna at different tidal heights. Journal of Experimental Marine Biology and Ecology, 282: 23–41.
- Kolzenburg, R., D’Amore, F., McCoy, S.J. & Ragazzola, F. (2021). Marginal populations show physiological adaptations and resilience to future climatic changes across a North Atlantic distribution. Environmental and Experimental Botany, 188: p.104522.
- Kolzenburg, R., Nicastro, K.R., McCoy, S.J., Ford, A.T., Zardi, G.I. & Ragazzola, F. (2019). Understanding the margin squeeze: differentiation in fitness‐related traits between central and trailing edge populations of Corallina officinalis. Ecology and Evolution, 9: 5787–5801.
- Liuzzi, M.G. & Gappa, J.L. (2008). Macrofaunal assemblages associated with coralline turf: species turnover and changes in structure at different spatial scales. Marine Ecology Progress Series, 363: 147–156.
- Martin, S., Cohu, S., Vignot, C., Zimmerman, G. & Gattuso, J.P. (2013). One‐year experiment on the physiological response of the Mediterranean crustose coralline alga, Lithophyllum cabiochae, to elevated pCO2 and temperature. Ecology and Evolution, 3: 676–693.
- Martínez, B., Arenas, F., Rubal, M., Burgués, S., Esteban, R., García-Plazaola, I., Figueroa, F.L., Pereira, R., Saldaña, L., Sousa-Pinto, I. & Trilla, A. (2012). Physical factors driving intertidal macroalgae distribution: physiological stress of a dominant fucoid at its southern limit. Oecologia, 170: 341–353.
- Martone, P.T., Alyono, M. & Stites, S. (2010). Bleaching of an intertidal coralline alga: untangling the effects of light, temperature, and desiccation. Marine Ecology Progress Series, 416: 57–67.
- Mayr, E. (1963). Animal Species and Evolution. Harvard University Press, MA.
- McCoy, S.J. (2013). Morphology of the crustose coralline alga Pseudolithophyllum muricatum (Corallinales, Rhodophyta) responds to 30 years of ocean acidification in the Northeast Pacific. Journal of Phycology, 49: 830–837.
- McCoy, S.J. & Widdicombe, S. (2019). Thermal plasticity is independent of environmental history in an intertidal seaweed. Ecology and Evolution, 9: 13402–13412.
- Mortensen, J. (2019). Oceanography. HAFRANNSÓKNASTOFNUN – Marine Research Institute, Iceland, Hydrographic Dept. https://sjora.hafro.is/.
- Nelson, W.A. (2009). Calcified macroalgae – critical to coastal ecosystems and vulnerable to change: a review. Marine and Freshwater Research, 60: 787–801.
- Noël, L.M.L.J., Hawkins, S.J., Jenkins, S.R. & Thompson, R.C. (2009). Grazing dynamics in intertidal rockpools: connectivity of microhabitats. Journal of Experimental Marine Biology and Ecology, 370: 9–17.
- Noisette, F. & Hurd, C. (2018). Abiotic and biotic interactions in the diffusive boundary layer of kelp blades create a potential refuge from ocean acidification. Functional Ecology, 32: 1329–1342.
- Parmesan, C., Ryrholm, N., Stefanescu, C., Hill, J.K., Thomas, C.D., Descimon, H., Huntley, B., Kaila, L., Kullberg, J., Tammaru, T. & Tennent, W.J. (1999). Poleward shifts in geographical ranges of butterfly species associated with regional warming. Nature, 399: 579–583.
- Parmesan, C. & Yohe, G. (2003). A globally coherent fingerprint of climate change impacts across natural systems. Nature, 421: 37–42.
- Pearson, G.A., Lago‐Leston, A. & Mota, C. (2009). Frayed at the edges: selective pressure and adaptive response to abiotic stressors are mismatched in low diversity edge populations. Journal of Ecology, 97: 450–462.
- Platt, T.G., Gallegos, C.L. & Harrison, W.G. (1980). Photoinhibition of photosynthesis in natural assemblages of marine phytoplankton. Journal of Marine Research, 38: 687–701.
- Platt, T.G. & Jassby, A.D. (1976). The relationship between photosynthesis and light for natural assemblages of coastal marine phytoplankton. Journal of Phycology, 12: 421–430.
- R Development Core Team. (2017). R: A Language and Environment for Statistical Computing. The R Foundation for Statistical Computing, Vienna. Available at https://www.R-project.org/.
- Ragazzola, F., Foster, L.C., Form, A.U., Büscher, J., Hansteen, T.H. & Fietzke, J. (2013). Phenotypic plasticity of coralline algae in a high CO2 world. Ecology and Evolution, 3: 3436–3446.
- Ragazzola, F., Marchini, A., Adani, M., Bordone, A., Castelli, A., Cerrati, G., Kolzenburg, R., Langeneck, J., Di Marzo, C., Nannini, M., Raiteri, G., Romanelli, E., Santos, M., Vasapollo, C., Pipitone, C. and Lombardi, C. (2021). An intertidal life: combined effects of acidification and winter heatwaves on a coralline alga (Ellisolandia elongata) and its associated invertebrate community. Marine Environmental Research, 169: 105342.
- Rothäusler, E., Rugiu, L. & Jormalainen, V. (2018). Forecast climate change conditions sustain growth and physiology but hamper reproduction in range-margin populations of a foundation rockweed species. Marine Environmental Research, 141, 205–213.
- Sagarin, R.D. & Gaines, S.D. (2002). The ‘abundant centre’ distribution: to what extent is it a biogeographical rule? Ecology Letters, 5: 137–147.
- Sagarin, R.D. & Gaines, S.D. (2006). Recent studies improve understanding of population dynamics across species ranges. Oikos, 115: 386–388.
- Sagarin, R.D., Gaines, S.D. & Gaylord, B. (2006). Moving beyond assumptions to understand abundance distributions across the ranges of species. Trends in Ecology and Evolution, 21: 524–530.
- Schubert, N., Hofmann, L.C., Almeida Saá, A.C., Moreira, A.C., Arenhart, R.G., Fernandes, C.P., de Beer, D., Horta, P.A. & Silva, J. (2021). Calcification in free-living coralline algae is strongly influenced by morphology: implications for susceptibility to ocean acidification. Scientific Reports, 11: 1–14.
- Smith, S.V. & Key, G.S. (1975). Carbon dioxide and metabolism in marine environments. Limnology and Oceanography, 20: 493–495.
- Steneck, R.S. (1986). The ecology of coralline algal crusts: convergent patterns and adaptative strategies. Annual Review of Ecology, Evolution, and Systematics, 17: 273–303.
- Tavares, A.I., Nicastro, K.R., Kolzenburg, R., Ragazzola, F., Jacinto, R. & Zardi, G.I. (2018). Isolation and characterisation of nine microsatellite markers for the red alga Corallina officinalis. Molecular Biology Reports, 45: 2791–2794.
- Viejo, R.M., Martínez, B., Arrontes, J., Astudillo, C. & Hernández, L. (2011). Reproductive patterns in central and marginal populations of a large brown seaweed: drastic changes at the southern range limit. Ecography, 34: 75–84.
- Whittaker, R.H. (1956). Vegetation of the Great Smoky Mountains. Ecological Monographs, 26: 1–80.
- Williamson, C.J., Brodie, J., Goss, B., Yallop, M., Lee, S. & Perkins, R. (2014). Corallina and Ellisolandia (Corallinales, Rhodophyta) photophysiology over daylight tidal emersion: interactions with irradiance, temperature and carbonate chemistry, Marine Biology, 161: 2051–2068.
- Williamson, C.J., Perkins, R., Voller, M., Yallop, M.L. & Brodie, J. (2017). The regulation of coralline algal physiology, an in situ study of Corallina officinalis (Corallinales, Rhodophyta). Biogeosciences, 14: 4485–4498.
- Wilson, S., Blake, C., Berges, J.A. & Maggs, C.A. (2004). Environmental tolerances of free-living coralline algae (maerl): implications for European marine conservation. Biological Conservation, 120: 279–289.
- Yesson, C., Jackson, A., Russell, S., Williamson, C.J. & Brodie, J. (2018). SNPs reveal geographical population structure of Corallina officinalis (Corallinaceae, Rhodophyta). European Journal of Phycology, 53: 180–188.