Abstract
Background: Production and use of no- and low-alcohol (NoLo) beverages has increased globally in recent years. Using data from a large international sample of people who drink alcohol, this study aimed to investigate patterns of NoLo drink consumption. Methods: The study utilized data from the 2022 Global Drug Survey (GDS). We used cross-tabulation and multiple correspondence analysis to understand usage patterns and identify key groupings. Results: Of the 15,686 participants reporting NoLo use, most (59%) reported drinking NoLo products less than monthly. Frequent NoLo consumption was more prevalent in relaxed environments (92%) compared to team environments (27%) and party settings (49%), with a significant relationship between heavy alcohol drinking prevalence and increased likelihood of engaging in NoLo alcohol consumption. Conclusions: We uncovered nuanced preferences for NoLo drinks driven by cultural, consumption, and economic factors. Heavy alcohol drinking and an increased likelihood of NoLo consumption is suggestive of a growing acceptance of NoLo beverages as substitutes for alcoholic beverages perhaps, for example, as a response to avoiding experiences of embarrassment due to drunkenness in particular social settings. This suggests a need for further research into public health policies promoting NoLo options to mitigate alcohol-related problems.
Introduction
Alcohol consumption is typically motivated by several complex, interacting factors, associated with both positive and negative outcomes (Babor et al., Citation2023). From a social perspective, alcohol reinforces social bonds, enhances community engagement, and triggers the endorphin system (Allan et al., Citation2012; Halim et al., Citation2012; Davidson et al., Citation2022), and often plays a role in celebrating significant life events such as births, deaths, graduations, and marriages, as well as social functions (Roche et al., Citation2015). However, alcohol remains a significant contributor to the economic burden of mortality and morbidity, increasing the risk of preventable illnesses (e.g., cancers, heart disease, liver disease), fatalities (Griswold et al., Citation2018; Mellinger, Citation2019; Rehm et al., Citation2019; Suh et al., Citation1992), as well as social harms such as hospitalizations, accidents, violence, homicides, and suicides (Bushman, Citation2002; Ferris et al., Citation2021; Gilmore et al., Citation2016; Koelega, Citation1995; Miller et al., Citation2010, Citation2021). The most recent Global Burden of Disease study on alcohol found that alcohol use accounts for 2.2% of age-standardised female deaths and 6.8% of male deaths, underscoring its role as a risk factor (Griswold et al., Citation2018). Notably, this research indicates that the optimal level of alcohol consumption for mitigating adverse health outcomes is nil (Griswold et al., Citation2018).
Within the landscape shadowed by the repercussions of alcohol consumption, a novel frontier has emerged—one characterized by the proliferation of products that appear similar to alcohol products but have no- or low-alcohol content, so-called ‘NoLo’ products. No-alcohol products have some variation in their definition across different countries, with alcohol-by-volume (ABV) percentages ranging from ≤0.5% in most countries to ≤2.25% in Iceland and ≤2.8% Finland (Okaru & Lachenmeier, Citation2022). Based on their review on current definitions, Okaru and Lachenmeier (Citation2022) suggest that no-alcohol beverages should be defined as products that contain no more than 0.5% ABV while low-alcohol products contain between 0.5-1.2% ABV. Despite differences between availability and legal distinctions between low-alcohol, de-alcoholized, and alcohol-free products across countries (Okaru & Lachenmeier, Citation2022), there has been substantial growth in the NoLo market over the past decade (Andersen et al., Citation2021; Corfe et al., Citation2020; Llopis et al., Citation2021). For example, in 2020, the NoLo products sector expanded by over 6% in volume across ten major global markets (Australia, Brazil, Canada, France, Germany, Japan, South Africa, Spain, the United Kingdom, and the United States of America), securing a 3.5% stake in the global alcohol market (Corfe et al., Citation2020). Projections suggest that the volume share of NoLo products will grow by 8% between 2021 and 2025, in contrast to the modest estimated growth of 0.7% for conventional alcohol products during the same period (IWSR, Citation2022). In addition to the possible health benefits of consuming a NoLo beverage instead of an alcoholic beverage, these products also have appeal for mimicking alcohol’s role in easing social bonding (Atkinson et al., Citation2023; Shaw et al., Citation2023). For example, while some studies suggest that NoLo beverages could aid individuals in reducing their consumption of more ‘potent’ alcoholic beverages through substitution (Rehm et al., Citation2016), contrasting perspectives contend that these products might contribute to the normalization of alcohol culture and potentially foster a heightened affinity for alcohol, particularly within demographic groups susceptible to escalated consumption risks (Nicholls, Citation2023).
Due to NoLo products’ relatively recent introduction to the commercial market, there is limited research on patterns of NoLo use, especially in countries such as Australia, where NoLo products have only been widely available for a few years (Miller et al., Citation2022). A recent systematic review encompassing 10 studies explored the potential for NoLo drinks to mitigate the alcohol burden among individuals with alcohol use disorder, revealing that consumption of NoLo beverages might heighten alcohol cravings for this subgroup (Caballeria et al., Citation2022). Additionally, the review observed that heavy drinkers might incorporate NoLo drinks alongside their existing alcohol consumption, rather than as an alternative, a concern shared by other scholars in this space (Miller et al., Citation2022, 2023). In contrast, recent UK-based research has scrutinized the marketing and consumption of NoLo drinks, revealing industry efforts to position these products within novel contexts, such as associations with healthy lifestyles and physical activity (Nicholls, 2022, Citation2023). Ultimately, however, global insights into NoLo consumer profiles, reasons, and consumption contexts, influencing NoLo trends remain underexplored. Here we draw on concepts of ‘set and setting’ as a conceptual framework to further understand the NoLo context.
Theoretical framing
Set and setting encompass the psychological, social, and cultural factors that influence an individual’s reaction to substances (Zinberg, Citation1984); a concept often used to underscore the importance of an individual’s mindset (‘set’) or environment (‘setting’) when using drugs, for example, psychedelics (Kopra et al., Citation2022a, Citation2022b). Specifically, set refers to the reasons or ‘the attitude of the person at the time of use’ (p. 5) (Zinberg, Citation1984). Setting comprises both the physical conditions and social context of substance use (Zinberg, Citation1984). Additionally, it encompasses the influence of other individuals present during consumption, such as how a friend’s adverse mood or encounters can impact an individual’s drug experience (Jansen, Citation1997). These concepts have been employed to elucidate the non-pharmacological determinants that mold the outcomes of various substances, encompassing alcohol, heroin, amphetamines, and cocaine (Dalgarno & Shewan, Citation2005; Hartogsohn, Citation2017; Lamonica et al., Citation2021; McElrath and McEvoy, Citation2002). To clarify the concept of ‘set’ in our current context, we aimed to broaden its operationalization to include a wider array of psychological factors. This encompassed not only emotional states but also motivations, expectations, and attitudes. This broader interpretation aligns with traditional set theory, which emphasizes the multifaceted nature of an individual’s mindset and its influence on drug experiences. Meanwhile, ‘setting’ includes the physical and social conditions surrounding NoLo consumption, incorporating factors such as the environment, social interactions, and cultural context that influence individuals’ experiences with these beverages. This conceptual framework allows us to explore the non-pharmacological determinants shaping the outcomes of NoLo consumption, contributing valuable insights for harm reduction strategies and informed policy decisions.
The present study
The potential harm-reduction benefits of consuming NoLo beverages may be realized when such choices contribute to a reduction in overall alcohol consumption. However, caution is warranted, as the normalization of non-alcoholic alternatives might inadvertently foster increased alcohol consumption by creating an environment where alcohol is perceived as ubiquitous. Therefore, this research had two distinct aims: firstly, to provide a detailed profile of NoLo drink consumption, and secondly, to explore the set and setting associated with this consumption among respondents of the 2022 Global Drug Survey.
Methods
Sample and procedure
Data were drawn from the 2022 Global Drug Survey (GDS2022), an annual, anonymous, online survey undertaken in collaboration with media partners from around the world. The GDS’s methods, including recruitment practices, have previously been described in detail (Barratt et al., Citation2017; Winstock, Citation2022; Winstock et al., Citation2022). Briefly, respondents were recruited through survey promotion via international media partners and collaborating examples include ZeitOnline, TimeOut in Melbourne, and Sydney, as well as via social platforms such as Bluelight.org, Facebook, LinkedIn, and Twitter. Respondents read and completed an online participant information consent form and were not provided with any financial incentives for completing the survey. The study received ethical approval from the University College London (11671/001), ratified by The University of Queensland (2021/HE002304) and RMIT University (2020-23913-11758).
Individuals were eligible to complete the survey if they were aged 16 years or over and used at least one drug (including alcohol or tobacco) in the past 12 months. The survey was completely anonymous; no IP address details or other potentially identifying information (names, date of birth, addresses, etc.) were collected. Depending on a respondent’s drug use history, the survey took between 20 and 50 min to complete.
Out of 55,461 eligible individuals from 185 countries who responded to the GDS2022 survey between 9 November 2021 and 14 March 2022, data were analyzed from respondents aged 16–65 years who reported ever consuming NoLo beverages. Age was limited to an upper limit of 65 years as the number of respondents ages greater than 65 was often small (or 0) this can lead to unstable coefficients and inflated standard errors for the age variable. This resulted in a total sample size of 20,473 individuals from 26 countries (i.e., Australia, Austria, Belgium, Brazil, Canada, Colombia, Denmark, Finland, France, Germany, Hungary, Ireland, Italy, Mexico, Netherlands, New Zealand, Norway, Poland, Portugal, Spain, Sweden, Switzerland, United Kingdom, United States). The analysis focused on respondents who indicated consuming NoLo products at any point, representing N = 20,473. From this, participants who answered questions regarding relative consumption, set, and setting per typical NoLo drinking occasion (N = 15,072) were included in subsequent analyses. When respondents reported ‘not applicable’ or did not provide an answer to the items, data were treated as missing values. As this study is exploratory, missing data were addressed through listwise deletion.
Measures
Aim 1
The study collected demographic information, including age, gender, and the year respondents first tried NoLo products, along with their alcohol consumption status. To mitigate recall bias, respondents were specifically asked to provide information related to NoLo beverages and consumption patterns within the last 12 months. Please see Appendix A for more detailed information.
Aim 2
Set and setting
Participants were asked about the extent to which they drink NoLo products relative to alcohol products on an occasion when NoLo products are consumed. Please see Appendix A for more detailed information. For the assessment of set and setting in the context of NoLo beverage consumption, respondents responded to specific items as outlined in . These items included inquiries regarding the overarching psychological, social, and cultural factors influencing their experiences with NoLo beverages. For instance, participants were asked about their emotional state, motivations, and expectations during NoLo beverage consumption, capturing the concept of ‘set’. Additionally, ‘setting’ aspects were explored, encompassing the physical and social conditions surrounding NoLo beverage use. Examples of setting-related inquiries included the presence and mood of others during consumption. The full list of set and setting items is detailed in .
Table 3. Relative consumption, set, and setting per typical NoLo drinking occasion (N = 15,072).
Analysis
To address aim 1 the mean, count, and percentage of respondent socio-demographic characteristics were calculated for people who have ever consumed NoLo products. To address aim 2 multiple correspondence analysis (MCA) was undertaken for respondents’ multi-choice responses to set (reasons) and setting (place and people) to identify key groupings related to respondents’ NoLo consumption behavior relative to drinking beverages containing alcohol. MCA is an analytical technique that utilizes contingency or cross-tabulation tables to construct discernible visual patterns of relationships between multiple response categorical variables (for this analysis—set and setting questions) overlayed with groups of interest (i.e., NoLo use). MCA identifies underlying structures within the data drawing on the principals of Principal Component Analysis (i.e., data or dimensional reduction) but with categorical data. The dimensional mapping of MCA is achieved through the mathematics of chi-square distancing to maximize differences between data cells (Abdi and Béra, Citation2014); data that clusters together are associated (Greenacre and Blasius, Citation2006; Greenacre, Citation1991) and these maps or plots help reveal patterns and associations in the data. All data preparation and analyses were conducted using Stata 18 (StataCorp, Citation2023).
Results
Aim 1
In , the demographic characteristics of individuals who reported ever consuming NoLo products are presented. Among the 20,473 participants, the mean age was 35.8 years (SD = 12.03; median = 34; inter-quartile range 26–44). Respondents aged between 16 and 35 years accounted for 55.6% of all individuals who had ever consumed NoLo beverages, while respondents aged between 56 and 65 years comprised 8.6% of the sample. The sample typically identified as cis-male (59.6%; 12,192) or cis-female (38.1; 7,79, while a smaller proportion (2.3%; 472) identified as non-binary. Almost 90% (n = 18383) of respondents indicated that they had consumed alcohol within the last 12 months; less than 5% (n = 747) indicated they had never drunk alcohol. While the majority of respondents reported first consuming NoLo beverages before 2015 (51.0%; 10090), 1 in 10 of the sample (9.8%; 1947) indicated only recently trying NoLo beverages for the first time (since 2021).
Table 1. GDS demographic characteristics of people who ever consumed NoLo beverages
describes the types of NoLo products consumed based on alcohol by volume percentage and beverage type: 54.1% (n = 11076) had consumed low alcohol products (defined in the survey as ≤1.2% ABV), 52.2% had consumed dealcoholized products (≤0.5% ABV) and 68.3% (n = 13986) had consumed alcohol-free products (≤0.05% ABV). Only 2.3% (n = 349) of the sample indicated drinking NoLo beverages on a daily (or almost daily) basis; an additional 11.9% (n = 1806) indicated drinking NoLo beverages at least weekly. Based on 15,072 respondents – beer (84.5%; 12737) was the most common NoLo beverage consumed in the last 12 months; then wine (36.2%; 5454), cider (23.0%; 3460) and then spirits (14.4%; 2167). Almost five percent of the sample reported other types of NoLo beverages. When asked to indicate what type of other NoLo beverages respondents had consumed responses included drinks like fermented lemonade, alcohol-free cocktails, lemon-lime and bitters, and alcohol-free premixed drinks. The majority of respondents reported consuming one to two NoLo beverages per sitting (80.6%; 11730); less than 5% indicated consuming five or more NoLo beverages per sitting.
Table 2. Types of NoLo products consumed by alcohol-by-volume percentage (ever) and by beverage type (last 12 months).
Aim 2
describes respondents’ consumption of NoLo beverages relative to alcoholic beverages, as well as NoLo drinking set (reason) and setting (location and socialization) responses. On a typical drinking occasion, 41.5% (n = 6038) of the sample indicated drinking only NoLo products; a further 25.8% (n = 3764) indicated drinking mostly NoLo products (but with some alcohol products at the same time). Only 7.6% (n = 1102) of respondents indicated drinking one NoLo product in a sitting while the rest of the beverages consumed were alcohol-based. Concerning set and setting—the why, where, and with whom—in which NoLo drinking may occur, most respondents were able to indicate more than one response. Concerning the set, the reasons for NoLo drinking, the median number of reasons why respondents reported NoLo drinking in the last 12 months was two (with an interquartile range [IQR] between 1 and 3). Of the 12 reasons, respondents most commonly reported drinking NoLo beverages to avoid getting drunk (51.5%; 7502), followed by a desire to stay safe while driving (43.7%; 6364), or because they like the taste of NoLo products (35.8%; 5207). Less than a third of respondents (31.6%; 4598) described drinking NoLo beverages for mental or physical health reasons, and 3.1% (n = 455) indicated the reason was pregnancy-related.
Concerning setting—in a particular location—the median number of locations where respondents reported NoLo drinking was three (IQR: 1–4). Of the 11 locations, respondents commonly reported the consumption of NoLo products was associated with drinking occasions that involved relaxing at home (53.3%; 7760) or socializing with friends/family during the daytime (52.2%; 7604) or evening (47.5%; 6913). Approximately one-third of respondents indicated drinking NoLo products at house parties (35.6%; 5185) or special events (such as weddings or birthdays; 32.8%; 4781). It was less common for respondents to report drinking NoLo beverages when attending sporting events (either as a spectator (13.3%; 1937) or participant (8.0%; 1161) or work-related lunches (11.9%; 1734), meetings (7.9%; 1149) or evening events (20.7%). Finally, concerning setting—in particular, socialization—257 respondents indicated all six response socialization options. The median number of different socialization groups reported by respondents with whom NoLo drinking occurs was 2 (IQR: 1–3). Of the six groups, respondents most commonly reported the consumption of NoLo products was associated with drinking with friends (67.6%; 9839), family (59.7%; 8689), or partners (46.0%; 6695). Less than one-third of respondents indicated drinking NoLo beverages when drinking alone (30.5%; 4446); drinking NoLo beverages with sports colleagues was the most uncommon (7.2%; 1054).
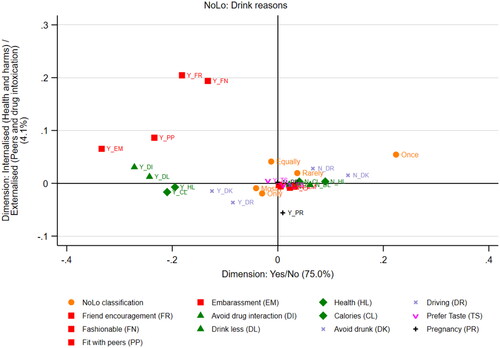
depicts responses to set, the reasons for which people indicate drinking NoLo products (Please see Appendix B for assistance with justification and interpretation). The MCA analysis revealed two main dimensions explaining 80% of the data variation. Dimension 1 separated responses based on ‘yes’ or ‘no’ answers to twelve options, while Dimension 2 grouped reasons into externalized and internalized categories. Externalized reasons, like peer influence, were common among those reporting ‘equally’ or ‘rarely’ consuming NoLo products, while internalized reasons, such as health concerns, were prevalent among those reporting ‘mostly’ or ‘only’ NoLo consumption. Pregnancy as a reason for NoLo consumption was rare, while taste was associated with higher NoLo consumption.
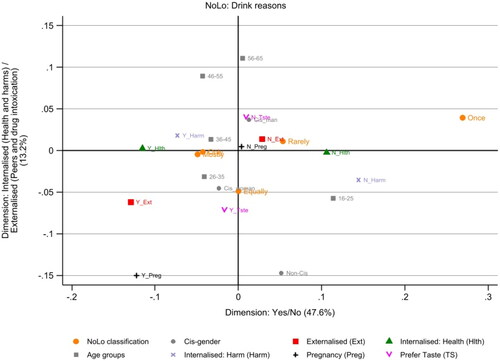
Figure 1. MCA plot representing set or reasons for drinking NoLo products and consumption of NoLo products relative to alcohol products.
To explore differences by respondents’ sex and age are associated with the 12 set response options we reduce the options to the four main groupings: externalization (red squares), internalization-health and harms (green triangles and diamonds), pregnancy (black cross) and taste (magenta V). Age is grouped into 10-year bands (e.g., 16–25; 25–35; grey small squares) and gender is defined as cis-male, cis-female, and trans, non-binary, or intersex (non-cis; grey small circles). (see Appendix C), highlights that the younger cis-women are respondents most likely to report the consumption of NoLo products relative to alcohol products was equally, mostly, or only NoLo products. For this group the set or reason to drink NoLo products is taste and externalization factors; unsurprising reasons related to pregnancy are also offered by this group. Conversely, cis-men are more likely to report the consumption of NoLo products relative to alcohol products was rarely or only once NoLo products in a sitting. The reason most associated with younger cis-men was related to internalized health or harm. For cis-men, 46 years and older internalized harm over internalised health is the main reason offered. While the number of non-cis respondents was small (3.0%; n = 429) this group tends to report the consumption of NoLo products relative to alcohol products was equally NoLo products and taste is the dominant reason for consuming NoLo products.
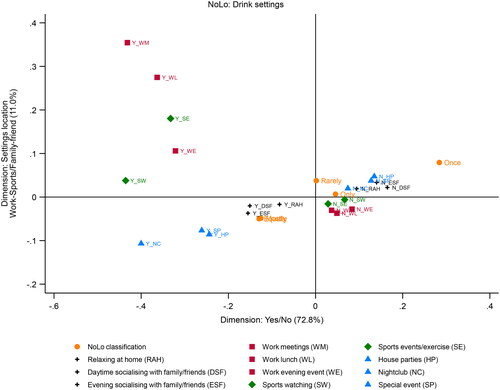
illustrates responses to setting location for drinking NoLo products, with two dimensions accounting for 83.8% of the data variation. Respondents reported that ‘rarely’ or ‘once’ consuming NoLo products are positioned above the X-axis, indicating a preference for work or sports settings. Conversely, settings revolving around family or friends are associated with ‘mostly’ or ‘equally’ NoLo consumption. Those reporting ‘only’ drinking NoLo products show no clear association with specific settings.
Figure 2. MCA plot representing setting-location where drinking NoLo products and consumption of NoLo products relative to alcohol products.
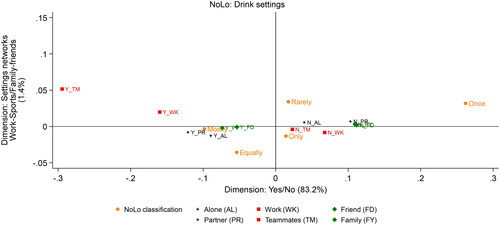
illustrates responses to setting socialization networks for drinking NoLo products. The two dimensions account for nearly 84.6% of the data variation. Those reporting ‘rarely’ or ‘once’ consuming NoLo products tend to do so with work or sports colleagues. In contrast, those reporting ‘mostly’ or ‘equally’ NoLo consumption typically drink alone, with their partner, or with other family members.
Figure 3. MCA plot representing setting-socialisation networks where drinking NoLo products and consumption of NoLo products relative to alcohol products.
Discussion
The first aim of this study was to understand the consumption patterns of NoLo beverages, thus, yielding a comprehensive profile. Beer emerged as the most favored NoLo beverage, with 84.5% reporting its consumption. In addressing our second aim, we employed MCA to explore the associations between set and setting. The reasons for NoLo consumption relative to alcohol consumption can be broadly categorized into three domains: externalized or social influences, internalized health choices, and avoidance of negative effects reasons. The externalized social influences highlight the influence of friends or peer interactions and societal trends (fashionable) and people who provide these reasons tend to report, in a given sitting, an equal split between NoLo products and alcohol products. While the data highlights the group of externalized reasons, there is evidence to suggest that the percentage of respondents reporting these reasons ranges between 1.5 and 8.9%. These externalized influences group together but are not common reasons for NoLo consumption. The health choices set—such as mental or physical health, calorie consumption, reducing the volume of alcohol consumed, or avoiding negative experiences related to polydrug use interactions—appears to be a common mindset influencing the NoLo consumption relative to alcohol consumption, especially for people who reported ‘equally’, ‘mostly’ or ‘only’ NoLo products. Among the four health reasons (see green symbols in ) the percentage of people reporting these reasons ranged from 31.6% for mental/physical health reasons and 16.3% for calorie consumption to 7.4% for avoiding interactions with other drugs. The last set—avoiding the negative effects of alcohol—captured the most common responses. This includes avoiding getting drunk (51.5%) and to stay safe while driving (43.7%). These reasons were typically reported for those who reported ‘mostly’ or ‘only’ consuming NoLo products over alcohol products and it suggests that specifically avoiding getting drunk or avoiding alcohol-related traffic incidents are key drivers when it comes to an individual’s reason for NoLo consumption.
The findings yield valuable insights into the contextual dynamics of NoLo drinking. Notably, NoLo consumption was less common in settings traditionally associated with alcohol consumption, such as bars or nightclubs. This suggests a potential shift in drinking behaviors, with individuals increasingly opting for NoLo beverages in settings where alcohol consumption may have been more prevalent in the past. For instance, the choice of NoLo in nightclub and party scenarios might reflect a desire to align with social norms (Davidson et al., Citation2022) while mitigating alcohol-related risks. By comparing the settings where respondents typically consume NoLo beverages with those where they typically consume alcohol, we gain insight into how NoLo is fitting into traditional drinking occasions or moving into ‘sober spaces’. For example, the prevalence of NoLo consumption in work and sports settings may indicate a growing preference for sobriety in professional or athletic environments. Similarly, the high frequency of NoLo consumption during social gatherings at home or with family and friends suggests that NoLo beverages are becoming a popular choice for individuals seeking alternatives to traditional alcoholic drinks in familiar, relaxed settings (Atkinson et al., Citation2023; Shaw et al., Citation2023), potentially influenced by heightened awareness during the pandemic (Neill et al., Citation2020). NoLo consumption could also be motivated by factors beyond financial considerations, such as intentions to curtail alcohol intake (Nicholls, Citation2023). However, the non-significant connection with the indicators of prevalence of drinkers, but significant among heavy drinkers suggests that those engaging in NoLo drinking may constitute a distinct subset from those who consume alcohol. This differentiation might be rooted in the preference for NoLo consumption in settings outside bars and nightclubs, which are conventionally associated with alcohol consumption (Tutenges and Bøhling, Citation2019). Addressing the recognition of NoLo consumption occurring predominantly outside traditional alcohol-oriented settings highlights the importance of tailoring policies to these distinctive consumption patterns, potentially requiring novel regulatory approaches that differentiate between alcohol and NoLo beverages. Further research into the motivations underlying NoLo consumption and its impact on drinking habits and social norms can provide valuable insights for public health initiatives and alcohol policy development. Additionally, exploring the intersection between NoLo consumption and traditional drinking occasions can help inform strategies for promoting responsible alcohol consumption and reducing alcohol-related harm in diverse social contexts.
The potential of an expanding market for NoLo products to effectively mitigate the negative consequences of alcohol consumption is a topic of current contention (Miller et al., Citation2022; Nicholls, 2022, Citation2023). Some scholars have suggested these consequences may be constrained if substantial segments of the population do not view these alternatives as viable substitutes (Atkinson et al., Citation2023; Nicholls, Citation2023; Shaw et al., Citation2023). However, preceding work has utilized data that predominantly captured the perspectives of actively engaged NoLo consumers who, therefore, hold distinct opinions about these products which they may have been eager to express (Atkinson et al., Citation2023; Nicholls, Citation2023). As a result, these viewpoints may not necessarily be representative of the broader population and might not encompass the experiences of individuals who simultaneously use NoLos while engaging in heavy alcohol consumption, as the present research has elucidated. Therefore, in this context, the experiences of those who are most susceptible to alcohol-related harm or those who grapple with complex relationships with alcohol might find themselves exposed to the compelling marketing and assurances surrounding NoLo beverages. The practical outcome may be that these individuals are still at risk of succumbing to the detrimental health repercussions associated with alcohol, despite the appealing prospects presented by NoLo products, as suggested by Miller et al. (Citation2022). Therefore, if the promotion of NoLo beverages is to, indeed, offer a partial remedy for the urgent issue of alcohol-related harm (Griswold et al., Citation2018), it must be complemented by comprehensive strategies such as education related to enhancing ‘alcohol literacy’. This distinction becomes especially pertinent if, as the present study indicates, individuals at the highest risk of excessive drinking may be more likely to uptake NoLo beverages into their consumption patterns. We call for further research to interrogate these relationships more fully and provide appropriate scaling and integration to alcohol policy.
Limitations
Our survey stands out for its ability to gather a large sample of NoLo consumers across multiple countries, a task not feasible or practical with probability sampling methods (Barratt et al., Citation2017). We collected data through self-reporting, acknowledging potential biases related to recollection and social desirability. However, anonymous web surveys without payment incentives offer a more favorable environment for participants to disclose sensitive information (Kays et al., Citation2013). Furthermore, recent systematic research indicates that self-reported data can reliably predict drug use when corroborated with biological markers, suggesting its validity (Bharat et al., Citation2023). We note our data are cross-sectional, limiting our ability to establish causal relationships due to the inability to determine temporal precedence. The GDS exhibits biases towards certain demographics, including individuals who are male, younger, white, and more educated. This demographic skew could potentially influence the generalizability of our findings to broader populations. Moreover, GDS respondents are required to have used at least one substance (including alcohol) in the past 12 months to participate in the survey. This inclusion criterion excludes individuals who solely consume NoLo drinks and, therefore, those who use licit and illicit drugs. We also note potential limitations arising from variations in the definition of NoLo products across different jurisdictions, as consumers’ understanding of what constitutes NoLo may differ. Future research could explore whether cultural differences in NoLo consumption are adequately captured by our data or if more targeted approaches are necessary to uncover nuanced variations. Additionally, examining the potential alignment or divergence of NoLo consumption behaviors across cultures could offer valuable insights into the broader societal attitudes towards alcohol consumption and health trends.
A further potential limitation of this study is the likelihood of recall bias influencing responses related to the frequency of NoLo beverage consumption. Respondents may initially indicate past consumption within the last 12 months but, when asked about frequency, could report ‘never’ due to challenges in accurately recalling specific instances over an extended period, a phenomenon documented in illicit drug research (Hjorthøj et al., Citation2012). Further, a limitation of this study arises from the variation in how respondents perceive and categorize non-alcoholic beverages as NoLo beverages. This suggests a lack of standardized understanding within the community, potentially influencing future research outcomes due to the presence of misinformation or differing interpretations regarding what constitutes a NoLo beverage. Lastly, to better align the conceptual framework of set and setting to assess harm reduction outcomes and attitudes towards drinking, it is crucial to acknowledge the complexity of factors involved. While the study primarily focused on reasons and motivations for NoLo consumption, we recognize that the concept of set encompasses broader psychological, social, and cultural influences beyond attitudes at the time of use. Therefore, while the available variables from the GDS offer valuable insights, they may not fully capture the multifaceted nature of set and setting. To address this limitation, future research could consider incorporating additional measures to better assess the broader context and potential harm reduction effects of NoLo consumption.
Conclusions
This study provides more comprehensive understanding around the landscape of NoLo beverage consumption by revealing distinct preferences across social contexts and providing data regarding the country-level indicators of adoption patterns. The identification of significant associations between heavy drinking prevalence and NoLo consumption highlights the nuanced relationship between alcohol behavior and the adoption of NoLo beverages. As we approach the growing NoLo market and consider its potential to reduce alcohol-related harms, our findings emphasize the need for further research. This inquiry should further interrogate the changing landscape of alcohol policy, providing a more nuanced understanding.
Acknowledgments
We would like to thank the participants of the Global Drug Survey. We are grateful for the promotion of GDS by a long list of world media partners (see www.globaldrugsurvey.com).
Declaration of interest
This study did not receive any funding and the authors report no conflicts of interest. Dr Cheneal Puljević is supported by the Discovery Early Career Researcher Award from the Australian Research Council (DE230101131). Adam Winstock is the founder and owner of Global Drug Survey (GDS) Ltd, an independent data exchange hub. Jason Ferris, Emma Davies, Cheneal Puljević, and Monica Barratt are members of the GDS Core Research Team.
Additional information
Funding
References
- Abdi, H., & Béra, M. (2014). Correspondence Analysis. In A J. Rokne (Ed.), Encyclopedia of social network analysis and mining. Springer Science + Business. https://doi.org/10.1007/978-1-4614-7163-9_140-2
- Allan, J., Clifford, A., Ball, P., Alston, M., & Meister, P. (2012). ‘You’re less complete if you haven’t got a can in your hand’: Alcohol consumption and related harmful effects in rural Australia: The role and influence of cultural capital. Alcohol and Alcoholism (Oxford, Oxfordshire), 47(5), 624–629. https://doi.org/10.1093/alcalc/ags074
- Anderson, P., O'Donnell, A., Kokole, D., Jané Llopis, E., & Kaner, E. (2021). Is buying and drinking zero and low alcohol beer a higher socio-economic phenomenon? Analysis of British survey data, 2015–2018 and household purchase data 2015–2020. International Journal of Environmental Research and Public Health, 18(19), 10347. https://doi.org/10.3390/ijerph181910347
- Atkinson, A., Meadows, B., & Sumnall, H. R. (2023). ‘You’re in the alcohol Matrix, then you unplug from it, and you’re like ‘Wow’’’: exploring sober women’s management, negotiation and countering of alcohol marketing in the UK. Drugs: Education, Prevention and Policy, 31(1), 54–69. https://doi.org/10.1080/09687637.2022.2145935
- Babor, T. F., Casswell, S., Graham, K., Huckle, T., Livingston, M., Österberg, E., Rehm, J., Room, R., Rossow, I., & Sornpaisarn, B. (2023). Alcohol: No ordinary commodity-research and public policy (3rd ed.). Oxford University Press.
- Barratt, M. J., Ferris, J. A., Zahnow, R., Palamar, J. J., Maier, L. J., & Winstock, A. R. (2017). Moving on from representativeness: testing the utility of the global drug survey. Substance Abuse: Research and Treatment, 11, 1178221817716391. https://doi.org/10.1177/1178221817716391
- Bharat, C., Webb, P., Wilkinson, Z., McKetin, R., Grebely, J., Farrell, M., Holland, A., Hickman, M., Tran, L. T., Clark, B., Peacock, A., Darke, S., Li, J.-H., & Degenhardt, L. (2023). Agreement between self‐reported illicit drug use and biological samples: A systematic review and meta‐analysis. Addiction (Abingdon, England), 118(9), 1624–1648. https://doi.org/10.1111/add.16200
- Bushman, B. J. (2002). Effects of alcohol on human aggression: Validity of proposed explanations. Recent Developments in Alcoholism: Volume 13: Alcohol and Violence-Epidemiology Neurobiology Psychology Family Issues (pp. 227–243).
- Caballeria, E., Pons-Cabrera, M. T., Balcells-Oliveró, M., Braddick, F., Gordon, R., Gual, A., Matrai, S., & López-Pelayo, H. (2022). “Doctor, Can I Drink an Alcohol-Free Beer?” Low-alcohol and alcohol-free drinks in people with heavy drinking or alcohol use disorders: Systematic review of the literature. Nutrients, 14(19), 3925. https://doi.org/10.3390/nu14193925
- Corfe, S., Hyde, R., & Shepherd, J. (2020). Alcohol-free and low-strength drinks. Social Market Foundation, 95. https://www.drugsandalcohol.ie/32961/1/NoLo-drinks-and-alcohol-related-harms.pdf
- Dalgarno, P., & Shewan, D. (2005). Reducing the risks of drug use: The case for set and setting. Addiction Research & Theory, 13(3), 259–265. https://doi.org/10.1080/16066350500053562
- Davidson, L., Piatkowski, T. M., Pocuca, N., & Hides, L. (2022). Modelling the relationship between environment and cognitive factors in predicting risky drinking among young Australian adults. International Journal of Mental Health and Addiction, 1–20. https://doi.org/10.1007/s11469-022-00978-9
- Ferris, J., PuljeviĆ, C., Taylor, N., de Andrade, D., Carah, N., Coomber, K., Mayshak, R., Grant, K., & Miller, P. G. (2021). The impact of Queensland’s tackling alcohol‐fuelled violence policy on nightlife and business trade. Drug and Alcohol Review, 40(5), 746–754. https://doi.org/10.1111/dar.13271
- Gilmore, W., Chikritzhs, T., Stockwell, T., Jernigan, D., Naimi, T., & Gilmore, I. (2016). Alcohol: taking a population perspective. Nature Reviews. Gastroenterology & Hepatology, 13(7), 426–434. https://doi.org/10.1038/nrgastro.2016.70
- Greenacre, M., & Blasius, J. (2006). Multiple correspondence analysis and related methods. CRC Press.
- Greenacre, M. J. (1991). Interpreting multiple correspondence analysis. Applied Stochastic Models and Data Analysis, 7(2), 195–210. https://doi.org/10.1002/asm.3150070208
- Griswold, M. G., Fullman, N., & Hawley, C, GBD 2016 Alcohol Collaborators (2018). Alcohol use and burden for 195 countries and territories, 1990–2016: A systematic analysis for the Global Burden of Disease Study 2016. Lancet (London, England), 392(10152), 1015–1035. https://doi.org/10.1016/S0140-6736(18)31310-2
- Halim, A., Hasking, P., & Allen, F. (2012). The role of social drinking motives in the relationship between social norms and alcohol consumption. Addictive Behaviors, 37(12), 1335–1341. https://doi.org/10.1016/j.addbeh.2012.07.004
- Hartogsohn, I. (2017). Constructing drug effects: A history of set and setting. Drug Science, Policy and Law, 3, 205032451668332. https://doi.org/10.1177/2050324516683325
- Hjorthøj, C. R., Hjorthøj, A. R., & Nordentoft, M. (2012). Validity of timeline follow-back for self-reported use of cannabis and other illicit substances—systematic review and meta-analysis. Addictive Behaviors, 37(3), 225–233. https://doi.org/10.1016/j.addbeh.2011.11.025
- IWSR. (2022). As consumers embrace ‘Dry January,’ no- and low alcohol in key global markets reaches almost US$10 billion in value [press release].
- Jansen, K. (1997). Adverse psychological effects of ecstasy use and their treatment. Ecstasy Reconsidered. 112–128.
- Kays, K. M., Keith, T. L., & Broughal, M. T. (2013). Best practice in online survey research with sensitive topics. In Advancing research methods with new technologies (pp. 157–168). IGI Global.
- Koelega, H. (1995). Alcohol and vigilance performance: a review. Psychopharmacology, 118(3), 233–249. https://doi.org/10.1016/10.1007/BF02245951
- Kopra, E. I., Ferris, J. A., Rucker, J. J., McClure, B., Young, A. H., Copeland, C. S., & Winstock, A. R. (2022a). Adverse experiences resulting in emergency medical treatment seeking following the use of lysergic acid diethylamide (LSD). Journal of Psychopharmacology (Oxford, England), 36(8), 956–964. https://doi.org/10.1177/02698811221099650
- Kopra, E. I., Ferris, J. A., Winstock, A. R., Young, A. H., & Rucker, J. J. (2022b). Adverse experiences resulting in emergency medical treatment seeking following the use of magic mushrooms. Journal of Psychopharmacology (Oxford, England), 36(8), 965–973. https://doi.org/10.1016/j.nsa.2022.100334
- Lamonica, A. K., Boeri, M., & Turner, J. (2021). Circumstances of overdose among suburban women who use opioids: extending an urban analysis informed by drug, set, and setting. The International Journal on Drug Policy, 90, 103082. https://doi.org/10.1016/j.drugpo.2020.10308
- Llopis, E. J., O'Donnell, A., & Anderson, P. (2021). Impact of price promotion, price, and minimum unit price on household purchases of low and no alcohol beers and ciders: descriptive analyses and interrupted time series analysis of purchase data from 70, 303 British households, 2015–2018 and first half of 2020. Social Science & Medicine (1982), 270, 113690. https://doi.org/10.1016/j.socscimed.2021.113690
- McElrath, K., & McEvoy, K. (2002). Negative experiences on ecstasy: The role of drug, set, and setting. Journal of Psychoactive Drugs, 34(2), 199–208. https://doi.org/10.1080/02791072.2002.10399954
- Mellinger, J. L. (2019). Epidemiology of alcohol use and alcoholic liver disease. Clinical Liver Disease, 13(5), 136–139. https://doi.org/10.1002/cld.806
- Miller, M., Pettigrew, S., & Wright, C. J. (2022). Zero‐alcohol beverages: Harm‐minimisation tool or gateway drink? Drug and Alcohol Review, 41(3), 546–549. https://doi.org/10.1111/dar.13359
- Miller, P. G., Coomber, K., de Andrade, D., Livingston, M., Puljević, C., Vakidis, T., Carah, N., Taylor, N., Burn, M., Curtis, A., Room, R., Clough, A., Najman, J., Scott, D., Mayshak, R., & Ferris, J. (2021). Summarising the impacts of the Queensland alcohol‐related violence and night‐time economy (QUANTEM) project. Drug and Alcohol Review, 40(5), 755–760. https://doi.org/10.1111/dar.13272
- Miller, P. G., Coomber, K., Staiger, P., Zinkiewicz, L., & Toumbourou, J. W. (2010). Review of rural and regional alcohol research in Australia. The Australian Journal of Rural Health, 18(3), 110–117. https://doi.org/10.1111/j.1440-1584.2010.01133.x
- Morris, J., Cox, S., Moss, A. C., & Reavey, P. (2023). Drinkers like us? The availability of relatable drinking reduction narratives for people with alcohol use disorders. Addiction Research & Theory, 31(1), 1–8. https://doi.org/10.1080/16066359.2022.2099544
- Neill, E., Meyer, D., Toh, W. L., van Rheenen, T. E., Phillipou, A., Tan, E. J., & Rossell, S. L. (2020). Alcohol use in Australia during the early days of the COVID‐19 pandemic: Initial results from the COLLATE project. Psychiatry and Clinical Neurosciences, 74(10), 542–549. https://doi.org/10.1111/pcn.13099
- Nicholls, E. (2023). “I don’t want to introduce it into new places in my life”: The marketing and consumption of no and low alcohol drinks. The International Journal on Drug Policy, 119, 104149. https://doi.org/10.1016/j.drugpo.2023.104149
- Okaru, A. O., & Lachenmeier, D. W. (2022). Defining no and low (NoLo) alcohol products. Nutrients, 14(18), 3873. https://doi.org/10.3390/nu14183873
- Rehm, J., Lachenmeier, D. W., Llopis, E. J., Imtiaz, S., & Anderson, P. (2016). Evidence of reducing ethanol content in beverages to reduce harmful use of alcohol. The Lancet Gastroenterology & Hepatology, 1(1), 78–83. https://doi.org/10.1016/S2468-1253(16)30013-9
- Rehm, J., Soerjomataram, I., Ferreira-Borges, C., & Shield, K. D. (2019). Does alcohol use affect cancer risk? Current Nutrition Reports, 8(3), 222–229. https://doi.org/10.1007/s13668-019-0267-0
- Roche, A., Kostadinov, V., Fischer, J., Nicholas, R., O'Rourke, K., Pidd, K., & Trifonoff, A. (2015). Addressing inequities in alcohol consumption and related harms. Health Promotion International, 30 Suppl 2(suppl 2), ii20–ii35. https://doi.org/10.1093/heapro/dav030
- Shaw, C. L., Dolan, R., Corsi, A. M., Goodman, S., & Pearson, W. (2023). Exploring the barriers and triggers towards the adoption of low-and no-alcohol (NOLO) wines. Food Quality and Preference, 110, 104932. https://doi.org/10.1016/j.foodqual.2023.104932
- StataCorp, L. (2023). Stata longitudinal-data/panel-data reference manual release 18.
- Suh, I., Shaten, B. J., Cutler, J. A., & Kuller, L. H. (1992). Alcohol use and mortality from coronary heart disease: the role of high-density lipoprotein cholesterol. Annals of Internal Medicine, 116(11), 881–887. https://doi.org/10.7326/0003-4819-116-11-881
- Tutenges, S., & Bøhling, F. (2019). Designing drunkenness: How pubs, bars and nightclubs increase alcohol sales. The International Journal on Drug Policy, 70, 15–21. https://doi.org/10.1016/j.drugpo.2019.04.009
- Winstock, A. R., Davies, E. L., Ferris, J. A., et al. (2022). Using the global drug survey for harm reduction. In: EMCDDA Insights (Ed.), Monitoring drug use in the digital age: Studies in web surveys (Vol 26). European Monitoring Centre for Drugs and Drug Addiction. EMCDDA.
- Zinberg, N. (1984). Drug, set and setting: The basis for controlled intoxicant use (1st ed.). Yale University Press.
Appendix A:
GDS items used
Demographics
Country
Which country do you currently live in? A list of all countries is provided.
Age
How old are you? Responses were measured continuously from 16 to 85+.
Gender
Gender and sex are measured through three items which are then combined to make a composite variable:
What is your gender? • Male • Female • Non-binary • Different identity
What gender were you assigned at birth? • Male • Female
Are you intersex? • Yes • No • Prefer not to say
The variable used in the analysis contains the following categories • Cis-woman • Cis-man • Trans, non-binary, intersex It is compiled using the following formula Cis-woman = Female gender, assigned female at birth, not intersex Cis-man = Male gender, assigned male at birth, not intersex Trans = Male gender, assigned female at birth, or Female gender, assigned male at birth Non-binary = non-binary or different identity Intersex = indicates intersex Where trans, non-binary and intersex are combined to facilitate statistic power in analysis
NoLo Use
About your use of NoLo products
This year, we want to discover people’s experiences with alcohol-free and low-strength beers, ciders, wines, and spirits (*NoLo products). *NoLo does not refer to other kinds of drinks with no or a trace amount of alcohol—such as coffees, teas, fruit juices, and soft drinks.
Have you ever consumed any NoLo products?
These include beers, ciders, spirits, or wines that are: Low alcohol products—not more than 1.2% ABV, de-alcoholized—not more than 0.5% ABV, Alcohol-free—usually no more than 0.05%.
Have you ever consumed any NoLo products? with response options: ‘No’, ‘Yes, but not in the last 12 months’, ‘Yes, during the last 12 months’. To derive the lifetime use of NoLo products, individuals who responded ‘No’ were coded as not using NoLo (i.e. 0), and individuals who responded with either of the ‘Yes’ options were coded as using NoLo (i.e. 1).
NoLo relative consumption
Participants were asked about the extent to which they drink NoLo products relative to alcohol products on an occasion when NoLo products are consumed. Response options included:
‘I only drink NoLo products’.
‘I drink mostly NoLo products, but also alcohol products’.
‘About half of my drinks are NoLo and alcohol products’.
‘I drink mostly alcohol products, but some NoLo products’.
‘I only drink one NoLo product; the rest are alcohol products.’
Appendix B:
Justification and interpretation assistance
MCA justification
The data presented in suggest that distinct set and setting preferences or tendencies related to a person’s reason, occasion, and environment, socialization for NoLo use consumption may exist and that the set and setting of NoLo consumption relative to alcohol consumption may vary. However, where respondents choose more than one response option, the table does not allow a summary of how multiple responses are grouped. We used MCA, as a powerful analytical technique, to explore how each set and setting response options of NoLo consumption is associated with the consumption of NoLo products relative to alcohol products. The MCA figures that follow provide a visual representation of the multiple response options which cannot be discerned from the summary data in . overlay the consumption of NoLo products relative to alcohol products in a typical setting (orange circles) against the people’s responses to set reason (), setting location (), and setting socialization ().
Comprehensive interpretations
To aid interpretation, we have used color and shape to help visualize the grouping of each set and setting response options. Briefly, to describe the position of responses, to the left of the Y-axis, the clustering of responses is based on respondents who indicated ‘yes’ (Y_) to the response options; to the right of the Y-axis, this captures respondents who did not indicate yes (in this case considered a ‘no response; N_). As we are interested in decisions relating to set and setting the following interpretations focus on the left side of the Y-axis; where respondents have indicated ‘yes’ to the response options. Above and below the X-axis reflect response options groupings based on association patterns. The labeling of the Y-axis dimension is based on the patterns above and below the X-axis.
The two dimensions account for almost 80% variation in the data. Dimension 1 (yes/no) separates response patterns based on respondents indicating yes or no to the twelve response options. Dimension 2 groups responses based on externalized or internalized reasons. The top left quadrant suggests reasons that are ‘externalized’ reasons relating to friendship groups or peers or to avoid embarrassment (when drunk; symbolized by the red squares) to avoid drug interactions or simply drink less alcohol (symbolized by green triangles). The bottom left quadrant reflects responses to more ‘internalized’ reasons: reflecting health concerns and calorie awareness or to avoid being drunk or because they have to drive (avoiding drink-driving related incidents). Concerning the consumption of NoLo products relative to alcohol products people who report ‘equally’ (half the drinks consumed are NoLo products) or ‘rarely’ (drinking mostly alcohol products) were more likely to report ‘externalized’ reasons (as these values are above the X-axis) with the ‘externalized’ reasons (influenced by peers or minimizing drug interactions). Respondents who reported ‘mostly’ (mostly NoLo products but some alcohol products) or ‘only’ (only drinking NoLo products) were more likely to report ‘internalized’ reasons (health-related or to avoid the negative effects of alcohol—drunk or related to drink-driving). Of note respondents reporting ‘once’ (one NoLo product and the rest alcohol products in a sitting) are situated to the very right of the figure; this indicates this particular group of NoLo drinkers reported reasons very different to the respondents in the other NoLo categories. Respondents who indicated once had no clear association with any particular grouping of reasons and were typically more likely to report ‘no to each of the reason options. In the bottom right quadrant, the black cross, which represents pregnancy as a reason for drinking NoLo drinks (either the respondent or the partner), is located away from all other reasons (and on the right of the Y-axis). This suggests that pregnancy as a reason for drinking NoLo products is a very specific and rare reason. Finally, the pink V near the intersection of the two axes (the origins)—which represents the taste as a reason for drinking NoLo products—is also located away from other reasons. As it is located close to the ‘mostly’ and ‘only’ NoLo categories this implies that that for those who report taste as a reason were typically people consumption of NoLo products relative to alcohol products was most or only NoLo products.
The two dimensions account for almost 83.8% variation in the data. Dimension 1 (yes/no) separates response patterns based on respondents indicating yes or no to the eleven response options. Dimension 2 groups responses based on work-sports or family/friends event settings. The top left quadrant suggests a common location for drinking NoLo products is related to work-related settings (red squares) or sports settings (green triangles)—settings that are typically not family/friend gatherings. The bottom left quadrant suggests settings that are more likely to revolve around family and friends—such settings include at home or locations that specifically include socializing with family/friends (black crosses) or party/event scenes (blue triangles).
In the context of NoLo product consumption in work or sports settings, there are noticeable patterns. We observe that responses related to work meetings and work lunches tend to cluster together (although, as these are far from the origin these response options were not commonly reported). On the other hand, consuming NoLo products during work evening settings aligns more with patterns seen during sports-event settings (either watching or as part of a team). Notably, respondents who report consuming NoLo products relative to alcohol products as ‘rarely’ or just ‘once’ are positioned above the X-axis. This positioning suggests that if they choose to consume NoLo in any setting, they’re more likely to do so in a setting that is related to work or sports. By contrast, in settings that revolve around family or friends—at home, parties, social events, or special events—respondents were more likely to indicate their NoLo consumption relative to alcohol consumption as ‘mostly’ (mostly NoLo products but some alcohol products) or ‘equally’ (half the drinks consumed are NoLo products); this is especially the case for drinking in the home or socializing with friends during the day or evening. For the group of respondents reporting ‘only’ drinking NoLo products, as the position of the marker in is to the right of the Y-axis (where all the no responses cluster), this suggests that this group of respondents tended not to indicate any specific response about NoLo drinking settings and therefore had no clear association with location setting where NoLo drinking occurs.
depicts responses to setting-socialization networks—the people with whom respondents typically indicate drinking NoLo products. The two dimensions account for almost 84.6% variation in the data. Dimension 1 (yes/no) separates response patterns based on respondents’ yes or no indication of the six response options. Dimension 2 groups responses based on work-sports socialization or family/friends socialization. The top left quadrant reflects a type of respondent who tends to drink NoLo drinks with work colleagues or sports peers (red squares) that is with people from non-familial social circles. By contrast, the bottom left quadrant reflects a type of respondent who tends to drink NoLo products alone or with their partner (black crosses) or in the company of family or friends (green diamonds). Respect people who report the proportion of NoLo products relative to alcohol products as ‘rarely’ or ‘once’ tended to be drinking NoLo products with work or sports colleagues. By contrast, people who report the proportion of NoLo products as ‘mostly’ or ‘equally’ typically report drinking alone, with their partner, or with other familial members).
Appendix C:
MCA plot relative to gender
Figure 1A. MCA plot representing set or reasons for drinking NoLo products and consumption of NoLo products relative to gender.