
ABSTRACT
We explore the effect of students’ perceived task difficulty on the mathematics self-efficacy – performance relationship. Specifically, we expand on previous reciprocal effects studies through including students’ self-efficacy for different levels of task difficulty in an empirical investigation. We examined students’ self-efficacy for easy, medium difficulty, and hard tasks and performance on a national mathematics test in a longitudinal study of 95 Norwegian students from grade 8 to grade 9. We found differential relationships between self-efficacy for different levels of task difficulty and national test performance. In support of the ‘skill development’ model, grade 8 national test performance predicted grade 9 self-efficacy for medium and hard, but not easy, tasks. While mastery experiences are likely to arise more easily on easier tasks, such experiences are likely to matter more on harder tasks. Our findings highlight the importance of supporting students’ engagement with challenging tasks to strengthen both their performance and self-efficacy.
Introduction
Self-efficacy (SE) beliefs are individuals’ judgements about their perceived capability to perform on future tasks (Bandura, Citation1997), such as students’ beliefs that they are able to perform well on a mathematics test. One reason for which SE has attracted significant research attention has to do with its relation to student learning and performance (Zimmerman, Citation2000). Prior studies have shown an effect of mathematics SE on performance results (e.g. Pajares, Citation1996) and vice versa (e.g. Pampaka et al., Citation2011). However, the nature of the possible reciprocal relationship between SE and performance (Bandura, Citation1997) is still unclear, particularly the direction and magnitude of the effects. Furthermore, while there are theoretical reasons to believe that perceived task difficulty could have a bearing on the relationship between mathematics SE and performance, this factor was not considered in previous research.
A meta-analysis of prior research on the topic (Talsma et al., Citation2018) concluded that the dominant direction of the effect was from performance to SE, but the strengths of the reciprocal effects were moderated by age, and only two of the studies included data from school-aged children. Four studies, not included in Talsma et al.’s meta-analysis, have shown effects from performance to SE (Bernacki et al., Citation2015), SE to performance (Grigg et al., Citation2018; Schöber et al., Citation2018), and reciprocal effects between SE and performance (Du et al., Citation2021). Accordingly, the issue of the exact nature of the possible reciprocal relationship between SE and mathematics performance still remains unresolved, especially among school-aged children.
One possible reason for the discrepancy in previous findings is that perceived level of task difficulty was not considered in those studies, despite levels of difficulty being part of the definition of SE as originally proposed by Bandura (Citation1997). As argued in Street et al. (Citation2017), including SE for different levels of perceived task difficulty (also referred to as level-specific SE), along with the other two dimensions proposed by Bandura (specificity and strength), is important as it is an integral part of the definition of SE. Furthermore, it enables investigations into the potentially differential relationships between SE for different levels of perceived task difficulty and performance outcomes.
In this article we argue that including SE for different levels of difficulty enables a more fine-grained investigation of SE, which can provide a more nuanced understanding of the relationship between SE and mathematics performance. To demonstrate how considering level-specific SE might contribute to existing knowledge, we expand on previous reciprocal effects studies through an investigation of the reciprocal effects between performance on a standardised national numeracy skills test in Norway and students’ SE for easy, medium difficulty, and hard tasks, respectively. We present a theoretical argument for how and why perceived task difficulty might have a bearing on the relationship between mathematics SE and performance, drawing on the concepts of Key Memorable Events (Marmur, Citation2019) and productive struggle (see, e.g. Hiebert & Grouws, Citation2007) in light also of research on the sources of students’ SE (e.g. Butz & Usher, Citation2015).
Theoretical background
According to Bandura (Citation1997), SE is a multidimensional construct which varies according to facet-specificity (type of mathematics task) and strength (degree of confidence to carry out the task), but also according to levels of difficulty (perceived task difficulty). SE is related to future performance through mediating processes, influencing students’ behaviours and motivations. SE is associated with individuals’ tendencies to approach learning tasks (Pampaka et al., Citation2011), their goal setting and self-regulative processes while they engage in such tasks (Zimmerman et al., Citation1992), their effort and persistence, and their performance outcomes (Pajares & Miller, Citation1995). It is theoretically plausible that levels of difficulty have a bearing on the process of SE belief formation, as well as on students’ behaviours and motivations.
Street et al. (Citation2017) argued that students consider the level of task difficulty when formulating their mathematics SE, and found significant associations between Norwegian students’ SE and their (later) national mathematics test performance. The strongest association was with SE for medium difficulty tasks. Students may also consider task difficulty when they interpret and make sense of previous performance experiences such as, for example, how easy or difficult did each student find the test, how much help did each student receive, or how much effort did each student put in it (e.g. Yetkin Özdemir & Pape, Citation2013). Nicholls (Citation1978) found that students are adept at making inferences regarding the relationship between task difficulty, effort, and ability from around 13 years of age. Accordingly, secondary school students are likely to infer that succeeding on harder tasks is a more important indication of future potential as compared to success on easier tasks. Thus, task difficulty might have a bearing on SE beliefs through students’ appraisals as to the relevance of the SE source information for their future potential to succeed. In addition, task difficulty might play a role in terms of how readily previous events and experiences are remembered. The role of task memorability for changes to students’ mathematics SE has been discussed previously by, e.g. Butz and Usher (Citation2015; memorable or transformative moments) and Stylianides and Stylianides (Citation2014; memorable task). Marmur (Citation2019) argued that single, strongly perceived events can impact students’ attitudes and beliefs in mathematics, and, furthermore, that such emotional events are likely to be well remembered due to the rich information stored in our neural networks. He also proposed the construct of Key Memorable Events (KMEs) as classroom events that are perceived by students as memorable and meaningful, that are typically accompanied by strong emotions, either positive or negative (Marmur, Citation2019).
Memorability is also emphasised in the concept of student struggle, which is the idea that students will benefit from expanded effort and making sense of mathematics that is not immediately understandable (Hiebert & Grouws, Citation2007). Warshauer (Citation2015) described different ways in which teachers could support students’ productive struggle, through enabling success without lowering the cognitive demand of the task. This research suggests that, working on difficult tasks might be likened to experiencing KMEs, in that they might be accompanied by uncertainty or frustration (while struggling) or satisfaction or happiness (if the task is overcome). Furthermore, we hypothesise, that tasks that enable students’ productive struggle, i.e. tasks that are challenging but solvable, will likely have a stronger relationship with their SE, than tasks that are too easy or too hard.
Although Bandura advised SE measurements should include different levels of difficulty (Bandura, Citation2006, p. 311), and despite knowledge regarding the relationship between task difficulty and students’ ability inferences (Nicholls, Citation1978), only few other studies have considered students’ mathematics SE regarding tasks of varying perceived difficulty, and none that we know of in relation to reciprocal effects with mathematics performance. Chen and Zimmerman (Citation2007) reported weaker relationships (termed ‘accuracy’) between US (grade 7, 12–13 year-olds) and Taiwanese (grade 6, age 11–12 year-olds) students’ mathematics SE and performance on hard tasks, as compared with easy and medium difficulty tasks. However, task difficulty was included in the performance measure through estimating how many students correctly solved each item, while it was not included in the SE measure. Thus, the findings by Chen and Zimmerman (Citation2007) are related more to actual, not perceived, task difficulty. Differently to Chen and Zimmerman (Citation2007), Locke et al. (Citation1984) investigated memory SE for tasks of different perceived levels of difficulty. Locke et al. (Citation1984) found that SE for tasks of medium difficulty were most predictive of subsequent task performance (r with performance ranging from .40 to 53 over three trials), followed by SE for easy tasks (r ranging from .30 to .39) and very hard tasks (r ranging from .19 to .40).
While only few studies considered SE for different levels of difficulty, many studies have investigated the relationship between SE and performance in general. Multon et al. (Citation1991) conducted a meta-analysis of 39 studies and found overall positive and statistically significant relationships between SE and academic performance, with a mean effect size of ru = .38. Effect sizes varied according to the age of the participants, where for instance, the association between SE and performance was weaker for elementary school students than upper secondary school or college students. The relationship between mathematics SE and mathematics performance has been investigated in different countries. Schulz (Citation2005) investigated results from the 2003 Programme for International Student Assessment (PISA), which included 15 year-olds in 30 OECD (The Organisation for Economic Co-operation and Development) countries. SE was positively correlated with mathematics literacy (OECD median = .52, Norway = .55). Furthermore, SE was found to predict mathematical problem solving after controlling for factors such as self-concept, perceived usefulness of mathematics, prior experience with mathematics, cognitive ability, mathematics Grade Point Average, anxiety, and gender (Pajares, Citation1996; Pajares & Miller, Citation1994).
There is also empirical support for the influence of past performances on SE (e.g. Pampaka et al., Citation2011). According to Bandura (Citation1997), SE is formed through four sources, where mastery experiences provide the strongest source. Mastery experiences stem from individuals’ appraisals of previous performance situations, for instance, their experiences from a previous but similar test. Pampaka et al. (Citation2011) measured students’ SE as a learning outcome of post-compulsory mathematics programmes. They found that mathematics SE was positively related to both prior attainment, as measured by students’ General Certificate of Secondary Education (GCSE) mathematics grade (Pearson’s r ranging from .14 to .34), and subsequent achievement outcome, as measured by their advanced-subsidiary mathematics grade (Pearson’s r ranging from .28 to .39). Furthermore, Matsui et al. (Citation1990) used students’ self-reported final year secondary school mathematics grades as proxy for mastery experiences. The authors reported these previous performances made an independent contribution to their model (R2 = .05, F(1,157) = 12.70, p < .01), and were the strongest of the four types of sources predicting SE.
According to Valentine and DuBois (Citation2005), a mutually reinforcing pattern of effects between self-beliefs and academic achievement is supported for several types of self-beliefs. Marsh et al. (Citation2013) described the competing self-enhancement model (self-beliefs are viewed as a cause of subsequent achievement) and skill development model (self-beliefs are viewed as effects of previous achievement), and argued instead for a reciprocal effects model in the case of self-concept. The reciprocal effects model is theoretically proposed in relation to SE by Bandura’s (Citation1997) definition, but only few studies have investigated reciprocal effects between school-aged students’ SE and mathematics performance empirically.
In Talsma et al.’s (Citation2018) meta-analysis that we mentioned previously, data from 11 studies were used to investigate the possible reciprocal relationship between SE and performance (N = 2688); six of these studies considered mathematics and only two of them included school-aged children as participants. The authors specified a cross-lagged panel model (earlier SE to later SE, earlier performance to later performance, and cross-lags from earlier SE to later performance, and earlier performance to later SE) and found support in favour of the skill development model (β = 0.21 for earlier performance on later SE) rather than the self-enhancement model (β = 0.07 for earlier SE on later performance). A subsequent moderation analysis found the effect from SE on performance (self-enhancement) was significant only for adults; only the skill development effect was found for school aged children. The relationship was also moderated by the time lag (stronger effects for shorter time lag), whether the measures of SE and performance were well matched (stronger effects for better matched measures), and the type of self-efficacy scale used (stronger effects for unipolar rather than Likert-type scales). The number of studies that met the inclusion criteria set by Talsma et al. (Citation2018) (mainly that the study was consistent with recommendations from SE theory) was very low (only 11 out of 347 articles), highlighting this on-going challenge in SE research.
Recently, a large study by Du et al. (Citation2021) provided empirical support for reciprocal effects between SE and performance for school-aged children. Chinese students (N = 3855) were followed from grades 4 to 6, with a 2-year lag between measurement occasions (mean ages 10 and 12 years, respectively). Task-specific SE was measured by eight items adapted from PISA 2012 (example item Finding patterns in a set of numbers, letters or graphics), to which the students responded on a four-point scale (1 = not at all confident to 4 = very confident). A cross-lagged panel model gave evidence for reciprocal effects, where the effect of earlier SE on later performance (β = .09) was weaker than the effect of earlier achievement on later SE (β = .23). Also, achievement was more stable over time (β = .44) as compared with SE (β = .20).
Three further studies (Bernacki et al., Citation2015; Grigg et al., Citation2018; Schöber et al., Citation2018), which were not included in the Talsma et al. (Citation2018) meta-analysis, contributed different findings regarding reciprocal effects between SE and mathematics performance for school-aged children. Bernacki et al. (Citation2015) conducted a micro-analytic study among 9th graders in the USA (age 14–15 years), within the context of an automated algebra tutor. They observed four learning periods, where each period included four mathematics problems followed by one SE prompt. Thus, SE and performance scores were collected across learning tasks that were only minutes apart. Bernacki et al. found skill development effects from students’ task performance to their SE (β = .16, .16 and .10 for the first three observations, respectively), while effects from students’ SE to performance were not significant in the path model analysis. SE was measured by a single item (How confident are you that you could solve a maths question like this one in the future?), thus measurement error could not be accounted for.
Two studies (Grigg et al., Citation2018; Schöber et al., Citation2018) found significant effects from students’ SE to their performance, but not from performance to SE. Schöber et al. (Citation2018) found significant effects from German grade 7 (mean age 12 years) students’ SE to their performance in mathematics eight months later (β = .08), while the path from students’ earlier mathematics performance to their later SE was non-significant. Schöber et al. (Citation2018) used six items to measure SE (example item I’m certain that I can still reach my desired level of performance in mathematics even if I get one bad grade), with a four-point response scale (0 = not at all true to 3 = absolutely true). Similar to Schöber et al. (Citation2018), Grigg et al. (Citation2018) found that students’ SE predicted performance six months later (β = .34 class grades; β = .22 standardised achievement), and performance predicted initial SE (β = .39/.39) but not gains in SE (after controlling for initial SE). Grigg et al. (Citation2018) used the ‘Math self-efficacy scale’ (National Center for Education Statistics, Citation2003) to measure grade 6 through grade 10 (mean age 13 years) students’ SE (example item I’m confident I can do an excellent job on my maths assignments), with a four point Likert scale (1 = almost never to 4 = always). This scale is somewhat ambiguous in the sense that we cannot know whether students think they can ‘almost never’/‘always’ do an excellent job, or whether they are ‘almost never’/‘always’ confident. Furthermore, the scales used by Schöber et al. (Citation2018) and Grigg et al. (Citation2018) both differ from Bandura’s (Citation2006) recommended scales for measuring SE (i.e. a unipolar scale measuring degrees of confidence). In line with the moderating effects reported by Talsma et al. (Citation2018) it is possible that the non-significant effects of performance on later SE in these studies are due to the way SE was measured.
To sum up, only few studies have investigated reciprocal effects between SE and school-age children’s performance in mathematics, and those studies have provided unclear findings as to the nature of the relationship between SE and mathematics performance. Furthermore, we are aware of no studies that investigated reciprocal effects between SE and mathematics performance and considered also perceived levels of difficulty, despite levels of difficulty being an integral part of the conceptualisation of self-efficacy according to Bandura (Citation1997). There is theoretical reason to expect that students’ previous experiences with harder tasks are both more memorable and more important to their subsequent SE as compared to experiences with easier tasks, while similarly previous SE is more relevant for subsequent success on harder (as compared with easier) tasks, due to the higher need for perseverance on such tasks.
Theoretical model and research questions
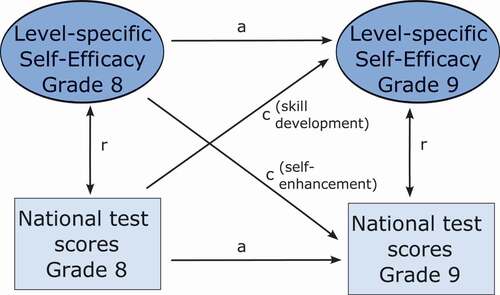
In line with theory and empirical findings discussed earlier, we propose a theoretical model (see ) where students’ level-specific SE and mathematics performance are reciprocally related. To investigate this model we included Norwegian students’ SE responses and subsequent national test performance in mathematics from the beginning of grades 8 and 9 (ages 13 and 14, respectively). Thus, we specified a cross-lagged two-wave longitudinal path analysis, such that students’ SE for easy, medium difficulty, and hard tasks in grade 8 predicted their SE for easy, medium difficulty, and hard tasks in grade 9 (autoregressive path). Their performance on national tests in grade 8 predicted their performance on national tests in grade 9 (autoregressive path). SE and performance were associated within each year-group. Of particular interest for us in this paper was to investigate the relative magnitudes of the associations according to task difficulty, in particular the magnitude of the skill development path from earlier performance on later SE (cross-lagged path), and the self-enhancement path from earlier SE on later performance (cross-lagged path). To investigate empirically our proposed model, we posed the following four research questions.
Figure 1. Theoretical model.
Research Question 1 (RQ1): What is the relationship between level-specific SE and performance on national tests in mathematics in grade 8, and level-specific SE and performance on national tests in mathematics in grade 9?
Research Question 2 (RQ2): What is the stability of SE for easy, medium difficulty, and hard tasks between grade 8 and 9?
Research Question 3 (RQ3): What is the magnitude of the cross-lagged effects from earlier level-specific SE on later national test performance (self-enhancement), and earlier national test performance on later level-specific SE (skill development)?
Research Question 4 (RQ4): Does the relationship between SE and national test performance differ according to SE for easy, medium difficulty, and hard tasks?
Method
Participants
The participants were 95 students (44 female and 51 male) from five Norwegian secondary school classes who completed self-report questionnaires and took national tests in mathematics at the beginning of grades 8 and 9. The participants were part of a larger sample, selected for cross-sectional investigations (see, Sørlie & Söderlund, Citation2015). Random sampling of schools was not possible and so a sampling logic was applied to ensure a variety of schools were included in terms of student performance. Included in the study were schools where students had performed above and below national test expectations, accounting for measures of socioeconomic status at the municipal level. The sampling strategy is discussed in more detail in Langfeldt (Citation2015).
The Norwegian school context differs in some important ways to that of some other countries, in that more than 95% of Norwegian students attend state schools (Statistics Norway, Citation2020) and permanent ability grouping is illegal (Opplæringslova, Citation1998, § 8–2). Accordingly, Norwegian classrooms are characterised by a mixture of ability grouping, as well as mixed student backgrounds in socioeconomic terms. Conducting investigations in this context might be advantageous in terms of generalisability of results, as there are few systematic differences between schools in the country.
Measures
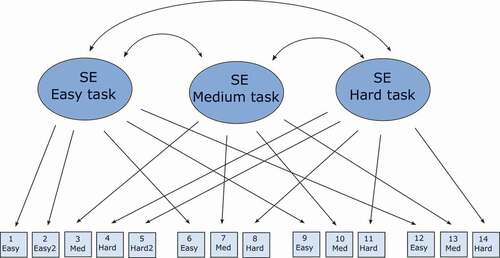
Students completed the Self-Efficacy Gradations of Difficulty (SEGD; Street et al., Citation2017) questionnaire in grades 8 and 9. This multidimensional measure of mathematics SE includes: four test taking facets (facet-specific SE) related to problem solving (complete a number of problems, solve tasks of a certain challenge) and self-regulation (concentrate, not give up), and three levels (easy, medium, and hard) of perceived difficulty (level-specific SE). Each of the 14 items in the measure are related to one test taking facet and one level of difficulty within each facet (see for item descriptives). For each item, students are asked to indicate their confidence (strength of SE) on an 11-point scale from 0 (not at all certain) to 10 (highly certain). Consistent with Bandura’s theory of levels of difficulty, three constructs were posed: SE for easy tasks, SE for medium difficulty tasks, and SE for hard tasks. The structural validity of this measure was tested (Street et al., Citation2017), and the resulting best-fit measurement model included three latent (unobserved) level constructs, with correlated uniquenesses (correlated error terms) specified for each of the four facets.
Table 1. Item descriptives SEGD (Street et al., Citation2017).
indicates some expected tendencies, in terms of students’ SE scores. Consistently, students’ SE for easy tasks are stronger as compared with their SE for medium difficulty or hard tasks, within the same test-taking facets. Furthermore, standard deviations are higher in association with harder task difficulty, while we see higher estimates of skew and kurtosis in relation to easier SE items. Overall, this might indicate that most students were confident they could perform the easy tasks (a so-called ceiling effect), while there were larger individual variations in strength of mathematics SE for medium difficulty and hard tasks.
The performance measure was raw scores from national tests in numeracy (Norwegian Directorate for Education, Citation2016). The test is not a test in the subject of mathematics, but rather it tests pupils’ ‘fundamental skills in numeracy’ across all subjects. The skills examined include understanding of numbers, the ability to measure and use numbers in a broad range of contexts, and being able to interpret and construct graphical and other quantitative representations. The content of the test in numeracy includes three areas: number and algebra, measurement and geometry, and statistics and probability. Norwegian students sit these tests at the start of the school year in grades 5, 8, and 9. Students in grades 8 and 9 sit the same test, which involves 58 problems, scored as either correct (1 point) or incorrect (0 points). Participants in our study sat the national tests within one to two weeks after completing the SEGD questionnaire. We used unique identifiers to link the national test scores with students’ questionnaire responses. Norwegian national tests are centrally administered by the Norwegian Directorate for Education and Training. The reliabilities (Cronbach’s alpha) of the national tests in numeracy for grades 8 and 9 in 2012 and 2013 ranged from .93 to .94 (Ravlo & Johansen, Citation2013; Ravlo et al., Citation2014).
The item descriptives in indicate that while students’ mathematics performance increased, their mathematics SE decreased across the space of the year (in absolute terms). This is demonstrated in that of 14 repeated SE items, students’ scores on 12 of these were lower in grade 8 as compared to grade 9. We compared the mean scores of our sample to the national average on the national tests in mathematics for each of the years in question (2012 and 2013). We found that in grade 8 there was a mean difference in scores (2.13), which was marginally significant (t = 1.86, p = .066), while the mean difference in grade 9 (2.74) was significant (t = 2.40, p = .018). That is, while the students in our sample performed only marginally better than the national average in grade 8, they scored significantly better in grade 9, i.e. it seems these classes improved more than the national average. It is thus possible that there was a systematic difference between the students or the classes in our study, as compared to the population of grade 8–9 students in Norway. This has implications for the interpretations of our findings: Our findings are intended as empirical illustrations of the potentially differential relationships between SE and performance when including SE for different levels of difficulty, rather than generalisable estimates of that relationship.
Reciprocal effects model
Our modelling choices were informed by both the previously established factor structure of the SE measure and our theoretical model. Street et al. (Citation2017) found that the best-fit model was one that accounted for the multidimensional nature of SE, through correlated latent level constructs and correlated uniquenesses for facets of mathematics. The current study includes a subsample of the participants in the Street et al. (Citation2017) study, followed up over two years. Thus, the factor structure of the SE measure has already been established. In order to estimate the relationships between latent constructs we included scale-scores (parcels) in a cross-lagged path model.
Parcelling involves aggregating (taking the sum or average of) two or more items to manufacture an indicator of a construct (Little et al., Citation2002). While the current measure of SE is multidimensional, Little et al. (Citation2002, p. 169) argue that when the aim is to investigate substantive relationships, rather than factor structures, parcelling can be a useful and appropriate approach, because the residual for the secondary loading of the multidimensional factor is eliminated. In other words, parcels can be specified in such a way as to construct ‘clean’, unidimensional constructs, comparable to the technique of applying correlated uniquenesses to account for multidimensionality. According to this approach, item parcels were formed through aggregating items in such a way that the secondary loading (for facets of mathematics) was spread across the latent level parcels. For example, the ‘easy’ parcel contains all items related to the easy latent construct, across four different facets (see ).
Figure 2. Factor structure of the Self-Efficacy Gradations of Difficulty questionnaire.
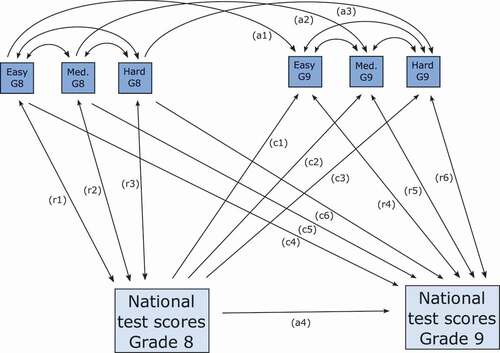
We specified a cross-lagged two-wave longitudinal path analysis according to the recommended design (see, Talsma et al., Citation2018). In this model (Model 0), students’ SE level constructs (SE for easy, medium difficulty, and hard tasks) in grade 8 predicted their SE level constructs in grade 9, and students’ national test performance in grade 8 predicted their national test performance in grade 9 (autoregressive paths). SE level constructs and performance were associated within each year-group. Finally, we specified two cross-lagged paths, where students’ SE level constructs in grade 9 were regressed on their national mathematics test performance in grade 8 (skill development), and students’ national mathematics test performance in grade 9 was regressed on their SE level constructs in grade 8 (self-enhancement), respectively. Building on Model 0, we specified models with different equality constraints to investigate the relative stability of our SE level constructs, as well as whether there were differential relationships between performance and SE for different levels of perceived difficulty. We first specified Model 1 (see ) where we constrained as equal the three SE level constructs for the autoregressive paths (paths a1-3) as well as for the associations between SE and performance (paths c1-3, c4-6, r1-3, and r4-6). For each of the structural paths, we then lifted the constraints step-by-step and compared the model fit indices for the nested models to derive a best-fit model (Model 2).
Figure 3. Reciprocal effects model with equality constraints (Model 1).
Analytic strategy
We analysed the data with structural equation modelling, using the maximum likelihood estimator in Mplus (version 7.31 for Mac: Muthén & Muthén, Citation2012). Path models allow for the estimation of unique effects between variables that can be simultaneously included as independent and dependent constructs (Hoyle, Citation2015), which serves our aim of investigating the relative contribution of mathematics performance and three self-efficacy level constructs in a reciprocal model (i.e. a cross-lagged panel model; see ). We used the Root Mean Square Error of Approximation (RMSEA <.06 acceptable), the Standardised Root Mean Square Residual (SRMR<.08 acceptable), and the Comparative Fit Index (CFI) (CFI > .95 acceptable) for good fit (Hu & Bentler, Citation1999). As mentioned, we used equality constraints to compare parameters associated with different levels of task difficulty. For comparisons between nested models including different constraints for equality, we considered both Δχ2 in relation to the difference in degrees of freedom (a non-significant Δχ2 indicating support for the more parsimonious model) and ΔCFI (ΔCFI equal to or less than .010 indicating support for the more parsimonious model; Chen, Citation2007). We used the ‘new parameters’ option in MPlus to investigate whether parameters (defined a-priori) in the final model differed significantly from one-another. Specifically, we compared the stability of SE versus test performance (see paths a1-a3 and a4 in , respectively) and the associations between SE and performance in grade 8 and grade 9 (see paths r1-r3 and r4-r6 in , respectively).
Results
presents the correlation matrix for students’ SE latent level constructs and national mathematics test scores for grade 8 and grade 9. Some tendencies (in absolute terms) are noteworthy. First, the correlation estimates are significant in association with all the SE latent level constructs except for three cases, all associated with grade 9 students’ SE for easy tasks. Second, the autocorrelations (correlations between corresponding constructs in grade 8 and 9) for students’ SE for medium difficulty and hard tasks (both r = .45) are stronger than for easy tasks (r = .13, n.s.), indicating higher stability across time for these constructs. However, it is possible that the non-significant autocorrelation for the easy level construct is related to a lack of variability in scores, as most students reported high SE in relation to easy tasks (see ). Third, the strongest correlation estimate is the autocorrelation for students’ scores on the national mathematics tests (r = .87), indicating high stability of students’ test performance from grade 8 to grade 9. Finally, correlation estimates are consistently stronger in association with students’ SE for medium difficulty tasks (mean r = .43), as compared with their SE for hard (mean r = .37) and easy (mean r = .25) tasks.
Table 2. Correlation matrix of latent SE level constructs and national test scores.
In terms of the self-enhancement (previous SE on subsequent performance) versus skill development (previous performance on subsequent SE) effects, SE for easy tasks was associated with test performance (r = .22) but not across time (r = .13, n.s.), and that grade 8 SE was associated with grade 9 test performance (.24). In terms of medium difficulty tasks, SE was associated with test performance (r = .46) and across time (r = .45), and grade 8 SE was associated with grade 9 test performance (r = .44). Finally, in terms of hard tasks, SE was associated with test performance (r = .34) and across time (r = .45), and grade 8 SE was associated with grade 9 test performance (r = .32). Overall, we see evidence for reciprocal effects, except in the case of the SE for easy tasks. While these estimates will be useful for future meta-analyses on reciprocal effects and mathematics performance, we proceeded to use path modelling to estimate unique effects between SE and performance for different levels of task difficulty.
When we fitted our path model to this data we found that our proposed model, including students’ SE for easy, medium difficulty, and hard tasks as well as their national mathematics test performance resulted in excellent fit (Model 0, see ). Overall, parameter estimates from this model indicated differential relationships between SE and performance according to task difficulty. Thanks to a reviewer comment, we decided to replicate this model using the Bayesian estimator in MPlus, to check the robustness of our parameter estimates. While the MLR estimator relies on large sample logic and investigates the probability of the sample given the model, the Bayesian estimator investigates the probability of the model, given the sample, and provides robust results even with small sample sizes (see, e.g. Brown, Citation2015, p. 402). Our replication confirmed Model 0 as an excellent-fit model and provided support towards the robustness of our parameters. Standardised parameters in the models using the MLR and Bayesian estimators were comparable, if not identical. The largest difference was .03 (standardised estimate), which was in relation to the association between SE for medium difficulty and hard tasks in grade 8 (MLR estimator = .39; Bayesian estimator = .36). The replication using the Bayesian estimator was valuable given the aim of our study to investigate whether the levels of perceived difficulty might have a bearing on the relationship between self-efficacy and mathematics performance (rather than provide generalisable estimates of these relationships). In Model 0, the magnitudes of all associations are freely estimated. In contrast to this, and the most parsimonious model, is one where the associations between each of the SE level constructs are assumed to be similar (Model 1, ). We proceeded to compare models with different equality constraints for each of the autoregressive (stability of SE from grade 8 to grade 9) and cross-lagged paths (i.e. skill development path and self-enhancement path), and for each of the within-year associations between SE and test performance. In other words, we tested step-by-step whether model fit improved significantly when each of the paths were allowed to be freely estimated, as compared to when the paths associated with all three SE level constructs were constrained to be equal. A significant improvement in model fit indicates the parameters in question are significantly different, i.e. they cannot be constrained as equal. Based on these step-by-step tests, we specified an overall best-fit model (Model 2), which resulted in significant improvement in model fit, as compared with both Model 0 and Model 1 (see ; see technical appendix for model specifications). Thus, we use the parameter estimates from Model 2 (see ) to address our substantive research questions.
Figure 4. Best fit model (Model 2).
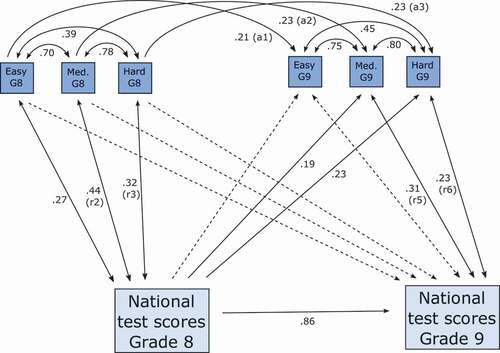
Table 3. Fit indices from structural equation models.
In relation to RQ1, ‘What is the relationship between level-specific SE and performance on national tests in mathematics in grade 8, and level-specific SE and performance on national tests in mathematics in grade 9?’, there are significant associations between students’ national mathematics test performance and their SE for medium difficulty (r = .44/.31) and hard (r = .32/.23) tasks in grade 8 and grade 9, respectively, while the association between students’ performance and SE for easy tasks is significant in grade 8 only (r = .27). The associations are significantly stronger in grade 8 than in grade 9 (p < .01), which is to be expected given that the grade 9 estimates are controlled for previous SE and test performance. There are significant differences between the associations according to SE level, where within each year the associations between performance and SE for medium difficulty and hard tasks are stronger than the association between performance and SE for easy tasks. This is demonstrated through the improvement in model fit (in Model 2) when the association between SE for easy tasks and performance is not constrained to be equal to the other paths (as they were in Model 1).
In relation to RQ2, ‘What is the stability of SE for easy, medium difficulty, and hard tasks between grade 8 and 9?’, students’ SE is significantly stable from grade 8 to grade 9 (β = .21 to .23). In comparison, the stability of students’ national test performance is considerably higher (β = .86), a difference which is statistically significant (p < .001). The stability paths for students’ SE for easy, medium difficulty, and hard tasks are in Model 1 constrained as equal, and there is no significant improvement to model fit when they are lifted in Model 2, thus the stability of students’ SE does not differ according to perceived task difficulty.
Considering the cross-lagged paths (RQ3), ‘What is the magnitude of the cross-lagged effects from earlier level-specific SE on later national test performance (self-enhancement), and earlier national test performance on later level-specific SE (skill development)?’, there is an effect from earlier performance to students’ SE (skill development) for medium difficulty (β = .19) and hard (β = .23), but not easy, tasks. The self-enhancement paths (earlier SE to later performance) are all non-significant. In terms of the skill development paths, there are significant improvements in model fit when equality constraints are lifted, indicating the magnitudes of the effects from earlier performance on later SE differ significantly according to task difficulty, with stronger effects in association with harder perceived task difficulty.
Overall, there is evidence for differential relationships between performance and SE according to levels of perceived difficulty (RQ4), ‘Does the relationships between SE and national test performance differ according to levels of SE?’. While SE for different levels of task difficulty is equally stable across time (RQ2), the associations between SE and performance within each year (RQ1) and the effect from earlier performance to later SE (RQ3) differ according to level of SE. Specifically, the magnitudes are significantly weaker in association with SE for easy tasks, as compared with medium difficulty and hard tasks, as elaborated in the discussion of RQ1 and RQ3.
Discussion
Perceived task difficulty is a central component when students formulate their self-efficacy for future tasks, and when they appraise their past experiences (Bandura, Citation1997). In this paper, we expanded on previous studies on reciprocal effects between self-efficacy and performance by including students’ self-efficacy for easy, medium difficulty, and hard tasks in an empirical investigation related to Norwegian students’ performance on a national mathematics test. Consistent with Bandura (Citation1997), the current study lent empirical support to the theoretical idea that there are differential associations between mathematics SE and performance as a function of perceived task difficulty. Our findings indicated that previous national test scores had a stronger effect on students’ self-efficacy for tasks they perceived to be harder, as compared to tasks they perceived to be easier. Similarly, gains in mathematics self-efficacy in grade 9 were associated with gains in grade 9 national test scores (after controlling for grade 8 self-efficacy and test scores), only in the case of tasks of perceived medium or hard difficulty. While our study lent empirical support to the skill development model, previously supported in a meta-analysis (Talsma et al., Citation2018) and a recent large-scale study (Du et al., Citation2021), most importantly our study demonstrates the value of considering perceived task difficulty when investigating the relationship between SE and performance. In the following paragraphs we will discuss in further detail our findings and their implications. We will start with some key emerging themes about the role of task memorability and importance, before discussing findings in relation to each research question.
Task memorability and importance
SE theory (Bandura, Citation1997) proposes that the main mechanisms through which SE and (test) performance are related are through students’ behaviours or physiological states such as test perseverance or anxiety (in the case of the effect of earlier SE on later test performance), and through appraised mastery experiences as a source for SE (in the case of the effect of earlier performance on later SE). In light of this, our findings (RQ3 and RQ4) indicate that the result students achieve on a national test might serve as a memorable event (see, e.g. Marmur, Citation2019; Stylianides & Stylianides, Citation2014), to the degree that this mastery experience might influence the students’ SE (for medium and hard tasks) for an identical test a year later. Easy tasks require less ability, effort, or perseverance as compared to harder tasks, thus past performance might be less important for students’ formation of SE for easy tasks. Furthermore, it is possible that performance on harder, relative to easier, tasks is more important to the formation of SE because students do not have to struggle to succeed on easy tasks, and thus the event is less imbued with emotion or affect, thereby becoming less memorable. Several researchers (e.g. Hiebert & Grouws, Citation2007; Warshauer, Citation2015) argued that cognitive challenge and struggle is essential for student learning, while Hiebert and Grouws (Citation2007) argued that student struggle is likely to help students develop their persistence and a growth mindset. Some cognitive research also indicated students will remember working on relatively harder tasks to a higher degree than working on relatively easier tasks (Bjork & Bjork, Citation2011).
We conjectured that the relationship between students’ mathematics performance and their subsequent SE is strongest for tasks that present as KMEs, that is, tasks that are memorable, challenging, and imbue positive or negative emotions for students from engaging with. In our study we found a stronger effect of earlier performance on a national test on students’ SE for harder, as compared to easier, tasks, a whole year later. National tests are not ‘everyday tasks’ and might lend themselves as particularly memorable as compared with classroom tasks. Furthermore, we conjectured that students’ previous SE might be more important for their performance on future harder (as compared with easier) tasks, due to the higher need for perseverance on such tasks. However, we found that for the within-year associations (where students’ SE was measured up to two weeks prior to their test performance), the association with performance was strongest for students’ SE for medium difficulty, followed by hard, then easy tasks. While the differences in magnitude were not large, it is conceivable that perceived difficulty has a different bearing on the effect of performance on SE as compared to the effect of SE on performance, as the mechanisms through which SE and performance are related differ.
We also draw attention to the difference between a classroom and a test situation, where there is no teacher support available. Warshauer (Citation2015) discussed ways in which teachers can support students’ productive struggle, without lowering the cognitive demand of the task. While students might give up if the task is too hard during a test, teachers could potentially support continued engagement with and success on relatively harder tasks in a classroom situation, in addition to supporting students’ appraisals of previous performance experiences, thus strengthening both the SE to performance and the performance to SE paths. Future studies could investigate the role of task difficulty and teacher support on the relationship between SE and performance. Furthermore, it would be valuable to test the hypothesis that students’ performance experiences on a perceived challenging task predict students’ SE at the beginning of the next lesson, while their performance experiences on a perceived easy task do not.
The self-efficacy – performance relationship across different time-lags
Although only the cross-lagged effect of grade 8 mathematics performance on grade 9 SE (and not vice-versa) was supported in our study (see RQ3), our RQ1 results indicate that students’ grade 9 SE for medium difficulty and hard tasks were associated with their grade 9 national test scores, after controlling for previous SE and performance. Thus, while test performance in the current study was highly stable, SE still had a significant role in terms of gains in test performance. SE theory (e.g. Pajares & Miller, Citation1995) predicts stronger associations between SE and performance when the SE items correspond with the performance situation, which was confirmed as a moderating effect in the study by Talsma et al. (Citation2018). The items we used to measure SE in our study all refer to the national mathematics test the same year, thus it is reasonable to expect a stronger relationship with students’ performance on the immediately upcoming test, as compared with their performance one year later. It is possible that a reciprocal effects study including SE items referring to mathematics test performance more generally could yield different results. Moreover, it is possible that the (weaker) effect of SE on performance can only be detected across shorter time lags (e.g. one to two weeks), while the (stronger) effect of performance on SE can be detected also across longer time lags (e.g. across a full year). Including different time lags as well as repeated SE and performance cycles might shed further light on the issue of the relative magnitudes of the reciprocal effects between SE and mathematics performance in future studies.
Unlike the case for medium difficulty and hard tasks, gains in grade 9 students’ SE for easy tasks were not associated with gains in their performance from grade 8 to grade 9. As previously discussed, easy tasks do not require much in terms of perseverance or effort, behaviours that are important to test performance. Thus, students might formulate strong SE for easy tasks, without this being a good indicator of their effort or perseverance during a future test. While SE did not predict performance a year later, our findings of RQ1 indicate that students’ SE for medium difficulty and hard tasks are significantly related to test performance in the near future, even as previous SE and performance are controlled. This implies it is worthwhile for teachers to consider ways in which to support students’ SE in addition to supporting their skill development. Performance is not determined by skills alone, but also test or learning behaviours and affective states, which are related to the notion of SE. While succeeding on harder tasks might require both student struggle and perseverance, success on easier tasks is likely to require less effort and be less memorable. This implies that, in terms of supporting changes to students’ SE, classroom time is relatively better spent on supporting student engagement with and success on challenging tasks (albeit fewer), rather than on students working with and succeeding on less challenging tasks (albeit larger in number).
Stability of self-efficacy over time
Considering now RQ2, we found that students’ mathematics SE was significantly stable from grade 8 to grade 9. High stability of SE would be beneficial for students with strong SE, while for students with weak SE high stability might indicate they do not change their SE even after positive performance experiences – i.e. they interpret new information and experiences in a way that confirms their previous beliefs (see, e.g. Butz & Usher, Citation2015). While students’ SE was less stable than their mathematics performance, the magnitude of the effect of previous SE on later SE was comparable to the effect of previous performance on later SE (the skill development effect). Our RQ2 finding reiterates the implication discussed above of spending time on tasks that are important and memorable, if and when the goal is to affect changes to students’ mathematics SE. In our study across the span of a year we found no differences in the stability of students’ SE according to perceived task difficulty. Future studies can investigate SE changes for tasks of different levels of difficulty over shorter time spans, such as across a sequence of lessons, in order to better understand the process of SE change which happens across appraised learning events (Bandura, Citation1997), rather than across months or years.
Support for the skill development model
In relation to RQ3, we found support for the skill development model, that is, the effect of earlier mathematics test performance on later SE, in the case of students’ SE for medium difficulty and hard tasks. In terms of previous reciprocal effects studies, our findings differ from those by Schöber et al. (Citation2018) and Grigg et al. (Citation2018) while they are consistent with the findings from the meta-analysis by Talsma et al. (Citation2018) for school-aged children, as well as the findings by Du et al. (Citation2021) and Bernacki et al. (Citation2015). Furthermore, previous studies that provided support for reciprocal effects between SE and performance in the case of adults (Du et al., Citation2021; Talsma et al., Citation2018) found that the dominant direction of the effect is from performance to SE, which is consistent with our study. Differences between studies in relation to both design and cultural context means that it is hard to dissociate methodological effects from ‘real’ substantive findings. One potential explanation to the non-significant skill development effects in the studies by Schöber et al. (Citation2018) and Grigg et al. (Citation2018) is the way they measured SE (four-point Likert scales). Previous studies found the associations between performance and SE were moderated by scale type, with stronger effects detected in studies using unipolar as compared with Likert-type scales (Pajares et al., Citation2001; Talsma et al., Citation2018). Furthermore, none of the previous studies included different levels of SE in their investigation of reciprocal effects, which may have provided a more fine-grained picture.
The role of perceived task difficulty
Overall, our results for RQ4 indicated differential relationships between national tests and SE for easy, medium difficulty, and hard levels of perceived difficulty. The associations with test scores each year were significantly stronger for medium difficulty and hard tasks, as compared with easy tasks, which is in line with previous research on memory SE (Locke et al., Citation1984). Furthermore, previous performance on national mathematics tests predicted students’ SE for medium difficulty and hard, but not easy, tasks. As we argued, it is likely that students interpret earlier success on easy tasks as less important in terms of their SE – i.e. these successes may be perceived as less indicative of future performance capabilities as compared with successes on harder tasks. Furthermore, it is likely that SE is more important to students’ performance on harder tasks, i.e. that test behaviours such as perseverance are more crucial for performance on medium difficulty and hard tasks, as compared with easy tasks. This points to the role of ‘overcoming struggle’ in terms of affecting changes in students’ SE, and the value of engaging students in activities that are challenging and memorable, yet appropriate for them with effort and support. As such, students’ SE and performance both may benefit if teachers are able to: (a) ascertain how individual students interpret task demands in terms of perceived level of difficulty; and (b) provide each student with opportunities to engage with perceived medium difficulty and hard tasks, as well as adapted support in order to experience mastery on these.
Limitations
There were several limitations to our study. First, our sample size was limited, and further cross-national comparisons are necessary for generalisation both within and beyond the Norwegian context. Second, our study is limited by contextual factors, particularly to grade 8 and grade 9 students in Norway. Weidinger et al. (Citation2018) found that the effect of children’s competence beliefs (self-concept) on their mathematics performance increased over time. Weidinger et al. (Citation2018) argued that developmental factors as well as school system factors (e.g. normative comparisons) were related to this trend. It is possible there is a similar trend in the case of students’ mathematics SE, and that the effect of SE on performance might increase with age. In Norway it would be interesting to investigate this relationship in the case of, for example, students at the beginning of grade 10, when students are likely to become increasingly aware of their end-of-year exams. Our findings are also limited in that we could not control for other factors that may have influenced students’ SE and test performance such as students’ individual socioeconomic background. A third limitation of our study is that some of the items, particularly for the easy tasks, were slightly skewed.
Conclusion
To conclude, in our study we demonstrated the benefits of considering levels of perceived task difficulty when investigating the relationship between students’ SE and mathematics performance. Our empirical investigation lends support to the notion that the dominant direction of effect is from mathematics performance to SE, while it also illustrates differential effects in the SE – performance relationship according to task difficulty. Future studies that would include students’ SE for tasks of different perceived levels of difficulty could further expand our understanding of the relationship between SE and mathematics performance across different test and learning situations, varying time lags, and for children of different ages.
Acknowledgments
This study was in part funded by the Research Council Norway (Norges Forskningsråd); the Grant Number is 218282/H20 (PRAKUT: Learning regions project).
Disclosure statement
No potential conflict of interest was reported by the author(s).
Correction Statement
This article has been corrected with minor changes. These changes do not impact the academic content of the article.
Additional information
Funding
Notes on contributors
Karin E. S. Street
Karin E. S. Street is Associate Professor of Education at the Department of Pedagogy, Religion, and Social Studies at the Western Norway University of Applied Sciences. She completed her PhD at the University of Oxford, where she focused on students’ mathematics self-efficacy. She teaches in initial teacher education, works with schools to support professional development, and is a member of an international network on systematic observation in education. Her research interests include the development of students’ mathematics self-efficacy, processes of learning and motivation, and student-teacher interaction.
Gabriel J. Stylianides
Gabriel J. Stylianides is Professor of Mathematics Education at the University of Oxford and Fellow of Oxford’s Worcester College. His research focuses on issues related to the meaningful engagement of students in fundamental mathematical practices. He published 4 books and over 90 other articles in refereed journals, conference proceedings, or edited volumes. His research received support from the US National Science Foundation, the US Department of Education, the Education Endowment Foundation, the Spencer Foundation, and the John Fell Fund. He was an Editor of Research in Mathematics Education and is currently an Editorial Board member of the Elementary School Journal, the Journal of Mathematical Behavior, the International Journal of Educational Research, and Asian Journal for Mathematics Education.
Lars-Erik Malmberg
Lars-Erik Malmberg is Professor in Quantitative Methods in Education, at the Department of Education, University of Oxford. He is Docent in Education with particular focus on quantitative methods, at Åbo Akademi University, Vasa, Finland, where he also earned his Doctorate. He did his post-doc at Yale University, and enjoyed the prestigious Research Councils UK (RCUK) academic fellowship. He has published around 70 peer-reviewed papers and book chapters. He was Editor-in-Chief of the Journal of Learning and Instruction 2018-2021. His research interests are on intrapersonal models of learning experiences, psychophysiology, student-teacher interaction, and educational effects on child developmental outcomes.
References
- Bandura, A. (1997). Self-efficacy: The exercise of control. W. H. Freeman and Co.
- Bandura, A. (2006). Guide for constructing self-efficacy scales. In F. Pajares & T. C. Urdan (Eds.), Self-efficacy beliefs of adolescents (pp. 307–337). Information Age Publishing.
- Bernacki, M. L., Nokes-Malach, T. J., & Aleven, V. (2015). Examining self-efficacy during learning: Variability and relations to behavior, performance, and learning. Metacognition and Learning, 10(1), 99–117. https://doi.org/10.1007/s11409-014-9127-x
- Bjork, E. L., & Bjork, R. (2011). Making things hard on yourself, but in a good way: Creating desirable difficulties to enhance learning. In M. A. Gernsbacher, R. W. Pew, L. M. Hough, & J. R. Pomerantz (Eds.), Psychology and the real world: Essays illustrating fundamental contributions to society (pp. 55–64). Worth Publishers.
- Brown, T. A. (2015). Confirmatory factor analysis for applied research. Guildford press.
- Butz, A. R., & Usher, E. L. (2015). Salient sources of early adolescents’ self-efficacy in two domains. Contemporary Educational Psychology, 42, 49–61. https://doi.org/10.1016/j.cedpsych.2015.04.001
- Chen, F. F. (2007). Sensitivity of goodness of fit indexes to lack of measurement invariance. Structural Equation Modeling: A Multidisciplinary Journal, 14(3), 464–504. https://doi.org/10.1080/10705510701301834
- Chen, P., & Zimmerman, B. J. (2007). A cross-national comparison study on the accuracy of self-efficacy beliefs of middle-school mathematics students. Journal of Experimental Education, 75(3), 221–244. https://doi.org/10.3200/JEXE.75.3.221-244
- Du, C., Qin, K., Wang, Y., & Xin, T. (2021). Mathematics interest, anxiety, self-efficacy and achievement: Examining reciprocal relations. Learning and Individual Differences, 91(19), 1–8. https://doi.org/10.1016/j.lindif.2021.102060
- Grigg, S., Perera, H. N., McIlveen, P., & Svetleff, Z. (2018). Relations among math self efficacy, interest, intentions, and achievement: A social cognitive perspective. Contemporary Educational Psychology, 53(January), 73–86. https://doi.org/10.1016/j.cedpsych.2018.01.007
- Hiebert, J., & Grouws, D. A. (2007). The effects of classroom mathematics teaching on students’ learning. In F. Lester (Ed.), Second handbook of research on mathematics teaching and learning (pp. 371–404). Information Age Publishing.
- Hoyle, R. H. (2015). Introduction and overview. In R. H. Hoyle Ed., Handbook of structural equation modeling ( Paperback. pp. 3–16). The Guildford Press.
- Hu, L., & Bentler, P. M. (1999). Cutoff criteria for fit indexes in covariance structure analysis: Conventional criteria versus new alternatives. Structural Equation Modeling: A Multidisciplinary Journal, 6(1), 1–55. https://doi.org/10.1080/10705519909540118
- Kline, R. B. (2011). Principles and practice of Structural Equation Modeling (3rd ed.). The Guildford Press.
- Langfeldt, G. (2015). Skolens kvalitet skapes lokalt. In Skolens kvalitet skapes lokalt. Presentasjon av funn fra forskningsprosjektet “Lærende Regioner”. Fagbokforlaget.
- Little, T. D., Cunningham, W. A., Shahar, G., & Widaman, K. F. (2002). To parcel or not to parcel: Exploring the question, weighing the merits. Structural Equation Modeling: A Multidisciplinary Journal, 9(2), 151–173. https://doi.org/10.1207/S15328007SEM0902_1
- Locke, E. A., Frederick, E., Lee, C., & Bobko, P. (1984). Effect of self-efficacy, goals, and task strategies on task performance. Journal of Applied Psychology, 69(2), 241–251. https://doi.org/10.1037/0021-9010.69.2.241
- Marmur, O. (2019). Key memorable events: A lens on affect, learning, and teaching in the mathematics classroom. Journal of Mathematical Behavior, 54, 1-16. https://doi.org/10.1016/j.jmathb.2018.09.002
- Marsh, H. W., Trautwein, U., Lüdtke, O., Köller, O., & Baumert, J. (2013). Academic self-concept, interest, grades, and standardized test scores: Reciprocal effects models of causal ordering. Child Development, 76(2), 397–416. https://doi.org/10.1111/j.1467-8624.2005.00853.x
- Matsui, T., Matsui, K., & Ohnishi, R. (1990). Mechanisms underlying math self-efficacy learning of college students. Journal of Vocational Behavior, 37(2), 225–238. https://doi.org/10.1016/0001-8791(90)90042-Z
- Multon, K. D., Brown, S. D., & Lent, R. W. (1991). Relation of self-efficacy beliefs to academic outcomes: A meta-analytic investigation. Journal of Counseling Psychology, 38(1), 30–38. https://doi.org/10.1037//0022-0167.38.1.30
- Muthén, L. K., & Muthén, B. O. (2012). Mplus User`s Guide (7th ed.). Muthén & Muthén.
- National Center for Education Statistics. (2003). Educational longitudinal study of 2002: Base year field test report (Working Paper Series (Working Paper Np. 2003-03)).
- Nicholls, J. G. (1978). The development of the concepts of effort and ability, perception of academic attainment and the understanding that difficult tasks require more ability. Child Development, 49(3), 800–814. https://doi.org/10.2307/1128250
- Norwegian Directorate for Education. (2016). Nasjonale prøver. http://www.udir.no/Vurdering/Nasjonale-prover/
- Opplæringslova. (1998) Testimony of ministry of education and research. https://lovdata.no/lov/1998-07-17-61/§8-4
- Pajares, F., & Miller, M. D. (1994). Role of self-efficacy and self-concept beliefs in mathematical problem solving: A path analysis. Journal of Educational Psychology, 86(2), 193–203. https://doi.org/10.1037/0022-0663.86.2.193
- Pajares, F., & Miller, M. D. (1995). Mathematics self-efficacy and mathematics performances: The need for specificity of assessment. Journal of Counseling Psychology, 42(2), 190–198. https://doi.org/10.1037/0022-0167.42.2.190
- Pajares, F. (1996). Self-efficacy beliefs and mathematical problem-solving of gifted students. Contemporary Educational Psychology, 21(4), 325–344. [pii]. https://doi.org/10.1006/ceps.1996.0025
- Pajares, F., Hartley, J., & Valiante, G. (2001). Response format in writing self-efficacy assessment: Greater discrimination increases prediction. Measurement and Evaluation in Counseling and Development, 33(4), 214–221. https://doi.org/10.1080/07481756.2001.12069012
- Pampaka, M., Kleanthous, I., Hutcheson, G. D., & Wake, G. (2011). Measuring mathematics self-efficacy as a learning outcome. Research in Mathematics Education, 13(2), 169–190. https://doi.org/10.1080/14794802.2011.585828
- Ravlo, G., & Johansen, O. H. (2013). Nasjonal prøve i regning 8. og 9. trinn 2012 (NTNU: Nasjonalt senter for matematikk i opplaeringen (NSMO)).
- Ravlo, G., Vinje, B., Johansen, O. H., & Åsenhus, R. (2014). Den nasjonale prøven i regning for 8. og 9. trinn 2013. (NTNU: Nasjonalt senter for matematikk i opplaeringen (NSMO)).
- Schöber, C., Schütte, K., Köller, O., Mcelvany, N., & Gebauer, M. M. (2018). Reciprocal effects between self-efficacy and achievement in mathematics and reading. Learning and Individual Differences, 63(January 2017), 1–11. https://doi.org/10.1016/j.lindif.2018.01.008
- Schulz, W. (2005). Mathematics Self-Efficacy and student expectations. Results from PISA 2003. Annual meetings of the American educational research association, April, 11–15.
- Sørlie, K., & Söderlund, G. (2015). Regionale forskjeller i mestringsforventninger. In G. Langfeldt (Ed.), Skolens kvalitet skapes lokalt. Presentasjon av funn fra forskningsprosjektet “Lærende Regioner”. Fagbokforlaget. 235–254.
- Statistics Norway. (2020, April 8). Elevar i grunnskulen. https://www.ssb.no/utdanning/statistikker/utgrs
- Street, K. E. S., Malmberg, L.-E., & Stylianides, G. J. (2017). Level, strength, and facet-specific self-efficacy in mathematics test performance. ZDM - Mathematics Education, 49(3), 379–395. https://doi.org/10.1007/s11858-017-0833-0
- Stylianides, A. J., & Stylianides, G. J. (2014). Impacting positively on students’ mathematical problem solving beliefs: An instructional intervention of short duration. The Journal of Mathematical Behavior, 33, 8–29. https://doi.org/10.1016/j.jmathb.2013.08.005
- Talsma, K., Schüz, B., Schwarzer, R., & Norris, K. (2018). I believe, therefore I achieve (and vice versa): A meta-analytic cross-lagged panel analysis of self-efficacy and academic performance. Learning and Individual Differences, 61(January), 136–150. https://doi.org/10.1016/j.lindif.2017.11.015
- Valentine, J. C., & DuBois, D. L. (2005). Effects of self-beliefs on academic achievement and vice versa. In H. Marsh, R. Craven, & D. McInerney (Eds.), New Frontiers for self research (pp. 53–77). Information Age Publishing Inc.
- Warshauer, H. K. (2015). Productive struggle in middle school mathematics classrooms. Journal of Mathematics Teacher Education, 18(4), 375–400. https://doi.org/10.1007/s10857-014-9286-3
- Weidinger, A. F., Steinmayr, R., & Spinath, B. (2018). Changes in the relation between competence beliefs and achievement in math across elementary school years. Child Development, 89(2), e138–e156. https://doi.org/10.1111/cdev.12806
- Yetkin Özdemir, İ. E., & Pape, S. J. (2013). the role of interactions between student and classroom context in developing adaptive self-efficacy in one sixth-grade mathematics classroom. School Science and Mathematics, 113(5), 248–258. https://doi.org/10.1111/ssm.12022
- Zimmerman, B. J., Bandura, A., & Martinez-Pons, M. (1992). Self-motivation for academic attainment: the role of self-efficacy beliefs and personal goal setting. American Educational Research Journal, 29(3), 663–676. http://www.jstor.org/stable/1163261.
- Zimmerman, B. J. (2000). Self-efficacy: An essential motive to learn. Contemporary Educational Psychology, 25(1), 82–91. https://doi.org/10.1006/ceps.1999.1016