
ABSTRACT
While self-assessment is a widely explored area in educational research, our understanding of how students assess themselves, or in other words, generate self-feedback, is quite limited. Self-assessment process has been a black box that recent research is trying to open. This study explored and integrated two data collections (secondary and higher education) that investigated students’ real actions while self-assessing, aiming to disentangle self-assessment into more precise actions. Our goal was to identify self-assessment processes and profiles to better understand what happens when students self-assess and to design and implement better interventions. By combining such data, we were able to explore the differences between secondary and higher education students, the effects of external feedback on self-assessment, and to propose a model of ideal self-assessment (SEFEMO). Using think-aloud protocols, direct observation and self-reported data, we identified six main actions (read, recall, compare, rate, assess, and redo) and four self-assessment profiles. In general, secondary and higher education students showed the same actions and very similar profiles. External feedback had a negative effect on the self-assessment actions except for the less advanced self-assessors. Based on data from more than 500 self-assessment performances, we propose a model of self-feedback.
Self-assessment is one of the main lines of work in educational research. For decades, scholars have been investigating the impact of self-assessment on variables such as academic performance, self-regulated learning, and motivation, finding that self-assessment can have positive effects (Brown & Harris, Citation2014; Dochy et al., Citation1999; Sitzmann et al., Citation2010). However, some aspects of self-assessment have not been sufficiently investigated, including how self-assessment actually occurs (Panadero et al., Citation2016). Recently, this specific topic, called the black box of self-assessment, has started to be investigated via interview data (Pinedo et al., Citation2023; Yan & Brown, Citation2017) and think-aloud protocols and direct observation (Panadero et al., Citation2012, Citation2020, Citation2023a, Citation2023b), illustrating what strategies and criteria students use when self-assessing. However, more research is needed to elucidate the underlying mechanisms driving these self-assessment processes, the conditions under which they are most effective, and how these strategies can be cultivated and optimised within diverse educational contexts. Additionally, we also need to better understand what role is played by crucial instructional and educational factors such as educational level and feedback when it comes to influencing self-assessment (Panadero et al., Citation2016). Therefore, our aim is to identify and validate different profiles of self-assessment that will lead us to a specific model of self-feedback.
From self-assessment to self-feedback
Self-assessment ‘most generally involves a wide variety of mechanisms and techniques through which students describe (i.e. assess) and possibly assign merit or worth to (i.e. evaluate) the qualities of their own learning processes and products’ (Panadero et al., Citation2016, p. 804). The same authors reviewed how many types of self-assessment existed in the literature identifying five different typologies with a range of diverse self-assessment practices. Thus, self-assessment practices can be quite different yet the fundamental idea is to reflect about one’s own work.
Recent developments in educational psychology emphasise a redefined approach to self-assessment, increasingly viewed as a cornerstone of formative assessment. For example, Andrade (Citation2010, Citation2018) suggested that self-assessment’s primary function is to provide feedback that fosters deeper learning and performance improvement. Building on this, Panadero et al. (Citation2019) presented the concept of ‘self-feedback’ as a practical application of self-assessment aimed at generating feedback for students’ own educational progress. Panadero and colleagues outlined six strategies to facilitate this transformation, including making self-assessment’s implicit elements explicit, focusing on content over scoring accuracy, adopting a developmental approach, linking self-feedback with self-regulated learning, exploring individual and interpersonal factors, and connecting self-feedback to evaluative judgement for long-term learning. Two years later, Nicol (Citation2021) labelled the same process as ‘internal feedback’, focusing in the role of comparison and alignment outlined by Panadero et al. (Citation2019). Furthermore, Yan and Carless (Citation2021) discussed the concept of ‘feedback literacy’, aligned with the aforementioned ideas and underscoring self-feedback’s importance in student learning.
Importantly, as we transition from self-assessment to self-feedback, Sadler’s critique of the subjectivity inherent in teacher judgements (Sadler, Citation2005) underscores the need for explicitness in the criteria used. Sadler’s work emphasises the importance of transparent, clearly defined assessment criteria as a fundamental component of effective educational practices (Sadler, Citation2007). By making these criteria and standards more transparent, students can engage more effectively with self-feedback processes, aligning with the goal of fostering deeper learning and performance improvement as suggested by Andrade (Citation2010, Citation2018).
This body of work collectively underlines the importance of leveraging self-assessment for formative purposes, suggesting a triple benefit: enhancing students’ self-feedback capabilities, facilitating strategy transfer across contexts and domains, and ultimately, preparing students to be effective generators of self-feedback, a fundamental educational objective.
Opening the black box of self-assessment
To enhance the effectiveness of self-feedback in students, a deeper understanding of the self-assessment process is crucial (Panadero et al., Citation2016). Those authors highlighted the need for exploring critical questions about self-assessment, such as: are all self-assessments equal? What elements differentiate a superficial self-assessment from a thorough one? What can we do instructionally to ensure self-feedback takes place? Although initial results are promising, research in this innovative area is still developing.
Based on such proposition, Yan and Brown (Citation2017) aimed to demystify self-assessment through an interview study involving undergraduate students, identifying three key actions: setting performance criteria, seeking self-directed feedback, and engaging in self-reflection. Building on this, Yan and Carless (Citation2021) suggested instructional approaches to enhance these actions, like co-constructing rubrics and encouraging explicit written reflections.
Taking a different approach, our team, using methodologies from self-regulated learning theory, observed students’ real-time self-assessment actions (Panadero et al., Citation2012, Citation2020, Citation2023a, Citation2023b). The underlying idea is that studying the phenomenon concurrently to its occurrence (i.e. observing the students self-assess), we reach different and, most likely, more objective results than measuring the phenomenon only retrospectively (e.g. asking students to explain how they self-assess) (Panadero et al., Citation2023b). Recognising humans’ natural bias in self-assessment, especially under high cognitive load (Dunning et al., Citation2004; Kostons et al., Citation2009, Citation2012), we adopted ‘online’ measurements as suggested by Winne and Perry (Citation2000) also known as process data (Panadero et al., Citation2023b). To clarify, ‘online’ in this context refers to the real-time capture and analysis of self-assessment behaviours as they occur, rather than prospective, retrospective or delayed reporting. This approach ensures that our measurements directly correspond with the immediate processes and self-assessment decisions of the participants, providing a more accurate and immediate insight into their self-assessment practices.
At to this point we have collected data from two different samples of secondary and higher education students, using similar data collections but under different research designs (descriptive vs. randomised controlled trial), exploring in both three different year levels. By combining think-aloud protocols, video-recorded observations, questionnaires, and academic performance data, we aimed to gain a more objective understanding of self-assessment. While that data has been published in different articles (Panadero et al., Citation2020, Citation2023a, Citation2023b) our approach there was more compartmentalised as we classified specific strategies and criteria. Here, we have analysed the process holistically, identifying profiles of what different students do and further integrating the data. Additionally, we also explore here two important variables: educational level and external feedback.
Educational level: secondary education vs university students’ self-feedback
The existing argument posits that students’ self-assessment methods may vary based on their expertise. Panadero et al. (Citation2016) categorise this expertise into three distinct interpretations: (1) the maturity level of the students, such as their developmental stage or educational level (Sanchez et al., Citation2017); (2) their specific knowledge or skill level in the domain or task they are assessing (Dochy et al., Citation1999; Yan et al., Citation2020); and (3) their proficiency in conducting self-assessment itself, which encompasses their ability to evaluate their own learning and performance accurately (Boud & Falchikov, Citation1989; Rolheiser, Citation1996).
In this study, we operationalised expertise based on the educational level of our participants coming from two data collections: one from secondary education and the other from higher education. Furthermore, we collected data from three year levels in each educational level: K7, K10 and K11 for secondary education, and first, second, and third for higher education. Therefore, as our data includes such a large age range, from early 10’s to early 20’s, we are also looking to maturity differences. Importantly, in the previous studies, we analyzed the educational level independently as the studies only used a data collection at a time (Panadero et al., Citation2020, Citation2023a, Citation2023b). Here, we will focus exactly on that comparison to explore how students from two different educational levels generate self-feedback.
External feedback: its effects on the generation of self-feedback
Regarding feedback, we adopt the following definition: ‘feedback is information that includes all or several components: students’ current state, information about where they are, where they are headed and how to get there, and can be presented by different agents (i.e. peer, teacher, self, task itself, computer). This information is expected to have a stronger effect on performance and learning if it encourages students to engage in active processing’ (Lipnevich & Panadero, Citation2021, p. 25). This definition covers a large range of practices that can be considered feedback: from achievement level information (Butler, Citation1987) to formative feedback (Narciss & Zumbach, Citation2022), two aspects that we explored. External feedback is defined as any type of information that is provided to the student from an ‘external’ source, which may include teachers, peers, computer-assisted learning environments, and other outside agents. This form of feedback is essential for offering perspectives and insights that the student might not independently realise, serving as a crucial component in the learning and self-assessment process.
The importance of external feedback has been highlighted in seminal self-assessment work (Butler & Winne, Citation1995; Eva & Regehr, Citation2005, Citation2008; Sitzmann et al., Citation2010). Crucially, self-feedback is at the end about ‘making the implicit aspects of self-assessment explicit to correct for self-bias’, and for that correction, external feedback -in whatever shape and form- can be a positive and crucial help (Panadero et al., Citation2019). However, the field of self-assessment has in general not explored the effects of external feedback, probably because self-assessment has been conceptualised as an internal process, as just mentioned. With all this in mind, we explored in our series of studies the effects of feedback on self-assessment strategies and criteria (Panadero et al., Citation2020, Citation2023a, Citation2023b).
Aim and research questions
Our aim was to identify self-assessment processes and profiles to propose a model of ideal self-feedback. We explored five research questions (RQ).
RQ1.
What are the self-assessment profiles of secondary education students before and after external feedback?
RQ2.
What are the self-assessment profiles of higher education students before and after external feedback?
RQ3.
What is the quantitative evidence on the validity of our qualitative profiles?
RQ4.
What are the similarities and differences in the self-assessment profiles of secondary and higher education students?
RQ5.
What are the effects of external feedback -i.e. instructor’s feedback and rubric- in the self-assessment processes?
Method
Participants
As mentioned earlier, this study combines two related but independent data collections. The initial sample comprised 67 secondary education participants and 126 from higher education. However, due to instances of missing data pertinent to the types of analyses conducted in this study (e.g. portions of the video not being correctly recorded), the final sample size for higher education participants was reduced to 111.
In secondary education the sample included 28 (41.8%) students from K7, 25 (37.3%) from K10, and 14 (20.9%) from K11. In higher education the sample included psychology undergraduates: 39 (35.1%) from first year, 35 (31.5%) from second year, and 37 (33.3%) from third year. The gender distribution was 37 (55.2%) females and 30 (44.8%) males in the secondary education study, and 97 (87.4%) females and 14 (12.6%) males in the university study. It is noteworthy that the distribution in the secondary education study is relatively balanced. However, the university study presents a significant gender disparity, with a considerably higher proportion of female participants. This skew towards female participants reflects the typical gender distribution within psychology programmes in Spain, where female enrolment often significantly outnumbers male enrolment. This is a factor worth considering when interpreting the findings and their applicability.
These specific secondary education year levels demarcate distinct phases in the students’ educational journey. K7 marks the beginning of compulsory secondary education in Spain, while K10 signifies its conclusion. K11, conversely, inaugurates the first of two years dedicated to preparing students for university admission. This stage is characterised by notable differences from its predecessor, including its non-compulsory nature and the tendency to attract students with higher academic capabilities (Ministerio de Educación y Formación Profesional, 2022). Further differentiation at this stage emphasises a rigorous academic environment aimed at facilitating students’ transition to higher education. In the context of higher education, our study included participants from the first three years of undergraduate studies, which in total spans four years. This inclusion allows for a comprehensive analysis of the academic development and challenges faced by students at varying levels of their higher education journey.
A convenience sampling process was used at an institutional level, due to the agreement between the research group and the participant institutions. At the participant level, a volunteer sampling procedure was used, and parental permission was needed in secondary education. The participants did not receive any reward in secondary education. In higher education, participants received credit in accordance with the faculty volunteering programme.
Procedure
Data collection procedures differed among the two studies. Data from secondary education students was collected during the course 2016–17, and data from higher education students was collected during academic courses 2017–18 and 2018–19. The complete procedure followed in secondary and higher education is presented in respectively. As the data collection was originally done with different aims, there are substantial differences in the self-assessment activity performed. Such differences are summarised in .
Figure 1. Data collection procedure in secondary education.
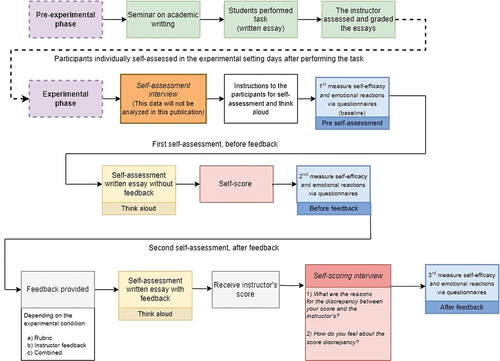
Figure 2. Data collection procedure in higher education.
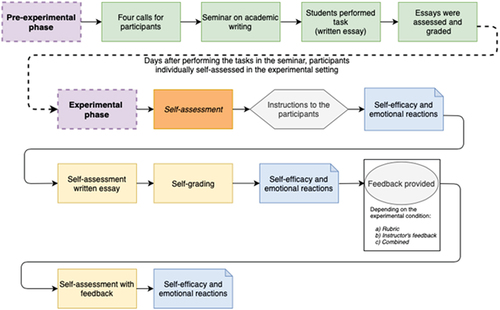
Table 1. Data collection differences between educational stages.
In the first study with secondary education students, the research was presented during classroom time in 12 classroom groups. Students performed two tasks containing different exercises during class time, for Spanish and mathematics subjects. Then, the teachers and the research team collaborated in grading and generating feedback for the activities. Afterwards, the participants individually accompanied a research assistant to a quiet room within the high school. There, the procedure was always the same: (a) participants conducted a self-assessment of the Spanish task without any further instruction; (b) then self-assessed the same Spanish task with the teachers’ feedback; (c) then self-assessed the mathematics task without any further instruction; and (d) self-assessed the same mathematics task with the teachers’ feedback. Teachers’ feedback included a grade and several qualitative comments about the quality of the task and the areas of improvement. Explicit assessment criteria were not offered to the students, which were free to use their own criteria. The participants were prompted before the first self-assessment to think out loud their thoughts, emotions, and motivational reactions. If the participant remained silent for more than 30 seconds, the researcher reminded him/her to think out loud. The whole process took an average of 45 minutes and was video recorded using a video camera on a tripod located within 1 metre of the participant. It is important to note that while this timeframe was necessary to capture comprehensive data, we acknowledge the potential for participant fatigue, which could influence the outcomes of the think-aloud sessions.
In the second study with higher education students, these attended a workshop on academic writing and wrote an essay answering the question: ‘Why is the psychologist profession necessary?’. Some days later, the participants individually accompanied a research assistant to a quiet room. There, (a) participants self-assessed their essay without any further instruction, (b) depending on the experimental condition, written feedback (provided by the seminar instructor, the fifth author), a rubric (designed ad hoc by the researchers for the higher education study, and based on the workshop contents), or a combination of both was provided to the participants, and (c) participants self-assessed their essay again with either. Just as in the first study, the written feedback included a grade and qualitative comments about the quality of the task. For participants in the rubric condition, essays were also graded by the fifth author, and their grade was shared with the participants after the experimental procedure was concluded. As in secondary education, explicit assessment criteria were not offered to the students, which were free to use their own criteria. The participants were prompted before the first self-assessment to think out loud their thoughts, emotions, and motivational reactions. If the participant remained silent for more than 30 seconds, the researcher reminded him/her of the need to think out loud. The whole process took an average of 45 minutes and was video recorded using a video camera on a tripod located within 1 metre of the participant. As with the other data collection, we acknowledge the potential for participant fatigue, which could influence the outcomes of the think-aloud sessions.
Instruments
offers a comprehensive overview of the various instruments employed across the two data collections. Importantly, data from some of the instruments will not be analysed here but we include a detailed account of all the instruments used but not employed in this study to provide transparency in our methodology (Appendix A).
Table 2. Instruments for each educational stage.
Video-recorded data to extract think-aloud
While in the research setting, all the participants were recorded using a video camera. Though videos offered visual information about the participants actions, only participants verbalisations (i.e., think-aloud protocols) were analysed. These think-alouds were analysed and coded by the research team. Later in the document we inform of the exact procedure and the interrater reliability indexes.
Students’ performance
For all participants, their performance in the tasks used for self-assessment was calculated using instructor’s grades (i.e. Spanish and mathematics activities for secondary education, writing task about the Psychology profession for higher education). Additionally, we collected three variables about secondary education participants’ academic performance: their average grades in the academic year including all subjects, their final grades in Spanish and their final grades in mathematics.
Rubric (Appendix B)
The rubric was not provided to secondary education participants, as it was created for the higher education data collection.The rubric was designed observing instructors’ models of writing composition. Importantly, the rubric was only provided to higher education students in the experimental conditions ‘Rubric’ and ‘Combined’. The rubric contains three types of criteria: (1) writing process, (2) structure and coherence, and (3) sentences, vocabulary, and punctuation. There are three levels of quality: low, average, and high. The rubric is analytic as the three criteria should be scored independently.
Instructor’s feedback (Appendix C)
Feedback in all levels and conditions included a grade ranging from 0 to 10 points. In secondary education, the teachers and the research team collaborated in grading and providing feedback for the exercises. Teachers discussed with the research team exemplars of previous years (high, medium and low performance) and provided a criteria list for correcting the exercises. Then the research team graded and provided feedback to five cases for each year level using the directions given by the teacher. In university, instructor’s feedback was only provided to students in the experimental conditions of ‘Instructor’s feedback’ and ‘Combined’. The seminar instructor provided written feedback to each essay using the same categories as the rubric. For the ‘writing process’ criterion, as that was not directly observable by the instructor, he provided feedback by suggesting whether some of those strategies had been put into play by the students (e.g. planning). All essays were evaluated by the fifth author. The first author evaluated a third of the essays reaching total agreement in the rubric categories (see Panadero et al., Citation2023b for more details).
Data coding
The process of data coding to identify the self-assessment profiles for the present study started in April 2020 with the secondary education students’ videos. The goal of this coding was different from the two previous publications that included think-aloud protocols (Panadero et al., Citation2020, Citation2023a). Whereas those studies were dedicated to isolating specific strategies and criteria utilised by participants, the current endeavour sought to map the entirety of the self-assessment sequence, including the type of processes elicited and their order of activation, thereby achieving a more integrated and holistic picture of how self-assessment takes place. Obviously, some processes identified here align with strategies from the previous studies (e.g., ‘read’ is categorised as a process here but was considered a strategy previously), while others are novel (e.g., ‘rate’). Appendix D provides a detailed comparison of the current coding methodology with those used in previous analyses.
The first, second and third authors watched a sample of 10 videos from secondary education participants with distinct characteristics and discussed several categorisations for the students’ self-assessment processes. The think-aloud protocols were analysed and represented our unit of analyses. Based on the content of those protocols we assigned them to the categories earlier discussed. Some of the categories also differentiate two levels of complexity, as the same process could be performed with different degrees of expertise by the students. After the coding of those videos that implied several rounds of discussion, six different processes were inductively proposed. They are, as follows:
Read
The student reads the instructions or question, their answer, or any other part of the task.
Recall
The student describes the instructions or question and their answer from memory, without directly reading what is written and without making a judgement about the quality of their performance of the task.
Compare
The student compares different sources of information, usually the instructions/question against their answer.
Rate
The student makes an estimation (e.g., good, bad, average) about the quality of specific parts of their performance of the task, or about the whole performance.
Assess (Level 1 and Level 2)
The student assesses the quality of his work using different criteria. Usually, it follows the pattern: ‘I think my performance of the task is _____ because _____’. This process shows two levels of performance complexity. In Level 1, the student uses intuitive criteria which are not based in rules and instructions (e.g., ‘I think I did a poor job because I was nervous’). In Level 2, the student uses rule-based criteria according to the task, workshop, or teacher’s instructions (e.g. ‘I think I did a poor job because some of my paragraphs are not really coherent’).
Redo (Level 1 and Level 2)
The student performs again the task or part of it. This process also shows two levels of complexity. In Level 1, the student would perform a general attempt at redoing the task without clear steps; and Level 2 a concrete, active redo process that runs parallel to the actual performance. The success of redo is not determined by whether the student makes a final correction; rather, it is about the engagement in the redo process itself, fostering deeper understanding and self-assessment.
Identification of qualitative profiles
Based on the presence/absence and level of complexity in the use of the six processes from above, four self-assessment profiles were identified: No Self-Assessment (NSA), Superficial Self-Assessment (SSA), Intermediate Self-Assessment (ISA) and Advance Self-Assessment (ASA). We explained this identification procedure in Appendix E, along with the calculation of Krippendorf’s alpha for interrater agreement that reached 1 for secondary education and .841 for higher education.
Quantitative transformation and identification of quantitative profiles
As to perform a quantitative exploration of our qualitative coding and profiles, we transformed our coding categories to scores (see ). Then we established numerical thresholds and identified four quantitative profiles. We explained this process in Appendix F. Additionally, the coding manual can be found in the following link: https://osf.io/4zpts/?view_only=32d4392c37374c979f340659a6cad82e
Table 3. Scores assigned to each process.
Data analysis
For RQ1 and RQ2, a descriptive data analysis was conducted, exploring frequencies of processes and profiles. An analysis of the presence of specific processes in each profile, as well as the order in which the processes are performed, was used to describe each profile. Additionally, to visually represent the self-assessment profiles, we created figures detailing the workflow of processes. For RQ3 we calculated cross tables with their corresponding Kappa, discriminant analyses, and a one-way ANOVA. For RQ4 and RQ5, a qualitative content analysis of the students’ processes was conducted, to explore differences in the profiles depending on the educational level.
Results
Next, we describe each of the profiles accompanied by a flowchart figure to help visualise the processes. The flowcharts include different elements (see ): (a) the rectangle contains the name of the process and the numerical value represents the number of participants that performed such process; (b) arrows trace the sequence of processes, with the numbers within these arrows indicating the count of participants adhering to that specific sequence; and (c) for the processes with more than one level (assess and redo), the number of participants in each level are represented with Level 1 (in white) and Level 2 (in grey). Furthermore, elements encountered in less than 20% of the profile’s participants are rendered in pale grey. This colour differentiation aims to direct the reader’s attention towards the processes undertaken by the majority, thereby facilitating a clearer understanding of the predominant self-assessment processes within each profile.
Figure 3. Example of the flowchart figure.
RQ1. What are the self-assessment profiles of secondary education students before and after external feedback?
As mentioned earlier, we identified six main processes grouped around four self-assessment profiles.
No Self-Assessment (NSA)
NSA is the less frequent profile, identified in 4 to 8 participants, depending on the occasion. presents the flowcharts. In the Spanish task two participants first read the performed task while two others just started recalling it. Then one of the participants that read the task moved into recall. Finally, one of the three participants also rate the work. When feedback was provided, students started by reading or rating the quality of the task, and then compared their task with the instructor’s comments.
Figure 4. No self-assessment profile (NSA) in secondary education.
In mathematics, the usual pathway was to recall how they performed the task and rated its quality. However, this rating was only done over few specific aspects of the task but not as a whole, which differentiates these cases from more advanced profiles. When feedback was provided, the rating stopped, and the students just read the task and recalled it.
Superficial Self-Assessment (SSA)
presents the flowcharts. In Spanish, most started by reading the exercise and their response; then, rated the quality of their performance (12 cases). An alternative pathway was to recall their performance, but it was marginal. Lastly, after rating the quality of the task, students usually assessed the task, using simple criteria. When feedback was provided, reading, rating, and assessing remained, but seven of them also compared the task with the feedback they had received.
Figure 5. Superficial self-assessment profile (SSA) in secondary education.
In mathematics, most participants also started by reading their task, but differently to what they did in Spanish, they tended to think of different responses after reading it. After that, they usually rated the quality of their task, and assessed it using mostly basic criteria (level 1). When feedback was provided, the act of thinking on different responses was no longer used, and participants went straight to rate their task after reading it.
Intermediate Self-Assessment (ISA)
presents the flowcharts. In Spanish, 25 participants started by reading their task, and two main sequences emerged. First, some rated their performance after reading and most ended the process assessing (level 2). The second sequence inverted the order: participants assessed the task after reading it and ended rating. When feedback was provided, rate was less used, while compare the task with the instructor feedback increased.
Figure 6. Intermediate self-assessment profile (ISA) in secondary education.
In mathematics, we identified the same two sequences just described but with lower frequencies. A difference was that in mathematics some participants ‘redo’ parts of their task: six participants actively rewrote their responses, thus showing higher initiative than the participants in the Superficial Self-Assessment category. This changed when feedback was provided: participants read, rated its quality, and assessed it, using mostly advanced criteria. However, participants did not enact the redo process.
Advanced Self-Assessment (ASA)
presents the flowcharts. This profile was not frequent, especially in Spanish, and it was characterised by the active redo of their entire performance of the tasks or considerable parts. In Spanish, the participants started by reading the task, then performed the processes of redo the task, rate its quality and assess the task using mostly advanced criteria. When feedback was provided, the act of comparing the task with the instructor feedback was performed after reading the task.
Figure 7. Advanced Self-Assessment profile (ASA) in secondary education.
In mathematics, the situation was very similar. The participants started by read their task, and then redo it. After that, most participants rate the quality of their work and, lastly, assess it using advanced criteria. When feedback was provided, the same processes of read, redo, rate, and assess were performed, but following different order depending on the participant.
RQ2. What are the self-assessment profiles of higher education students before and after external feedback?
For higher education participants, the six processes were also applicable and we also identified four profiles that are very similar the secondary education participants’ profiles. Next, we describe each profile.
No Self-Assessment (NSA)
Once again, this was the less common profile among participants (). The participants read their pieces of work, and then recall their performance. Crucially, these were not carried out systematically nor in depth during their self-assessments. This profile was a little more common when feedback was provided. Then, participants read the task, being in most cases the only process they elicited. However, in three cases they rated the quality of their performance after reading their pieces of work.
Figure 8. No self-assessment profile (NSA) in higher education.
Superficial Self-Assessment (SSA)
presents the flowchart. Usually, participants started by reading their work. Then, most participants rated the quality of their work and assessed it, using mostly basic criteria. However, a second group of participants recalled their performance after reading it, and before rating its quality. When feedback was provided the situation was similar, with the main difference being that the participants assessed their work using advanced criteria in most cases.
Figure 9. Superficial self-assessment profile (SSA) in higher education.
Intermediate Self-Assessment (ISA)
This profile () was the most common among the university students and was also more complex than the previous two. Almost all the participants started by reading their work, then they either rated and assessed its quality, or recalled. In the most frequent pattern, participants read their work, rated its quality, and assessed it using advanced criteria. When feedback was provided, the situation was almost the same, but the process of recalling was frequently not performed by the participants.
Figure 10. Intermediate self-assessment profile (ISA) in higher education.
Advanced Self-Assessment (ASA)
presents the flowchart. As can be seen, almost all the participants executed the three most advanced processes: rate, assess, and redo. This clearly shows that the self-assessment processes identified in this profile were the most advanced. However, the order in which these processes were performed varied among the participants. Interestingly, this profile was much less common when feedback was provided. In this profile, the participants started by reading their work, assessed it using advanced criteria, rated its quality and thought of different possible ways of performing the task.
Figure 11. Advanced self-assessment profile (ASA) in higher education.
RQ3. What is the quantitative evidence on the validity of our qualitative profiles?
We investigated this research question by means of three different data analyses: cross tables, discriminant analyses, and ANOVAs. It is important to remember that the identification of the qualitative profiles was based on the observation of a number of processes (see RQ1 and RQ2 above), and the calculation of the quantitative profiles was performed using the scores presented in the section ‘Quantitative transformation and identification of quantitative profiles’. These scores were based on the occurrence of the same processes used for the qualitative profiles. This dual approach allowed us to achieve a holistic understanding through qualitative profiles, which reflect the interpretative insights of the researchers, as well as through quantitative profiles, which offer a structured and numerical perspective. Notably, a direct connection exists between these two profile types, underscoring the interconnectedness of our analytical methodologies.
First, we explored the relationship between our qualitative profiles and the quantitative profiles. For this, we calculated cross tables for each of the six self-assessments (see appendix G), with their corresponding Kappa statistic, in which values above .6 are considered appropriate for our type of comparison. All but one were above such value: (1) secondary education Spanish without feedback Kappa = .655; (2) secondary education Spanish with feedback Kappa = .683; (3) secondary education Mathematics without feedback Kappa = .378; (4) secondary education Mathematics with feedback Kappa = .850; (5) higher education writing task without feedback Kappa = .669; and (6) higher education writing task with feedback Kappa = .633. Therefore, there seems to be a relationship among the two types of profiles, validating our qualitative approach (i.e. qualitative profiles).
Second, we calculated four discriminant analyses which explore how can we best discriminate an already created set of groups using several predictors. We chose to conduct four discriminant analyses rather than six, prioritising a clear comparison between the impacts of different types of tasks – Spanish/writing versus mathematics – on our study groups. This decision was also influenced by our relatively small sample size, which made a simpler analytical framework preferable to ensure adequate statistical power and more reliable interpretations of the data across these primary task categories. For this, we merged the secondary and higher education samples in the first two discriminant analyses, both of which pertained to Spanish/Writing tasks – with and without feedback. The final two analyses were restricted to secondary education participants engaged in mathematics tasks – with and without feedback.
provides a detailed statistical overview (Appendix H presents the four All-groups scatter plots). The analyses across the tasks reveal significant differences among profiles, with the first discriminant function in each analysis explaining a substantial portion of the variance: 73.7% for Spanish/Writing without feedback, 67.3% with feedback, 71.3% for Mathematics without feedback, and 57.2% with feedback. Each scenario showed strong differentiation among profiles, confirming the robustness of the identified qualitative profiles through statistical means. These results, reinforce the previous results in this RQ in that the four qualitative profiles we identified are also found statistically via discriminant analysis.
Table 4. Summary discriminant analyses.
Finally, we also explored whether our qualitative profiles were able to identify different levels of academic performance. For that, we run a one-way ANOVA using as dependent variable academic performance in which we included the grades obtained in the Spanish, mathematics and writing tasks; using as independent variable the general qualitative profile that averaged the without and with feedback profiles. There was a significant effect of the qualitative profiles F(4, 226) = 2.80, p = .041, η2 = .036. Pairwise comparisons post hoc revealed that participants in the Superficial Self-Assessment profile (M = 6.22 SE = .23) showed a significantly (p = .027) lower academic performance than participants in the Intermediate Self-Assessment profile (M = 6.86 SE = .17), and also significantly lower (p = .01) than participants in the Advanced Self-Assessment profile (M = 7.22 SE = .32). Participants in the No Self-Assessment profile (M = 6.31, SE = .50) did not differ significantly from the other groups. This last result, might have been influenced by the lower number of participants that fell under the No Self-Assessment profile (n = 14) which might have impacted the statistical power. The other profiles included more participants (Superficial Self-Assessment n = 67; Intermediate Self-Assessment n = 115; Advanced Self-Assessment n = 34). In summary, we interpret these results as another type of discriminant validation for the qualitative profiles, keeping in mind the lack of significace on the No Self-Assessment profile.
RQ4. What are the similarities and differences in the self-assessment profiles of secondary and higher education students?
In terms of the similarities, a crucial one is that our participants executed actions that were all classified in six categories of processes, regardless of their educational level. Additionally, the main characteristics of the profiles were similar in both secondary and higher education students (e.g. the already mentioned presence of the ‘redo’, ‘assess’ and ‘rate’ processes during their self-assessment).
However, we identified differences of two types. First, the distribution of cases is different among the two educational levels (see ). And second, there were subtle differences in the way each profile is carried out by students depending on their educational level. Next, we highlight four main differences.
Table 5. Frequencies of self-assessment profiles for each educational level.
How students process the information
Secondary education participants had a more direct way of processing the information provided; in most of the cases it was limited to reading the task and the feedback when available. In a few cases, participants did not read their work directly, but recalled its characteristics instead. However, in higher education the relationship between these two processes was different. University participants recalled their work much more frequently, in addition to reading it. This allows them to perform a deeper and more nuanced interpretation of the information.
How students redo their tasks
Secondary education participants were not very prone to redo their work, especially in Spanish. However, for those who activated the redo process, it was common to actively rewrite their work (level 2), attempting to improve it. On the contrary, university participants were more passive when redoing their tasks. Instead of rewriting their essays or part of them, they usually thought aloud alternative responses or ways of expressing the same ideas (level 1).
The effects of subject matter
When we compared the Spanish pieces of work, the self-assessment of secondary education participants was, in general terms, simpler and more superficial in comparison with university students. However, the mathematics self-assessment of secondary education participants is more similar to the university participants, especially in the higher profiles. The percentage of mathematics Advanced Self-Assessment profile of secondary education participants (25.4%) was similar to the Spanish Advanced Self-Assessment profile in higher education (19.8%), and more importantly the sequence of processes was similarly complex with a small presence of describing and comparing.
It is important to highlight, as shown by , that the distribution of self-assessment profiles in mathematics was more balanced across the four categories than in Spanish were there was an uneven distribution. This suggests that the discipline of study significantly influences the distribution of self-assessment profiles, a contrast that merits further investigation to understand subject-specific self-assessment dynamics.
The effects of external feedback
The delivery of external feedback also had effects on the processes followed in each profile. First, feedback seems to help homogenise the processes performed by the participants, as can be observed in , which show simpler sequences when feedback was delivered. Second, while some processes seem to decrease after receiving feedback (e.g. recall or redo in ), some others seem to increase. The best example is the process of compare, more popular after receiving feedback as students tend to compare the external feedback against their work. We will dig deeper into such effects in the next RQ.
RQ5. What are the effects of external feedback -i.e. instructor’s feedback and rubric- in the self-assessment processes?
To answer this research question, we compared the self-assessment profiles before and after receiving external feedback. First, we performed a chi-square to explore if the two types of profiles were related. The relation between these variables was significant, X2 (9, N = 173) = 71.16, p = .000, indicating that both were related.
Second, we created three cross tables to compare the trajectories of the participants: Spanish secondary education, mathematics secondary education, and writing higher education. We will next explore the trends in these categorical variables.
Regarding Spanish self-assessment for secondary education participants (), we analysed the four profiles one by one. In the No Self-Assessment profile, the external feedback improved the self-assessment process of three participants that moved to the Superficial Self-Assessment profile. In the Superficial Self-Assessment profile, thirteen participants remained in the same category after receiving the feedback, while nine moved to a lower category and two moved to a higher category. In the Intermediate Self-Assessment profile, while thirteen participants remained at the same level, seventeen deteriorated in their processes, going down. In the Advanced Self-Assessment profile, only one participant stayed at the same level, while five moved down. Therefore, except for the No Self-Assessment profile, the rest performed worse after receiving feedback.
Table 6. Cross table of Spanish self-assessment profiles for secondary education participants before feedback and after feedback.
Regarding mathematics self-assessment for secondary education participants (), in the No Self-Assessment profile the external feedback improved the self-assessment process of just one participant that moved up to the Superficial Self-Assessment profile. In the Superficial Self-Assessment profile, 13 participants remained in the same category after receiving the feedback, while seven moved to the lowest category and two moved to a higher category. In the Intermediate Self-Assessment profile, while 13 participants stayed at the same level, 11 worsened. Finally, in the Advanced Self-Assessment profile only one participant stayed at the same level, with 12 moving to a lower category, four of them to the lowest profile. In general, it can be concluded that self-assessment got worse after receiving the feedback.
Table 7. Cross table of mathematics self-assessment profiles for secondary education participants before feedback and after feedback.
Regarding self-assessment for higher education participants (), the interpretation is more complex as there were three conditions. Regarding the No Self-Assessment profile, in the rubric condition there was no participants at this profile at any time; in the instructor’s feedback condition there were no changes after feedback; while in the combined condition the only participant moved up to the Intermediate Self-Assessment profile after receiving the rubric and the instructor’s feedback. Regarding the Superficial Self-Assessment profile, the rubric feedback had a positive effect increasing the profile of four participants; the instructor’s feedback had a mixed effect with three participants improving and two worsening; and the combined effect had mostly a positive effect with four participants improving. In the Intermediate Self-Assessment profile, the rubric did not affect most participants that stayed at the same profile (seventeen participants), with six worsening and two improving; the instructor’s feedback either did not have an effect (eight participants) or had negative effects (twelve participants); and the combined effect had mixed results with fifteen participants staying at the same profile, six worsening and one improving. Lastly, in the Advanced Self-Assessment profile, the participants receiving a rubric went down one profile; the participants receiving instructor’s feedback mostly went down; and the participans in the combined condition also went down. In general, as found with the secondary education students, feedback in whatever form was more beneficial for the self-assessment processes of the less advanced self-assessors. Nevertheless, we want to emphasise that these results come with a crucial caveat: the appearance of feedback was not counterbalanced, in other words, all participants self-assessed first without feedback and then self-assessed a second time with feedback. Therefore, our results need to be interpreted under that light.
Table 8. Cross table of writing self-assessment profiles for higher education participants before feedback and after feedback.
Discussion
Our aim was to identify self-assessment processes and profiles to propose a model of ideal self-feedback. While there is previous research aimed to open the ‘black box of self-assessment’ (Panadero et al., Citation2012, Citation2020, Citation2023a, Citation2023b; Pinedo et al., Citation2023; Yan & Brown, Citation2017), the present attempt is innovative as we have analysed the process holistically identifying profiles categorising the main processes. This allows us to clearly identify types of self-assessment, while exploring their differences based on educational level and external feedback. As achieved by the just mentioned research, here we were also able to identify and disentangle different elements in the self-assessment process. This is important because it shows that this type of research is feasible, even if costly in resources, and can provide insights. Next, we discuss our five research questions (RQ).
RQ1 and RQ2. What self-assessment profiles do secondary and higher education students use?
We identified four self-assessment profiles labelled as No Self-Assessment (NSA), Superficial Self-Assessment (SSA), Intermediate Self-Assessment (ISA) and Advance Self-Assessment (ASA). As reported throughout the manuscript, they have distinct features ranging from least to most advanced. Importantly, we have identified how the process of generating self-feedback can follow different pathways even within the profiles, as shown by the alternative patterns within the flowcharts. In that sense, self-feedback is here conceptualized and represented as a multi-component and recursive process in which students transition between different processes. This resemblances what we know from self-regulated learning models (e.g. Butler & Winne, Citation1995) as self-feedback being a complex activity of recursive nature.
Importantly, our study aligns and, more importantly, adds to the previous research exploring the black box of self-assessment. We next analyse our results based on Yan and Brown (Citation2017) who identified three main self-assessment actions: (1) determining the performance criteria, (2) self-directed feedback seeking and (3) self-reflection. Regarding the first action, we did not identify students trying to determinate the performance criteria but directly applying criteria (also described in Panadero et al., Citation2020, Citation2023a). Our result aligns with Sadler (Citation2005, Citation2007) and Yan and Carless (Citation2021) theoretical proposition on the importance of applying the criteria. It seems like, when self-assessing, students start performing it without an explicit planification of the corresponding assessment criteria.
As per the second action from Yan and Brown (Citation2017), self-directed feedback, we have found traces of it in the recall and compare processes as means to analyse and search for key aspects that would offer feedback to the students. Importantly, our research context might have influenced the use of strategies as this was a ‘laboratory’ setting and not a naturalistic one. Maybe in a real classroom the students might have searched for external feedback right away asking peers, the teacher, looking for external resources, etc. In our particular context, they generated their own feedback in the first self-assessment occasion.
Finally, the third action according to Yan and Brown (Citation2017) is self-reflection that we believe is reflexed in the actions of estimate and assess as identified in our data. When our participants estimate and assess they were generating a judgement about their performance, therefore self-reflecting about their work and how to evaluate it.
Importantly, there is one process identified in our data, that has no direct parallel in Yan and Brown (Citation2017): redo. Interestingly, in the revision of Yan and Brown’s (Citation2017) model performed by Yan and Carless (Citation2021), they included ‘revise work’ as a crucial action perform by students when they self-assess. However, it is important to remember, Yan and Carless is a theoretical revision, therefore they did not produce empirical results. Our empirical data shows that only the most advanced participants redo their work, being this the highest level of self-feedback generation.Footnote1 In that sense, Yan and Carless’ model seems more ideal than realistic, because the vast majority of our participants analysed their performance and judged their work but did not revise, and the ones that did, a large proportion only thought of improvements but did not implemented, though this could be due to the laboratory setting sitution. Finally, our profiles go beyond Yan and Brown’s in two ways: by identifying more specific and realistic processes and by being anchored in the collection and analysis of real self-assessment (remember that they used interview data).
RQ3. Do our quantitative calculations support the validity of the qualitative profiles?
To explore the quantitative validity of our qualitative profiles we performed three actions: (1) we calculated cross tables for each of the six self-assessments ocassions with all but one showing appropriate Kappa values; (2) we performed four discriminant analyses all showing appropriate explained variance levels with just one function, all significantly discriminating among profiles; and (3) we run a one-way ANOVA to explore if the profiles were able to distinguished among different academic performance levels, which they did for Superficial Self-Assessment against the two highest categories. In light of these comprehensive quantitative analyses, it is reasonable to suggest that our qualitative profiles are supported by quantitative evidence, keeping in mind the sample size and limitations of this study. This convergence of qualitative insights and quantitative validation provides a compelling case for the applicability and relevance of our self-assessment profiles in educational research and practice.
RQ4. What are the similarities and differences between the self-assessment profiles of secondary and higher education students?
In synthesising the results of RQ4, a compelling conclusion emerges: students in secondary and higher education exhibit more similarities than differences in their self-assessment profiles. This observation is underpinned by the six primary processes (e.g., read, recall) that remain consistent across these educational levels, as evidenced by the identification of four analogous self-assessment profiles (e.g., No Self-Assessment, Superficial Self-Assessment). What is particularly intriguing about our results is the pervasive nature of these similarities, transcending variations in task types and the maturity levels of participants. We also reached similar conclusions in the previous studies (Panadero et al., Citation2020, Citation2023a) with the same data when we compared the three year levels in each of the two educational levels: there are quite similar with subtle differences.
Notably, our research ventures into uncharted territory, due to the absence of prior studies directly comparing self-assessment practices across different educational levels. This gap in the literature precludes a direct comparison of our findings with existing research, highlighting an area ripe for future investigation.
RQ5. How does external feedback affect students’ use of self-assessment profiles?
There are two main conclusions from our data. First, in our previous studies (Panadero et al., Citation2020, Citation2023a) we found that once the external feedback has been delivered, that information takes over the self-feedback generation process. We had already proposed then that the delivery of feedback could be more beneficial if arrives after the students have had a chance to generate their own feedback (e.g. Panadero et al., Citation2023b). And our data here, for most of the participants, continues the same line of reasoning. However, again, please keep in mind that we did not counterbalanced the delivery of feedback, in other words, all participants first self-assessed without feedback and then with feedback.
Second, our results showed that external feedback helped more the less advanced students according to the profiles analysed here. It seems like only the less advanced self-assessors benefit from such feedback, a positive finding if we consider Dunning and Kruger effect (Dunning et al., Citation2004). However, we could be facing a chicken-and-egg dilemma here: are the less advanced self-assessors that way because of their lack of skills, or because they are waiting for external feedback to confirm that they lack the skills?
Furthermore, our findings must be contextualised within the framework of feedback types and their motivational implications, as delineated by Butler (Citation1987). Butler’s seminal work on the task-involving and ego-involving properties of evaluation offers crucial insights into how different feedback conditions can shape students’ motivational orientations and, consequently, their self-assessment processes. In our study, the predominantly performance-based feedback (e.g. achievement level), inclusive of grades, is particularly relevant. According to Butler, such feedback can engender an ego-involved motivational state, where students’ focus might shift towards normative performance and comparative success (see also Boekaerts & Corno, Citation2005). This orientation could potentially overshadow the more intrinsically motivated, task-involved processes that are central to effective self-assessment. Our observation that less advanced self-assessors showed more responsiveness to external feedback aligns with this perspective. It suggests that these students, possibly due to their developmental stage in self-assessment skills, might be more susceptible to the ego-involved influences of performance-based feedback. This reliance on external validation, in the form of grades or performance metrics, could inadvertently reinforce a comparative mindset, thus impeding the development of more self-regulated, task-focused assessment skills. Butler’s research underscores the need for a careful consideration of feedback types in educational settings, especially in how they interact with and influence the evolving self-assessment capabilities of learners at different proficiency levels.
An empirically driven model of self-feedback: when self-assessment turns into a successful event
Based in our findings, we propose next a model on how an ideal self-assessment process might look like: the SElf-FEedback MOdel (SEFEMO) (). Importantly, this model is based in the observation of well above 500 self-assessment performances with and without feedback, in different content knowledge areas (Spanish, mathematics, and writing), and with students from two different educational levels and six different year levels. Yet, the same six processes and four profiles were identified among those 500 plus self-assessments. It is important to remind that these observations were conducted in a ‘laboratory’ setting and need to be validated in real classroom settings.
Figure 12. Ideal self-assessment performance: SElf-FEedback MOdel (SEFEMO).
The first phase of the self-feedback process should consist on processing information. This could be the information in front of them at that moment (e.g. if they are given back their essays), or recall the information from when they performed the task or any other relevant event (e.g. the explanation given by the teacher). Importantly, this information processing might also involve the planning of the self-assessment. For example, if the students are given a rubric, this would be an ideal moment to read or re-read, if it was given to them earlier, the rubric. The main idea in this information processing phase is to activate all the available information to prepare for the self-assessment.
The second phase should consist of analysing their work in contrast with different elements (e.g., a rubric, an exemplar, a piece work from a peer) for the processes of assess and compare (see our explanation of those categories earlier on). These different elements can be more ”objective” such as a rubric, an exemplar, a piece of work from a peer; or based on less certained elements such as a basic intuition. Because of this, students will self-assess more accurately, especially if they are not experts, if they used concise criteria and comply with external indicators of quality.
Based on ‘assess’ and ‘compare’, or as a parallel process, students should redo the task. We have found this to be crucial among our participants. Importantly, ‘redo’ is not just about correcting simple mistakes but is a highly advanced strategy, probably the highest in complex tasks. We even consider it a supercharged version of ‘assess and compare,’ where the student uses the highest cognitive abilities to reenact the task. This process is powerful because it represents the most effective form of self-feedback: creating a new performance while simultaneously comparing and assessing the previous one. Students can activate two types of redo: Level 1 which is a general attempt at redoing the task without clear steps; and Level 2 a concrete, active redo process that runs parallel to the actual performance. Moreover, the success of redo is not measured by whether the student makes a final correction. A student might redo a task and determine that the original work was correct. The key is the engagement in the redo process itself, as it fosters deeper understanding and self-assessment.
In the last step, the students should be able to elicit a reasoned judgement about the quality of their work. This involves synthesizing the insights gained from the previous steps—information processing, assessment, comparison, and the redo process—to form a comprehensive evaluation. They should consider various factors such as the alignment of their work with the given criteria, the improvements made during the redo phase, and any feedback received. This step is crucial as it encapsulates their critical thinking and reflective abilities, allowing them to make informed decisions about their performance. Additionally, this reasoned judgment should guide their future learning strategies and identify areas for further improvement. By doing so, students not only enhance their current work but also develop a deeper understanding and mastery of the skills involved.
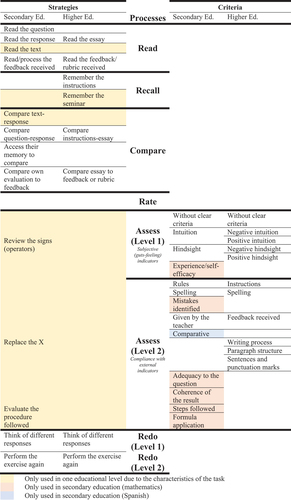
Crucially, all these processes are led by more specific strategies and criteria, ones that we have identified in these same 500 plus self-assessments, integrated in , and reported in detailed in three previous papers (Panadero et al., Citation2020, Citation2023a, Citation2023b). Finally, as it happens with self-regulated learning models, this proposal is based in a conscious and strategic deployment of all these processes which means that students can performed these processes even without being aware of them. Also, as with any model, the process is not clear-cut and it can get fuzzy in terms of when each process happens and what strategies and criteria are use when. This is just a representation based on our data from a convenient sample that, we believe, could be faithful to an expert execution of self-assessment. But let’s not forget than even among our profiles Superficial Self-Assessment and Intermediate Self-Assessment, and Intermediate Self-Assessment and Advanced Self-Assessment there was an overlap showing that self-assessment is a complex endeavour.
Figure 13. Integration of self-assessment processes, strategies, and criteria
If we compare our model with the one proposed by Yan and Brown (Citation2017), our model offers more details about the self-feedback process and there are elements from their model not present in ours as they were not found in our data (i.e. requirement to self-assessment, determining criteria, do I know enough to assess myself). This can be caused by the different nature of the studies data.
Limitations
First, our data is coming from two different studies. While the methods of data collection procedure were the same, the performed tasks and the research design were different. In terms of the tasks, it is logical that the content should be different because we are comparing students from K7 to third year of university programme. However, we also had different skills and content areas, as the secondary education sample self-assessed also in mathematics which was not done in higher education. Additionally, while there were some similarities in the research design (e.g. all participants first self-assess without any instructional help and then self-assessed again with feedback), the designs were definitely different (descriptive vs. RCT). Therefore, our results should be taken with caution.
Second, there is likely to be an effect of our research design that limits the generalisability of our conclusions about the effects of feedback in the self-assessment processes, as the presentation of feedback was not counterbalanced. All participants self-assessed first without feedback and then self-assessed a second time with feedback. Obviously, it could be the case that if feedback had been given within the first self-assessment occasion, the results might have been different (e.g. profiles might have gone up instead of down). We have thoroughly discussed this in our previous publications (Panadero et al., Citation2020, Citation2023a, Citation2023b).
Third, in the terms of the content of the feedback this was oriented to task content and not on the self-assessment itself (e.g. accuracy, strategies used). Self-feedback literature emphasises the importance of receiving feedback about the self-assessment processes in themselves.
Fourth, our data were collected in a ‘laboratory’ context, where students engaged in academic tasks outside their regular classrooms. This laboratory setting enabled us to control extraneous variables, yet it also constrains the extent to which our findings can be generalised to actual classroom environments.
Conclusion
The field is searching for answers to the question: how do students generate self-feedback? This study sheds light on two crucial aspects. First, it identifies what happens in terms of self-assessment processes: six main actions that can be categorised in four distinct profiles. Second, students from different educational levels show very similar self-feedback generation and external feedback is mostly beneficial for the low level self-assessors. Additionally, we have integrated our results on self-assessment processes with our previous finding on specific self-assessment strategies and criteria (). While we are still in the initial steps of this key line of research, this type of research based on the students’ real actions, could offer the most insights on how students generate self-feedback. From our results, it is clear what are the main differences between the most and the less advanced self-assessors, knowing now that there are three actions (estimate, assess and, especially, redo) that the weaker self-assessors are not implementing. This could be the start of interventions to improve self-feedback generation in our students and, with that intention, we also propose an ideal model of self-assessment (SEFEMO). Hopefully our methods and conclusions will offer some needed light into such a crucial educational topic.
Supplemental Material
Download PDF (395.1 KB)Disclosure statement
No potential conflict of interest was reported by the author(s).
Supplementary material
Supplemental data for this article can be accessed online at https://doi.org/10.1080/0969594X.2024.2367027.
Additional information
Funding
Notes on contributors
Ernesto Panadero
Ernesto Panadero is the Director at the Centre for Assessment Research, Policy and Practice in Education (CARPE) at Dublin City University. He is also Honorary Professor at the Centre for Research in Assessment and Digital Learning (CRADLE), Deakin University (Australia). His research focuses on self-regulated learning and educational assessment, especially self & peer assessment, teachers’ feedback and the use of rubrics. He is the PI of the Education, Regulated Learning & Assessment (ERLA) research group since its creation in 2016. He received the Erik de Corte 2017, an award given by the EARLI to a promising early career European researcher in the field of Learning and Instruction.
Javier Fernández
Javier Fernández is an Assistant Professor at the department of Developmental and Educational Psychology, of Autonomous University of Madrid. He holds a PhD in Psychology by the same university (2022). Currently, he is involved in several research projects as a postdoc researcher at ERLA Research Group. His primary research interests are in formative assessment, self- and peer assessment, and teacher’s conceptions about teaching and assessment.
Leire Pinedo
Leire Pinedo works as PhD candidate in the Education, Regulated Learning & Assessment (ERLA) research group at University of Deusto (Bilbao, Spain). Her research interests involve educational assessment, especially self-assessment, feedback and the use of rubrics. In her PhD thesis, funded by the Spanish Ministry of Universities (FPU 2018 call), Leire explores the effect of individual differences and feedback on the self-assessment process.
Iván Sánchez
Iván Sánchez is a lecturer at the Department of Psychobiology and Methodology of Behavioral Sciences at the Universidad Complutense de Madrid, Spain. His current research focuses on applying statistical methods, data analysis techniques, and psychometrics to address problems within the field of psychology.
Daniel García-Pérez
Daniel García-Pérez is assistant professor at the Faculty of Education-CFP, Universidad Complutense de Madrid. He teaches courses related to educational and developmental psychology. His research focuses on teaching and learning processes in higher education and student participation.
Notes
1. Importantly, there were two types of redo: level 1, which is a general attempt at redoing the work without clear steps (e.g., thinking about possible ways to improve the work in specific aspects), and level 2 which involves a strategic redo process simulating the performance of the task at hands.
References
- Andrade, H. (2010). Students as the definitive source of formative assessment: Academic self-assessment and the self-regulation of learning. In H. L. Andrade & G. J. Cizek (Eds.), Handbook of formative assessment (pp. 90–105). Routledge.
- Andrade, H. (2018). Feedback in the context of self-assessment. In A. A. Lipnevich & J. K. Smith (Eds.), The Cambridge handbook of instructional feedback (pp. 376–408). Cambridge University Press.
- Boekaerts, M., & Corno L. (2005). Self-Regulation in the Classroom: A Perspective on Assessment and Intervention. Applied Psychology, 54(2), 199–231. https://doi.org/10.1111/j.1464-0597.2005.00205.x
- Boud, D., & Falchikov, N. (1989). Quantitative studies of student self-assessment in higher-education: A critical analysis of findings. Higher Education, 18(5), 529–549. https://doi.org/10.1007/BF00138746
- Brown, G. T. L., & Harris, L. R. (2014). The future of self-assessment in classroom practice: Reframing self-assessment as a core competency. Frontline Learning Research, 3(2014), 22–30. https://doi.org/10.14786/flr.v2i1.24
- Butler, R. (1987). Task-involving and ego-involving properties of evaluation: Effects of different feedback conditions on motivational perceptions, interest, and performance. Journal of Educational Psychology, 79(4), 474. https://doi.org/10.1037/0022-0663.79.4.474
- Butler, D. L., & Winne, P. H. (1995). Feedback and self-regulated learning: A theoretical synthesis. Review of Educational Research, 65(3), 245–281. https://doi.org/10.3102/00346543065003245
- Dochy, F., Segers, M., & Sluijsmans, D. (1999). The use of self-, peer and co-assessment in higher education: A review. Studies in Higher Education, 24(3), 331–350. https://doi.org/10.1080/03075079912331379935
- Dunning, D., Heath, C., & Suls, J. M. (2004). Flawed self-assessment: Implications for health, education, and the workplace. Psychological Science in the Public Interest, 5(3), 69–106. https://doi.org/10.1111/j.1529-1006.2004.00018.x
- Eva, K. W., & Regehr, G. (2005). Self-assessment in the health professions: A reformulation and research agenda. Academic Medicine, 80(10), S46–S54. https://doi.org/10.1097/00001888-200510001-00015
- Eva, K. W., & Regehr, G. (2008). “I’ll never play professional football” and other fallacies of self‐assessment. Journal of Continuing Education in the Health Professions, 28(1), 14–19. https://doi.org/10.1002/chp.150
- Kostons, D., van Gog, T., & Paas, F. (2009). How do I do? Investigating effects of expertise and performance‐process records on self‐assessment. Applied Cognitive Psychology: The Official Journal of the Society for Applied Research in Memory & Cognition, 23(9), 1256–1265. https://doi.org/10.1002/acp.1528
- Kostons, D., van Gog, T., & Paas, F. (2012). Training self-assessment and task-selection skills: A cognitive approach to improving self-regulated learning. Learning and Instruction, 22(2), 121–132. https://doi.org/10.1016/j.learninstruc.2011.08.004
- Lipnevich, A., & Panadero, E. (2021). A review of feedback models and theories: Descriptions, definitions, and conclusions. Frontiers in Education, 6, 720195. https://doi.org/10.3389/feduc.2021.720195
- Narciss, S., & Zumbach, J. (2022). Formative Assessment and Feedback Strategies. In J. Zumbach, D. Bernstein, S. Narciss, & G. Marsico (Eds.), International Handbook of Psychology Learning and Teaching. Springer International Handbooks of Education. Springer. https://doi.org/10.1007/978-3-030-26248-8_63-1.
- Nicol, D. (2021). The power of internal feedback: Exploiting natural comparison processes. Assessment & Evaluation in Higher Education, 46(5), 756–778. https://doi.org/10.1080/02602938.2020.1823314
- Panadero, E., Brown, G. T. L., & Strijbos, J. W. (2016). The future of student self-assessment: A review of known unknowns and potential directions. Educational Psychology Review, 28(4), 803–830. https://doi.org/10.1007/s10648-015-9350-2
- Panadero, E., Fernández-Ruiz, J., & Sánchez-Iglesias, I. (2020). Secondary education students’ self-assessment: The effects of feedback, subject matter, year level, and gender. Assessment in Education Principles, Policy & Practice, 27(6), 607–634. https://doi.org/10.1080/0969594X.2020.1835823
- Panadero, E., García-Pérez, D., Fernández Ruiz, J., Fraile, J., Sánchez-Iglesias, I., & Brown, G. T. L. (2023a). Feedback and year level effects on university students’ self-efficacy and emotions during self-assessment: Positive impact of rubrics vs. instructor feedback. Educational Psychology, 43(7), 756–779. https://doi.org/10.1080/01443410.2023.2254015
- Panadero, E., García-Pérez, D., Fernández Ruiz, J., Fraile, J., Sánchez-Iglesias, I., & Brown, G. T. L. (2023b). University students’ strategies and criteria during self-assessment: Instructor’s feedback, rubrics, and year level effects. European Journal of Psychology of Education, 38(3), 1031–1051. https://doi.org/10.1007/s10212-022-00639-4
- Panadero, E., Lipnevich, A., & Broadbent, J. (2019). Turning self-assessment into self-feedback. In D. Boud, M. D. Henderson, R. Ajjawi, & E. Molloy (Eds.), The impact of feedback in higher education: Improving assessment outcomes for learners (pp. 147–163). Springer.
- Panadero E., Tapia J. A., & Huertas J. A. (2012). Rubrics and self-assessment scripts effects on self-regulation, learning and self-efficacy in secondary education. Learning and Individual Differences, 22(6), 806–813. https://doi.org/10.1016/j.lindif.2012.04.007
- Pinedo, L., Panadero, E., Fernández-Ruiz, J., & Rodríguez-Hernández, C. (2023). Students’ experiences in self-assessment: Training, processes and feedback use in secondary and higher education. Assessment in Education Principles, Policy & Practice, 30(5–6), 448–480. https://doi.org/10.1080/0969594X.2023.2284630
- Rolheiser, C. (1996). Self-evaluation… Helping kids get better at it: A teacher’s resource book. Ontario Institute for Studies in Education.
- Sadler, D. R. (2005). Interpretations of criteria‐based assessment and grading in higher education. Assessment & Evaluation in Higher Education, 30(2), 175–194. https://doi.org/10.1080/0260293042000264262
- Sadler, D. R. (2007). Perils in the meticulous specification of goals and assessment criteria. Assessment in Education Principles, Policy & Practice, 14(3), 387–392. https://doi.org/10.1080/09695940701592097
- Sanchez, C. E., Atkinson, K. M., Koenka, A. C., Moshontz, H., & Cooper, H. (2017). Self-grading and peer-grading for formative and summative assessments in 3rd through 12th grade classrooms: A meta-analysis. Journal of Educational Psychology, 109(8), 1049. https://doi.org/10.1037/edu0000190
- Sitzmann, T., Ely, K., Brown, K. G., & Bauer, K. N. (2010). Self-assessment of knowledge: A cognitive learning or affective measure? Academy of Management Learning & Education, 9(2), 169–191. https://doi.org/10.5465/amle.9.2.zqr169
- Winne, P. H., & Perry, N. E. (2000). Measuring self-regulated learning. In M. Boekaerts, P. R. Pintrich, & M. Zeidner (Eds.), Handbook of self-regulation (pp. 531–566). Academic Press.
- Yan, Z., & Brown, G. T. (2017). A cyclical self-assessment process: Towards a model of how students engage in self-assessment. Assessment & Evaluation in Higher Education, 42(8), 1247–1262. https://doi.org/10.1080/02602938.2016.1260091
- Yan, Z., Brown, G. T., Lee, J. C. K., & Qiu, X. L. (2020). Student self-assessment: Why do they do it? Educational Psychology, 40(4), 509–532. https://doi.org/10.1080/01443410.2019.1672038
- Yan, Z., & Carless, D. (2021). Self-assessment is about more than self: The enabling role of feedback literacy. Assessment & Evaluation in Higher Education, 47(7), 1116–1128. https://doi.org/10.1080/02602938.2021.2001431