
ABSTRACT
Classroom observation rubrics are a widely adopted tool for measuring the quality of teaching and provide stable conceptualisations of teaching quality that facilitate empirical research. Here, we present four statistical approaches for analysing data from classroom observations: Factor analysis, Rasch modelling, latent class or profile analysis, and formative measurement models. Each statistical model conceptualises the latent variable differently, which may or may not align with the observation rubric’s conceptualisation of teaching quality. We discuss the differences across these models, focusing on the alignment between the rubric’s conceptualisation of teaching quality and the model’s modelling of the latent variable. We discuss the need to align model selection with observation rubric so that the measured teaching quality reflects the theoretically conceptualised teaching quality.
The direct measurement of teaching quality through observation rubrics (Bell et al., Citation2019) has become an important tool in research (e.g. Dobbelaer, Citation2019) and practice (e.g. Jones & Bergin, Citation2019). Observation rubrics provide a specific conceptualisation of teaching quality. This conceptualisation is typically operationalised through denoting a small number of domains that are thought to be the active ingredients for supporting student learning along with a few items that are nested within those domains. This paper considers this domain-item structure, a feature that is common to many measurement tools and nearly universal in observational rubrics. We argue that the way that an observation rubric operationalises a domain of teaching quality across a set of items implies a specific conceptualisation of that domain that has important implications for the appropriateness of different statistical models (Yarkoni, Citation2020).
Four different statistical models are widely used to model the domain structure in observation rubrics: (1) factor analysis (e.g. Allen et al., Citation2013; Hafen et al., Citation2014; Hamre et al., Citation2013); (2) Rasch modelling (e.g. Jones & Bergin, Citation2019; van de Grift et al., Citation2019; van der Lans et al., Citation2018); (3) latent class analysis (LCA; e.g. Halpin & Kieffer, Citation2015; Salminen et al., Citation2012); (4) formative measurement modelsFootnote1 (e.g. Garrett & Steinberg, Citation2015; Hill et al., Citation2012; Kane et al., Citation2011; White et al., Citation2022). Each of these models represents a latent variable(s), which are meant to represent the underlying construct (i.e. domain(s) of teaching quality), based on different assumptions about how the latent variable is associated with scored items.
The alignment of the chosen model to the conceptualisation and operationalisation of teaching quality is rarely discussed. We argue that this is problematic because the four classes of models imply different and contradictory assumptions about how rubric items would be designed to assess the teaching quality construct. For example, factor analysis defines the latent variable by the shared covariance across items (i.e. what items have in common; Raykov & Marcoulides, Citation2011), whereas formative measurement models define the latent variable by the total variation in item scores (Jarvis et al., Citation2003). A rubric designed such that each item fully captures the underlying construct implies that the underlying construct is shared across items, as in factor models. A rubric designed such that each item captures unique aspects of the underlying construct implies that the total variation in items defines the underlying construct, as in formative model. Choosing a model is not just a statistical choice but deeply connected to the conceptualisation of a domain, as operationalised by the rubric.
This paper provides an in-depth discussion of the implicit assumptions that each model makes about the relationship between observed items and the latent variable. We argue that the conceptualisation of the domain construct, as it is embedded in the design of the rubric, has vital implications for which statistical model is appropriate, highlighting the need to align the conceptualisation to the choice of statistical model (Hoelscher, Citation2017). In making this argument, we highlight that model fit to data is not a sufficient condition for trusting the results of statistical modelling, but that aligning modelling assumptions, rubric design, and constructs’ conceptualisations are vital for scientific progress. Based on this discussion, we will propose guidelines for choosing between the different models.
Measuring and modelling domains of teaching quality
This paper focuses on how observation rubrics conceptualise, measure, and model teaching quality domains. An observation rubric is the central measurement tool in an observation system, a term which developed to indicate that the entire system of data collection (e.g. rubric, rater training and monitoring, sampling plans) contributes to the quality of the scores that result from applying a rubric to score instruction (Bell et al., Citation2019; Hill et al., Citation2012). We focus here on observation rubrics because rubrics operationalise the item-domain structure measured by observation systems (Bell et al., Citation2019). Terminology about observation rubrics is inconsistent (Charalambous et al., Citation2021). We use the word item to refer to the rubric-level at which raters assign scores. We use the word domain to refer to theoretical groupings of items that represent underlying constructs, which are called either factors, classes, or abilities across the four classes of models we examine. Further, we use the word latent variable to indicate the statistical parameter that is meant to represent the underlying construct in models (VanderWeele, Citation2022).
The rubric items and their corresponding domains together create a conceptual framework that describes teaching quality. For example, one well-developed framework is the Teaching through Interactions framework (TtI; Hamre et al., Citation2013). TtI posits that items are reflections of three underlying domains of teaching quality: Emotional Support, Classroom Organisation, and Instructional Support. For consistency and where appropriate, throughout this article we use the Instructional Support domain of the TtI framework to concretise discussions of the models. For the Rasch model, the TtI framework does not fit well, so we draw on other examples. Note that the TtI framework is one of the more common frameworks. Since many observation rubrics include the item-domain structure, the issues discussed in this paper should be applicable far beyond the TtI framework.
In statistical analyses, the TtI domain structure is usually represented through three correlated latent factors that affect student outcomes (i.e. a reflective model; e.g. Hamre et al., Citation2013). However, we have seen papers on this framework using latent class analysis (e.g. Camacho et al., Citation2022; Penttinen et al., Citation2022; Virtanen et al., Citation2019) and formative approaches (e.g. White, Citation2017). Other frameworks on teaching quality harness a Rasch model (e.g. van de Grift et al., Citation2014). There seems to be no consensus about which of these models might be the most adequate one to represent teaching quality, whether multiple of these models might be adequate, and for which reasons.
Accurately modelling the domain structures is of high relevance because the domain construct is typically conceptualised as a deeper structure intervening between item scores and causal processes supporting student learning (e.g. Hamre et al., Citation2013). Statistical models that are aligned to the conceptualised domain structure in the rubric, then, are an important validity concern (Markus & Borsboom, Citation2013). This is obviously true for efforts to validate the theoretical conceptualisation embodied by the rubric. It is also true for broader efforts to use domain scores (e.g. for teacher evaluation), since many uses of observation scores focus on domain constructs.
As shown in , the observation rubric is a specific operationalisation of the conceptualised domains of teaching quality. Through operationalising a specific understanding of a domain (including the design of items measuring the domain), the rubric also has important implications for which statistical models are appropriate. The chosen statistical model processes the data (i.e. item scores), extracting an estimate of a latent variable (i.e. the signal) that is meant to represent the domain construct while disregarding a portion of the data as noise or construct-irrelevant variation, which we refer to as error. The latent variable is then interpreted in the light of the conceptualised domain of teaching quality that the latent variable is meant to represent and eventually put to some use.
Figure 1. The role of modelling in the interpretation and use of observation scores.
For example, the TtI framework is operationalised by the Classroom Assessment Scoring System rubric (CLASS; Hamre et al., Citation2013). The latent variables estimated through modelling CLASS data will be interpreted as representing the domains of the TtI framework. The correctness of this interpretation depends on the alignment between parameters of the statistical model when applied to the data and the conceptualisation of the TtI domains, as operationalised by CLASS (McGrane & Maul, Citation2020). In turn, many (but maybe not all) uses of observation scores will rely on the interpretation that scores capture the intended domain constructs. Then, like McGrane and Maul (Citation2020), we argue for the importance of alignment between statistical models, data models (i.e. the results of applying statistical models to data), and conceptual models (or conceptualisations of teaching quality). The implicit realism embedded in much scientific work (Yarkoni, Citation2020) makes it too easy to automatically equate modelled latent variables with the underlying constructs those variables are meant to represent (Markus & Borsboom, Citation2013; VanderWeele, Citation2022). This equating requires careful consideration of the alignment between the conceptualisation of domains of teaching quality, as operationalised by the rubric, and statistical modelling assumptions. Since an infinite number of statistical models can fit any given data set equally well, model fit is an insufficient metric for supporting the inference of alignment between statistical parameters and conceptual constructs (Edelsbrunner, Citation2022).
Classifying the different models
Before discussing each model in depth, we orient readers by classifying the models along two facets (see ): the relationship between domains and items, and the nature of the construct representing the domain. Reflective models, including factor analysis, the Rasch model, and latent class analysis, assume that the domain is best captured through the shared covariation between observed items. Formative models assume that all variations in the items form the domain (Jarvis et al., Citation2003). Importantly, formative models are a specific class of statistical models, referring to a measurement that is formed or induced by the items (Edwards & Bagozzi, Citation2000) and should not be confused with formative uses of observation scores (such as formative assessment). Any model could, in principle, be used as a formative assessment tool. Second, the different models assume that the domain constructs are either categorical or continuous.
Table 1. Classification of models discussed in this paper.
Factor analysis
Introduction to the factor model
Factor analysis is the default modelling approach, often adopted without comment or justification (Fried, Citation2020; Rhemtulla et al., Citation2020; Taut & Rakoczy, Citation2016). We emphasise confirmatory factor models here. The factor model provides a parsimonious explanation for the covariance of observed items, which implies a testable set of predictions for the structure of observed data (Kline, Citation2023b). Factor analysis has developed a wide range of tools that examine the fit of empirical data to different model assumptions (e.g. measurement invariance testing, comparisons of different possible factor structures; McDonald, Citation1985). This toolkit is very helpful for analysts using factor analysis with observation rubrics, leading to a wide range of papers examining factor structures (e.g. Hafen et al., Citation2014; Hamre et al., Citation2013, Citation2014) and measurement equivalence across settings (e.g. Downer et al., Citation2012; Hu et al., Citation2016).
Factor analysis assumes that an unobserved, reflective latent variable (i.e. factor) explains the shared covariation between observed items (McDonald, Citation1985). The term reflective means that the construct of teaching quality is defined as capturing only the shared covariation of its items. All variance not shared among the items is assumed to be measurement error (i.e. not part of the central construct of interest; Kim & Mueller, Citation1978). Note that this directly implies that, in the absence of measurement error, all items will correlate perfectly. In other words, factor models define ‘measurement error’ as all sources of variation that lead items to not perfectly correlate. In addition, it is usually assumed that a given value of the latent variable causally determines the observed item scores, although it should be noted that causality is an interpretation of statistical parameters and not part of a parameterisation (Bagozzi, Citation2007).
shows a graphical description of a unidimensional factor analysis model in the context of the Teaching through Interactions framework. In this model, three observed items are assessed based on the Instructional Support domain from the CLASS (Hamre et al., Citation2013). The three observed items (i.e. Content Understanding [CU], Analysis and Problem Solving [APS], and Quality of Feedback [QF]) are each determined by (i.e. have arrows pointing to them from) the domain of Instructional Support and an item-specific error term. Only the Instructional Support domain affects student outcomes (i.e. only the factor affects outcomes), highlighting the importance of the domain to the understanding of teaching quality.
Figure 2. A basic unidimensional factor model for the CLASS domain of instructional support represented in a classic representation and a Venn diagram.
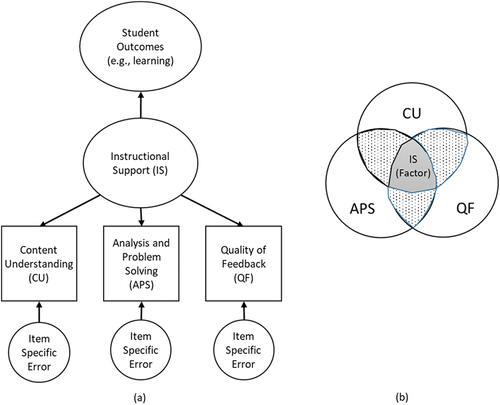
shows a Venn diagram of the same factor model (Lewis-Beck et al., Citation2004). The Venn diagram representation displays the variability of each item. Areas where the circles overlap show areas of covariation. Greater overlap means greater covariation. shows that the Instructional Support factor is defined as the area where all the items overlap (i.e. covary), highlighting the assumption of local independence (Kim & Mueller, Citation1978). The dotted regions represent model misfit and should be small in well-fitting factor models. The areas where the items do not overlap are the item-specific error terms.
Defining the domain construct as the shared variation in item scores has important implications for rubric design. First, each rubric item must completely capture the conceptual complexity of the domain (K. Bollen & Lennox, Citation1991; Gruijters et al., Citation2021). By conceptual complexity, we mean any and all sources of variability in the latent variable. This is shown in the Venn diagram; the domain is defined within the variability of each item. If a new item is added that does not fully capture the domain, the area where all items overlap shrinks, leading to construct underrepresentation. This characteristic holds even when different items receive different factor loadings on a domain. The amount of information (i.e. variation) that goes from the domain into the item may differ between items, as visible in varying loadings. However, the source of the variation is strictly the same for all the items. Secondly, the items are interchangeable (K. Bollen & Lennox, Citation1991; Gruijters et al., Citation2021; Peterson et al., Citation2017). Again, examine the Venn diagram. Every well-fitting item shares the variability of the domain and has a unique error term. Whereas in most situations, at least three items are necessary to fit factor models to data (Little, Citation2013), statistically, any two or more items identify, and thus define, the domain. Here, identifying a domain means that, as soon as a factor model has been fit to data (and therefore, parameter estimates such as factor loadings are known), any two of the indicators used in the fitting process would suffice to define the same latent variable (Kline, Citation2023b, Citation2023a). The only difference that arises from using different indicator variables in a factor model with known parameters is that items with higher factor loadings contribute more information about the exact position of the individuals on the common latent variable (i.e. they are more reliable – but not more valid). This principle is used, for example, in the practice of modelling partial measurement invariance: As long as two or more items share the parameters across groups, they can be brought onto the same latent scale across the respective groups (Jarvis et al., Citation2003; Uher 2021; Reise et al., Citation1993; for a thorough introduction into this topic see Edwards & Bagozzi, Citation2000).
Put differently, the items in factor analysis are interchangeable (Kline, Citation2023a; Rhemtulla et al., Citation2020). This characteristic even remains when a multidimensional data structure is present. For example, assessments of mathematics commonly cover items from different domains such as algebra, calculus, and arithmetic. Although the underlying structure is in principle multidimensional, a unidimensional factor model could be fit to data with the aim of representing a common mathematics-factor (Baird et al., 2017). Since the items covering the different areas would share less common variance than those from within the same topic, the common latent factor of all the items would capture less variance of each individual item (see Edelsbrunner & Dablander, Citation2019, for an example of this in the area of scientific reasoning). Still, if a unidimensional model is fit to the data, and we estimate the model parameters, then we could use any subset of the items (i.e. items from a single domain) and fixing their parameters to the previously estimated values would ensure that we are always representing the same latent factor.
This interchangeability leads to flexibility in the use of factor models, including the ability to remove misfitting items (e.g. Virtanen et al., Citation2018) and to conduct analyses across multiple observation rubrics (e.g. Blazar et al., Citation2017) without needing to redefine the underlying domain construct.
Alignment of a conceptualization of a domain of teaching quality and the factor model
Given these model assumptions and their implications, we might ask how to determine if a given conceptualisation of a domain of teaching quality (as operationalised by a rubric) can be appropriately modelled with a factor model? A first option is to ask whether, conceptually, the same domain would be measured using a single item (Jarvis et al., Citation2003). Taking CLASS as an example (as in ), if one believes that removing CU and APS would narrow the Instructional Support construct, then CU or APS would seem to contain unique information about the Instructional Support construct not contained in QF (i.e. the Instructional Support factor expands outside of the QF circle on the Venn diagram). If different indicator variables are meant to cover different aspects of the construct of Instructional Support, then this intention goes against the assumption of interchangeability in factor analysis (Ellis & Junker, Citation1997; Kline, Citation2023a, Citation2023b; Stadler et al., Citation2021). This would suggest that the factor model is misaligned with one’s conceptualisation of the Instructional Support construct, making factor analysis a less appropriate modelling choice.
A second option for determining whether factor model assumptions align with one’s conceptualisation of a domain of teaching quality is to consider interventions to improve teaching quality (i.e. consider how the focal construct changes; K. A. Bollen & Diamantopoulos, Citation2017). Under the factor model, interventions must target the underlying domain construct directly to impact student outcomes (see the direction of arrows in ). The standard factor model does not include a causal pathway from individual items to student outcomes. Then, an intervention narrowly targeting teachers’ feedback practice (i.e. a causal effect impacting the QF item) would not be expected to improve student outcomes under the factor model. Rather, the intervention must directly target teachers’ Instructional Support to improve student outcomes. Researchers seeking to determine if the factor model is aligned to their conceptualisation of a teaching quality domain construct could imagine narrowly tailored interventions focused on each item and consider whether such interventions, if feasible, would be expected to improve student outcomes. If so, the factor model is not aligned with one’s conceptualisation.
When we look towards the literature to see how researchers determine the appropriateness of the factor model for modelling a domain of teaching quality, the most common criteria used seems to be whether the factor model fits the data (Raykov & Marcoulides, Citation2011). This practice conflates statistical and conceptual models (McGrane & Maul, Citation2020). Model fit is, at best, a necessary, but not sufficient condition for the appropriateness of the factor model, as there are an unlimited number of models that will provide a good fit to any given data set (Edelsbrunner, Citation2022; Fried, Citation2020; Hershberger, Citation1994, Raykov & Marcoulides, Citation2011; Yarkoni, Citation2020). Scientific, theoretical inference is necessary to interpret data (Hubbard et al., Citation2019).
The rasch model
Introduction to the rasch model
The Rasch model is sometimes seen as part of Item-Response Theory (IRT) models, which can be described as non-linear factor analysis models (McDonald, Citation2013). The unique characteristic of Rasch and further IRT models is that they assume a non-linear relationship between the latent variable and the items, whereas factor analysis assumes a linear relationship. This makes IRT models useful for applications with categorical item scores. Whereas many IRT models will yield comparable results and information as factor analysis (Raykov & Marcoulides, Citation2016), Rasch models make stronger assumptions about the nature of the underlying construct representing the domain and the features of the observed items (see Andrich, Citation2004; Edelsbrunner & Dablander, Citation2019), so we focus this section on Rasch models. Namely, the Rasch model assumes that the rubric items are equivalent, except for being different in difficulty (i.e. having mean differences). Statistically, this implies that (expected) observed scores on easier items must increase (of note, probabilistically, so exceptions to this can occur) before observed scores on harder items increase (Andrich, Citation2004; Edelsbrunner & Dablander, Citation2019).
Alignment of a conceptualization of a domain of teaching quality and the rasch model
Determining whether a given conceptualisation of a domain of teaching quality aligns with Rasch model assumptions follows in much the same way as the factor model. Both models are reflective measurement models with continuous latent variables, so the same approaches suggested above would all provide guidance for whether the Rasch model is appropriate. The Rasch model, though, makes several other assumptions that might better fit specific conceptualisations of a domain of teaching quality. Namely, the Rasch model assumes a specific ordering of item difficulties. This is achieved through omitting the item parameters of factor loadings. In contrast to factor analysis, in the Rasch model all items are modelled to reflect the latent construct to the same degree (i.e. all items have the same loadings). This characteristic has the implication that item difficulties have the same order across the latent continuum, such as varying degrees of teaching quality (Engelhard, Citation2013). In factor analysis, items as well have varying difficulty parameters, but these do not impose a strict order across the latent continuum because the difficulty order interacts with the factor loadings (Engelhard, Citation2013).
The assumption of ordered item difficulties is in accordance with some researchers conceptualising teaching quality as consisting of a nested set of skills, such that teachers must master easier skills before progressing to more difficult skills (e.g. van de Grift et al., Citation2019; van der Lans et al., Citation2018). For example, simpler skills might be recognising the general needs of the class, whereas more complex skills would be identifying specific students’ needs at a particular time. This view of teaching quality aligns well with Rasch model assumptions.
There are conceptual and empirical challenges to common interpretations of Rasch models when modelling a domain of teaching quality. Namely, in contrast to common testing situations, teachers may not necessarily be trying to score as high as possible on each rubric item in each observation (White & Klette, Citation2023). For example, one rubric item might capture the amount or quality of student talk, but teachers may have designed a lesson to provide students with time to work individually on problems, such that the lesson does not capture the difficulty of facilitating student talk. In such cases where teachers are not trying to score as highly as possible on a rubric, it becomes conceptually challenging to think of items as having difficulties, as an item’s average score is highly dependent on the frequency with which the item is expected to be taught (White & Klette, Citation2023; see also distinction between maximal and typical performance in Fiske & Butler, Citation1963). This is particularly problematic for Rasch models because it conflates item difficulty (an item characteristic) with teacher intentions to teach in a specific way (a teaching characteristic), undermining the assumptions of the Rasch model.Footnote2 Although such challenges might lead to divergent patterns that surface as a bad model fit, fit is not always in focus in the Rasch model and is often seen as a problem of the data, rather than a problem of the model (Edelsbrunner & Dablander, Citation2019). This highlights again the fact that a good model fit is generally not a sufficient condition for believing that a given statistical model provides useful information (Fried, Citation2020; Yarkoni, Citation2020).
Latent class and profile analysis (LCA)
Introduction to the latent class model
Latent class analysis (LCA) can be described as item response theory with a categorical latent variable (Masyn, Citation2013; Vermunt & Magidson, Citation2004). Like factor analysis and IRT/Rasch modelling, the key assumption is the independence of the observed items conditional on the latent variable (i.e. the latent class; Collins & Lanza, Citation2009). Here, we treat latent class analysis synonymously with latent profile analysis, which is the typical label of this model for cases with continuous indicator variables (Hickendorff et al., Citation2018). LCA assumes that each observation belongs to a single latent class and typically models variability in observed item scores as independent after conditioning on this latent class (i.e. the domain). LCA’s modelling of discrete latent classes leads to a very different conceptualisation of teaching quality domains than in the factor model (which assumes continuous latent variables), despite the common assumption of conditional independence.
Papers using LCA with observation rubrics tend to make strong claims about LCA’s benefits. For example, LCA is said to offer ‘diagnostic information about teachers’ instructional strengths and weaknesses (Halpin & Kieffer, Citation2015, p. 1). Across a range of LCA studies, the argument is that person-centred approaches like LCA provide a characterisation of teaching quality that better represents the complexity of the construct of teaching quality (e.g. Berlin & Cohen, Citation2020; Halpin & Kieffer, Citation2015; Holmes & Schumacker, Citation2020; Salminen et al., Citation2012; Virtanen et al., Citation2019; Yang & Hu, Citation2019). This claim is supported by LCA model estimates of each item’s average score within each latent class, which highlights the relative strengths and weaknesses across items in each class. Such estimates of item mean across latent classes come through the assumption that cases within each class are perfectly equivalent, except for measurement error. The LCA results are often contrasted with straw-man unidimensional (factor) models that represent teachers’ scores as a single number. These claims about person-centred versus variable-centred approaches are controversial (c.f., Masyn, Citation2013).
Mathematically, both LCA and factor analysis make similar assumptions about what counts as signal and what counts as noise. The two approaches imply identical predictions of the indicator variables’ means, variances, and covariances when the number of latent classes is one more than the number of latent factors (Molenaar & von Eye, Citation1994). Then, they capture similar patterns in the observed data, but simply parameterise these patterns very differently. This makes it difficult to empirically distinguish whether factor analysis or LCA fits better (De Boeck et al., Citation2011), making the distinction between these models less important when the goal is to fit patterns in empirical data. That said, the different parameterisations in the two models provide different information.
For example, imagine that a teacher population of interest (e.g. teacher candidates) is best described by the teaching quality patterns depicted in , which shows three latent classes with means that are all low, all medium, or all high. This is called linear or parallel patterns (Hickendorff et al., Citation2018) and the main distinction between classes is their average score. The same pattern could easily be captured by a single-dimensional factor model, though the factor model provides no intrinsic way to capture the division of cases into classes. More complex patterns of latent class means often involve non-linear or overlapping means across items (see ). In this case, items, such as Content Understanding and Quality of Feedback, which show similar patterns across latent classes (i.e. low scores in class 1 and higher scores in classes 2 and 3) will tend to load on the same factor, whereas items showing different patterns will load on different factors (Hickendorff et al., Citation2018).
Figure 3. Hypothetical teacher classes with linear mean patterns across items.
Figure 4. Hypothetical teacher classes with overlapping mean patterns across items.
Whereas LCA provides a useful model-based approach to grouping cases, many other approaches also exist to create groups of cases. LCA mainly provides an advantage over other approaches (e.g. clustering factor scores; cluster analysis, median splits) if the assumptions of the LCA model are met (i.e. the domains of teaching quality are conceptualised as categorical constructs; class membership explains all true covariation in observed scores). Furthermore, most applications of LCA are exploratory, so results should not be taken to imply that the obtained classes exist (i.e. implicit realism; Yarkoni, Citation2020), especially if observation rubrics were not designed to detect classes of cases. Replication using confirmatory LCA models in new data sets should be conducted before treating classes as real groups of cases (Finch & Bronk, Citation2011; Schmiege et al., Citation2018). Exploratory applications of LCA should be treated as exploratory findings that can bring up hypotheses for future research, but that require further scrutiny before drawing conclusions. Whenever researchers try to achieve confirmatory aims such as hypothesis testing with latent class analysis, preregistered confirmatory LCA should be used (Schmiege et al., Citation2018).
Alignment of a conceptualization of a domain of teaching quality and the latent class model
Determining whether a given conceptualisation of a domain of teaching quality is aligned with the latent class model revolves around the nature of the hypothesised domain construct. If a domain is conceptualised as being composed of qualitatively distinct forms of instruction and the rubric is built to distinguish between categorically distinct types of instruction (e.g. by measuring the presence of certain features that characterise types of instruction), the latent class model may be useful.
As with the factor and Rasch models, considering how the domain construct changes could also be useful. A domain conceptualised as a continuous construct would imply that teaching quality can gradually and incrementally change across time, for example, as teachers develop skills and refine their capacities. A domain conceptualised as a categorical construct implies that categorically distinct types of teaching quality exist, and change occurs through qualitative shifts between categorically distinct types of teaching. This is the difference between a lesson increasing in teaching quality if the teacher learns to better maintain the rigour of assignments, ask different types of questions, and engage in other incremental improvements versus a lesson increasing in teaching quality only if it is redesigned from scratch. Latent class model assumptions are consistent with the categorical conceptualisation.
To summarise, although factor analysis and latent class/profile analysis split signal and noise in a very similar manner, they represent the signal in different kinds of model parameters. Whether one or the other kind of parameters is more useful has to be decided first and foremost based on conceptualisations of teaching quality that underlie an observation rubric.
Formative measurement models
Introduction to formative measurement models
Formative measurement models represent a different understanding of the domain construct, as compared to reflective models (K. A. Bollen & Diamantopoulos, Citation2017). We focus solely on causal formative models (K. A. Bollen & Diamantopoulos, Citation2017). shows a graphical representation of a formative measurement model for the Instructional Support domain of CLASS. In the formative model, the arrows point from the items to the domain, showing that the items in a formative measurement model determine the domain (i.e. the opposite of the factor model). The Venn diagrams in show the difference between the factor and formative models most clearly. In formative models, the Instructional Support domain is composed of (or formed by) the three items (i.e. the construct is larger than any individual item, and items explain unique facets of the domain). Additionally, there are no item-specific error-terms, but a single error term for the domain. This domain-level error is represented in the Venn diagram by the white space surrounding the three items and within the domain.
Figure 5. Formative measurement model for instructional support using a path model representation (left) and a Venn diagram (right).
Alignment of a conceptualization of a domain of teaching quality and the formative model
Determining whether a given conceptualisation of a domain of teaching quality aligns with the formative measurement model assumptions revolves around the relationship between individual items and the domain construct. To understand the formative model, consider the thought experiment that one wishes to build a rubric to measure Instructional Support (IS). One formatively conceptualised approach to building such a rubric would be to first identify every possible way to support IS. This involves breaking down IS into discrete, observable lesson features. For example, following CLASS, one might identify the quality of feedback as a discrete way to support IS. Providing opportunities for students to engage in Analysis and Problem Solving could be another discrete approach to support IS. After identifying all the ways to support IS (or a reasonably large subset of ways), the next task would be to develop rubric categories to precisely and narrowly measure each unique item as carefully as possible. This is the basic approach under a formative measurement model: sub-divide the broad domain into concrete items, measuring each as carefully as possible. Whereas an effort must be made to capture the intended domain as fully as possible, the domain-level error term can compensate somewhat if all aspects of instructional support are not fully operationalised.
Contrasting formative and reflective models
Given the dominance of reflective models, it helps to directly contrast how formative and reflective models view the relationship between items and the domain construct. The rubric design process under a reflective conceptualisation of teaching differs from that just described. Under a reflective conceptualisation, the first step would be to conceptualise the aspects that define IS, ensuring that each item captures each defining aspect. The items can, however, differ in aspects that are not related to the defining aspects of IS, which would cover the non-overlapping shares of the variances depicted in . Put differently, each measured item would have to fully contain the variability associated with the IS construct. Items would then be created that capture the full complexity of IS and possibly capture unique features of instruction unrelated to IS. This implies that observable evidence central to the IS domain must be captured by each item. To see why this is implied, consider the Venn diagram in again. The factor model defines the instructional support domain as the variability shared by all items. Then, any observable evidence that does not simultaneously affect all items is defined as item-specific error by reflective models (unless such evidence was always paired with equivalent evidence captured by the other items).
This highlights the difference between the formative and reflective models in terms of rubric design. The formative model assumes items narrowly capture sub-facets of the broader construct, such that the construct is broader than any individual item. The reflective model assumes that each item captures the full construct, such that the construct is narrower than any single item (i.e. the unique features of items are removed to estimate the latent variable). In doing so, the reflective model construct represents a whole class of items, any of which can be sampled to be used in measurement.
These two models have different implications for the selection of different items for measuring teaching quality, and how these items are expected to behave relative to each other. The first difference between the two models is their flexibility (K. A. Bollen & Diamantopoulos, Citation2017). Items cannot be simply removed or added to formative measurement models (Gruijters et al., Citation2021) since each item makes a unique contribution. The reflective model is more flexible, as no item uniquely contributes to the domain, but each item fully captures the whole domain. This is why one would speak of sampling items in a reflective model and selecting items under a formative model (K. Bollen & Lennox, Citation1991). The second difference relates to the functioning of individual items across models (K. Bollen & Lennox, Citation1991; Stadler et al., Citation2021). Since the formative model carefully measures several uniquely important items, there is no expectation that the items should be highly correlated (though high correlations are not bad for formative models, they decrease efficiency; c.f., Stadler et al., Citation2021). Since the reflective model effectively tries to measure the domain with error repeatedly across several items, the items should be highly correlated. Thus, internal consistency is not implied in formative models (Jarvis et al., Citation2003). This means that commonly used approaches under reflective models, such as Cronbach’s alpha and standard reliability measures, are conceptually and practically problematic under formative measurement models (Gruijters et al., Citation2021; Taber, Citation2018). Then, the use of formative measurement models requires rethinking how the quality of a scale is determined (K. Bollen & Lennox, Citation1991; Stadler et al., Citation2021).
Controversies in formative measurement models and possible solutions
Formative measurement models are controversial (K. A. Bollen & Diamantopoulos, Citation2017; Howell et al., Citation2013; Rhemtulla et al., Citation2020) for several reasons: Firstly, formative measurement models are under-identified. They make no assumptions about what observed data looks like, so all data fit a formative measurement model (Jarvis et al., Citation2003). One must model two outcomes of the formative construct or pre-specify loadings to have an identified model (Jarvis et al., Citation2003). One could alternatively emphasise theoretical justifications for formative models. This makes it difficult to evaluate the empirical quality of a formative model.
Secondly, the interpretation of the meaning of formative latent variables is debated. Some researchers claim that formative constructs cannot be consistently interpreted (i.e. they have inherent interpretational confounding), whereas others claim that this is not a problem (c.f. Bollen & Diamantopoulos & Citation2017; Howell et al., Citation2013). This disagreement focuses on whether the loadings of the items on the domains can be empirically determined. Theoretically specifying the loadings (e.g. having equal loadings for each item) side-steps this disagreement, although potentially leads to less empirically efficient analyses.
Thirdly, there are concerns that formative measurement models do not control for measurement error in the observed items (Howell et al., Citation2013; Rhemtulla et al., Citation2020). When considering the challenge of measurement error, it is important to specify what type of error is of concern (e.g. rater error, construct-irrelevant variance in items). Formative measurement models can generally be expanded to control for different error types, once the error of concern is explicated (e.g. Schuberth, Citation2021b). As noted above, reflective models define measurement error as all variations in item scores that lead items to be less than perfectly correlated. The usefulness of reflective models controlling for measurement error depends on the appropriateness of this definition of measurement error. Simulations suggest that errors arising from adopting the wrong model can lead to more severe biases than formative models’ failure to address measurement error (K. A. Bollen & Diamantopoulos, Citation2017; MacKenzie et al., Citation2005; Rhemtulla et al., Citation2020).
Applying the statistical models to measure domains of teaching quality
This section provides examples of applying each of the discussed statistical models to a domain of teaching quality. A fundamental argument of this paper is that the model must be aligned to the conceptualisation of teaching quality. A consequence of this is that various aspects of teaching quality will be better suited to specific models. In this section, we provide examples of how various aspects of teaching quality might align with each of the discussed models. We show how each model can usefully contribute to measuring teaching quality and highlight the need to carefully consider the alignment of the model and the conceptualised domain construct, as operationalised by the rubric.
Consider the measurement of classroom climate. Classroom climate is often conceptualised as an underlying construct that cannot be directly observed, but which causes individuals to engage in specific behaviours (i.e. the construct determines the observed indicators; e.g. Hamre et al., Citation2013). Further, climate is understood as a continuous variable that can be higher or lower in different settings. Then, the climate construct may be properly conceptualised as a reflective construct, and factor models should provide a good measurement approach, assuming that a set of items can be identified such that climate is the only shared source of variability in item scores and that each item fully captures the influence of the climate.
Consider the measurement of a specific teaching skill, such as leading a discussion. This skill could be broken down into a set of sub-skills (e.g. how to choose a topic, how to ask open-ended questions, how to take up student ideas, and how to have students respond to each other’s ideas), some of which are easy and some of which are difficult, but all of which are necessary to properly lead a discussion. If the sub-skills could be ordered such that easier skills must be mastered before harder skills, then Rasch models would provide a useful measurement approach.
Consider the measurement challenge to distinguish between two qualitatively different forms of instruction (e.g. discovery-learning and traditional approaches). One could go about this by laying out the unique characteristics of each type of instruction and measuring those characteristics. Then, discovery-learning lessons should score high on all discovery-learning items and low on all traditional approach items (and vice-versa). That is, there would be within-type homogeneity in the observed items. In this scenario, LCA provides a powerful approach to try to distinguish between the two types of instruction (Masyn, Citation2013) so long as one defines all instructions within each class as equivalent (apart from measurement error). Note that changes in teaching quality in this scenario would imply that a teacher shifts from a traditional approach to a discovery-learning approach (or vice-versa; i.e. a qualitative shift in the instruction provided).
Consider the measurement of instructional scaffolding. Teachers can choose between many different ways of scaffolding (e.g. asking questions, providing hints, explicitly teaching procedures) and none of these individual behaviours captures the full range of the scaffolding construct. Further, in terms of student learning, the extent to which students are supported in accessing the content likely matters far more than which type of scaffolding is used. Scaffolding, then, seems like a formative construct, appropriate for a formative measurement model. This requires measuring each approach to scaffolding separately and formatively combining them in an instructional scaffolding domain that captures the extent to which students were supported in accessing content. Teachers would develop their scaffolding skill through improving on the individual skills that form the broader scaffolding construct.
These four brief examples above are not meant to be a rule book. Our point is that the construct of teaching quality is complex and, despite the differences across the models, there are research questions and cases where each of the models could be useful. The goal should be to carefully consider the nature of the teaching quality construct being measured and the nature of the measurement tools in order to align model assumptions and theoretical assumptions.
Future outlook and limitations
This paper has explicitly focused on the challenges that come with building item/domain structures to measure domains of teaching quality. This is only one of the challenges faced by observational measures of teaching quality. For example, we do not address the issues of statistical estimation (Sarstedt et al., Citation2016), within-classroom variability in teaching quality (Schweig & Martínez, Citation2021), or hierarchical data. Further, we only touched on the possibilities of combining models. For example, mixture models are a generalisation of LCA that combines both categorical and continuous latent variables into the same model (Lubke & Neale, Citation2006). This section points out further challenges related to the modelling of item/domain structures, though space limitations prevent us from giving these points a full consideration.
Firstly, observation scores are often assigned multiple times across a lesson at equally spaced intervals (e.g. OECD, Citation2020). This creates a challenge of identifying the level at which to model teaching quality. If the equal-interval segmentation strategy is understood as a useful way to reduce rater error and improve measurement of lesson-average teaching quality (White et al., Citation2022), then one might model lesson-average teaching quality at the lesson level. Similarly, studies often make conclusions at the teacher and/or classroom level, but scores are assigned to lessons or segments. Empirically, these concerns create the need to use multi-level models (c.f. Stapleton et al., Citation2016). Conceptually, this creates the need to consider the level at which domain constructs are defined: Is a domain of teaching quality a characteristic of classrooms or a characteristic of individual lessons (or instructional interactions within lessons; c.f. White et al., Citation2022)?
Secondly, we have ignored issues of rater error. Rater error is usually considered a source of random error in measurement. However, rater error will generally be correlated across different items (c.f. McCaffrey et al., Citation2014). This biases estimates of correlations across observed items. Since all measurement models involve examining the relationship of observed item scores, rater error can very easily bias conclusions from these models (McCaffrey et al., Citation2014). Rater error needs to be considered when engaging in the modelling exercises discussed here.
One way to account for rater error (or other forms of error) is to build models that combine reflective and formative measurement approaches (Howell et al., Citation2013; Jarvis et al., Citation2003; Wilson & Gochyyev, Citation2020). For example, each item is modelled as a reflective construct that is measured by multiple raters to account for rater error (see ). In , reflectively measured items then formatively compose the Instructional Support domain. This is a so-called TYPE II model (Jarvis et al., Citation2003), which combines the advantages of formative and reflective models. The Venn diagram in shows how the shares of the variance between the raters on the items form the variance of the formative construct. To the best of our knowledge, these models have not been adopted in research on teaching quality, but they have been successfully used in other fields, such as marketing (Johnson et al., Citation2006; Lin et al., Citation2005; Ruiz et al., Citation2008).
Figure 6. Reflective-formative measurement model for instructional support.
Other ways of combining formative and reflective models, such as MIMIC approaches and composite-based structural equation modelling, also exist (c.f. Jarvis et al., Citation2003; Rademaker, Citation2020; Schuberth, Citation2021a). As researchers work to account for the additional complexities mentioned in this section, more complex models, including combinations of those discussed here, may become necessary. Throughout the model selection process, though, one must attend to aligning assumptions of models to one’s conceptualisation of teaching quality, as operationalised in the observation rubric.Footnote3
Conclusion
captures the main argument of this paper. Statistical models determine what signal is extracted from raw data. Different models will lead to different signals. There is a need to align modelling assumptions to conceptual understandings of teaching quality, as operationalised by the rubric because those conceptualisations will drive interpretations of latent variables estimated by models. Without alignment, interpretations of latent variables may become problematic. The four models that we have discussed define the latent variable representing the domain construct based on very different assumptions about the relationship between rubric item scores and domain scores. This means that the choice of model matters, both conceptually (e.g. White et al., Citation2022) and empirically (e.g. Rhemtulla et al., Citation2020).
In our reading of the field, the focus is solely on model fit. Well-fitting models are assumed to be useful with no explicit consideration of the alignment between conceptualisations of teaching quality and the assumptions implicit in the statistical model or rubric design. We argue that fit to a dataset is in many cases a necessary, but never a sufficient condition for adopting a given model. More important is the alignment between conceptual understandings of teaching quality and model assumptions, as we have tried to lay out here. One cannot, then, simply rely on statistics, but theory-driven inference is necessary to interpret data (Hubbard et al., Citation2019).
Disclosure statement
No potential conflict of interest was reported by the author(s).
Additional information
Funding
Notes on contributors
Mark White
Dr. Mark White is a postdoctoral researcher at the Quality in Nordic Teaching center at the University of Oslo. His background blends education, psychology, and sociology. His research interests center on understanding and measuring interventions designed to improve teaching quality, both in terms of teacher change and systems change. His research focuses on quantitative observational measures of teaching quality.
Peter A. Edelsbrunner
Peter A. Edelsbrunner is a postdoctoral researchers at the Chair for Research on Learning and Instruction at ETH Zurich, Switzerland. He studied Psychology in Graz and Padova and did his doctoral thesis at ETH Zurich on domain-general and domain-specific scientific thinking in childhood. His substantial research investigates scientific thinking and epistemic cognition. “How to multiple facets of scientific thinking co-develop?” and “How can we foster epistemic cognition through targeted interventions?” are central questions in his work. His methodological research examines mixture modeling methods such as latent transition analysis that can provide insights into heterogeneity in learning and development. He is also interested in methods for modeling the differential effects of educational interventions, and in the psychometrics of knowledge. Peter also provides further education for teachers from various levels and workshops for researchers devoted to advanced methodological topics.
Christian M. Thurn
Dr. Christian M. Thurn is a postdoctoral researcher at the Chair for Research on Learning and Instruction at ETH Zürich, Switzerland. He studied Psychology in Konstanz and Padova. In his doctoral thesis at ETH Zürich, he investigated the interplay of prior knowledge, learning opportunities, and intelligence in conceptual physics learning. His research aims to better understand the mental processes of conceptual learning. “How do prior knowledge and intelligence interact?”, and “How can we model conceptual learning?” are central questions in his work. To address these questions he utilizes classroom studies, concept tests, reaction-time experiments, and concept mapping. These methods allow the investigation of conceptual learning from different perspectives, such as network modeling. In addition, he is interested in (mis-)conceptions of frequentist statistics, and gender issues in STEM subjects.
Notes
1. Note that these authors do not identify their models as formative, but the discussions and analyses in the papers suggest this is the underlying assumption.
2. This is known as the distinction between dominance models and ideal-point models (Chernyshenko et al., Citation2001; Harvey, Citation2016; Meijer & Tendeiro, Citation2018). Rasch models are based on the dominance model. Chernyshenko et al. (Citation2001) and Meijer and Tendeiro (Citation2018) argue that ideal-point models are better suited especially for attitude scales and personality assessment. Only theoretical considerations about teaching quality can answer, whether the domains fall rather in the dominance model or the ideal-point model.
3. Note that apart from theoretical reasons, also practical reasons can be employed for using models. The Rasch model can be used to obtain an interval measure with equal weighting of indicator variables (Edelsbrunner & Dablander; McGrane & Maul, Citation2020). In this use case, it can be debated whether the Rasch model functions as a reflective model, or as a formative model, or as a tool in between (Peterson et al., Citation2017; Simonetto, Citation2012).
References
- Allen, J. P., Gregory, A., Mikami, A., Lun, J., Hamre, B. K., & Pianta, R. C. (2013). Observations of effective teacher-student interactions in secondary school classrooms: predicting student achievement with the classroom assessment scoring system–secondary. School Psychology Review, 42(1), 76–97. https://doi.org/10.1080/02796015.2013.12087492
- Andrich, D. (2004). Controversy and the rasch model: A characteristic of incompatible paradigms? Medical Care, 42(1), 7. https://doi.org/10.1097/01.mlr.0000103528.48582.7c
- Bagozzi, R. P. (2007). On the meaning of formative measurement and how it differs from reflective measurement: Comment on Howell, Breivik, and Wilcox. Psychological Methods, 12(2), 229–337. https://doi.org/10.1037/1082-989X.12.2.229
- Bell, C. A., Dobbelaer, M. J., Klette, K., & Visscher, A. (2019). Qualities of classroom observation systems. School Effectiveness and School Improvement, 30(1), 1–27. https://doi.org/10.1080/09243453.2018.1539014
- Berlin, R., & Cohen, J. (2020). The convergence of emotionally supportive learning environments and college and career ready mathematical engagement in upper elementary classrooms. American Educational Research Association Open, 6(3), 6(3. https://doi.org/10.1177/2332858420957612
- Blazar, D., Braslow, D., Charalambous, C. Y., & Hill, H. C. (2017). Attending to general and mathematics-specific dimensions of teaching: exploring factors across two observation instruments. Educational Assessment, 22(2), 71–94. https://doi.org/10.1080/10627197.2017.1309274
- Bollen, K. A., & Diamantopoulos, A. (2017). In defense of causal-formative indicators: A minority report. Psychological Methods, 22(3), 581–596. https://doi.org/10.1037/met0000056
- Bollen, K., & Lennox, R. (1991). Conventional wisdom on measurement: A structural equation perspective. Psychological Bulletin, 110(2), 305–314. https://doi.org/10.1037/0033-2909.110.2.305
- Camacho, D. A., Moore, S. A., Pas, E. T., & Bradshaw, C. P. (2022). Interactional quality in middle schools: Latent profiles and their associations with teacher, classroom, and school compositional factors. Journal of School Psychology, 93, 79–97. https://doi.org/10.1016/j.jsp.2022.06.001
- Charalambous, C. Y., Praetorius, A.-K., Sammons, P., Walkowiak, T., Jentsch, A., & Kyriakides, L. (2021). Working more collaboratively to better understand teaching and its quality: Challenges faced and possible solutions. Studies in Educational Evaluation, 71, 101092. https://doi.org/10.1016/j.stueduc.2021.101092
- Chernyshenko, O. S., Stark, S., Chan, K. Y., Drasgow, F., & Williams, B. (2001). Fitting item response theory models to two personality inventories: Issues and insights. Multivariate Behavioral Research, 36(4), 523–562. https://doi.org/10.1207/S15327906MBR3604_03
- Collins, L. M., & Lanza, S. T. (2009). Latent class and latent transition analysis: With applications in the social, behavioral, and health sciences (Vol. 718). John Wiley & Sons.
- De Boeck, P., Bakker, M., Zwitser, R., Nivard, M., Hofman, A., Tuerlinckx, F., & Partchev, I. (2011). The estimation of item response models with the lmer function from the lme4 package in R. Journal of Statistical Software, 39(12), 1–28. https://doi.org/10.18637/jss.v039.i12
- Dobbelaer, M. J. (2019). The quality and qualities of classroom observation systems. University of Twente. https://research.utwente.nl/en/publications/the-quality-and-qualities-of-classroom-observation-systems
- Downer, J. T., López, M. L., Grimm, K. J., Hamagami, A., Pianta, R. C., & Howes, C. (2012). Observations of teacher-child interactions in classrooms serving latinos and dual language learners: applicability of the classroom assessment scoring system in diverse settings. Early Childhood Research Quarterly, 27(1), 21–32. https://doi.org/10.1016/j.ecresq.2011.07.005
- Edelsbrunner, P. A. (2022). A model and its fit lie in the eye of the beholder: Long live the sum score. Frontiers in Psychology, 13, 986767. https://doi.org/10.3389/fpsyg.2022.986767
- Edelsbrunner, P. A., & Dablander, F. (2019). The psychometric modelling of scientific reasoning: A review and recommendations for future avenues. Educational Psychology Review, 31(1), 1–34. https://doi.org/10.1007/s10648-018-9455-5
- Edwards, J. R., & Bagozzi, R. P. (2000). On the nature and direction of relationships between constructs and measures. Psychological Methods, 5(2), 155. https://doi.org/10.1037/1082-989X.5.2.155
- Ellis, J. L., & Junker, B. W. (1997). Tail-measurability in monotone latent variable models. Psychometrika, 62(4), 495–523. https://doi.org/10.1007/BF02294640
- Engelhard, G., Jr. (2013). Invariant measurement: Using Rasch models in the social, behavioral, and health sciences. Routledge.
- Finch, W. H., & Bronk, K. C. (2011). Conducting confirmatory latent class analysis using M plus. Structural Equation Modelling, 18(1), 132–151. https://doi.org/10.1080/10705511.2011.532732
- Fiske, D. W., & Butler, J. M. (1963). The experimental conditions for measuring individual differences. Educational and Psychological Measurement, 23(2), 249–266. https://doi.org/10.1177/001316446302300203
- Fried, E. I. (2020). Lack of theory building and testing impedes progress in the factor and network literature. Psychological Inquiry, 31(4), 271–288. https://doi.org/10.1080/1047840X.2020.1853461
- Garrett, R., & Steinberg, M. P. (2015). Examining teacher effectiveness using classroom observation scores evidence from the randomization of teachers to students. Educational Evaluation and Policy Analysis, 37(2), 224–242. https://doi.org/10.3102/0162373714537551
- Gruijters, S. L. K., Fleuren, B. P. I., & Peters, G.-J. Y. (2021). Crossing the seven Cs of internal consistency: Assessing the reliability of formative instruments. [Preprint] PsyArXiv. https://doi.org/10.31234/osf.io/qar39
- Hafen, C. A., Hamre, B. K., Allen, J. P., Bell, C. A., Gitomer, D. H., & Pianta, R. C. (2014). Teaching through interactions in secondary school classrooms revisiting the factor structure and practical application of the classroom assessment scoring system–secondary. The Journal of Early Adolescence, 35(5–6), 651–680. https://doi.org/10.1177/0272431614537117
- Halpin, P. F., & Kieffer, M. J. (2015). Describing profiles of instructional practice a new approach to analyzing classroom observation data. Educational Researcher, 44(5), 263–277. https://doi.org/10.3102/0013189X15590804
- Hamre, B. K., Hatfield, B., Pianta, R. C., & Jamil, F. (2014). Evidence for general and domain-specific elements of teacher–child interactions: associations with preschool children’s development. Child Development, 85(3), 1257–1274. https://doi.org/10.1111/cdev.12184
- Hamre, B. K., Pianta, R. C., Downer, J. T., DeCoster, J., Mashburn, A., Jones, S. M., Brown, J. L., Cappella, E., Atkins, M., Rivers, S. E., Brackett, M., & Hamagami, A. (2013). Teaching through interactions: Testing a developmental framework of teacher effectiveness in over 4,000 classrooms. The Elementary School Journal, 113(4), 461–487. https://doi.org/10.1086/669616
- Harvey, R. J. (2016). Improving measurement via item response theory: Great idea, but hold the rasch. The Counseling Psychologist, 44(2), 195–204. https://doi.org/10.1177/0011000015615427
- Hershberger, S. L. (1994). The specification of equivalent models before the collection of data. In A. von Eye & C. C. Clogg (Eds.), Latent variables analysis: Applications for developmental research (pp. 68–105). Sage Publications, Inc.
- Hickendorff, M., Edelsbrunner, P. A., McMullen, J., Schneider, M., & Trezise, K. (2018). Informative tools for characterizing individual differences in learning: Latent class, latent profile, and latent transition analysis. Learning and Individual Differences, 66, 4–15. https://doi.org/10.1016/j.lindif.2017.11.001
- Hill, H. C., Charalambous, C. Y., & Kraft, M. A. (2012). When rater reliability is not enough teacher observation systems and a case for the generalizability study. Educational Researcher, 41(2), 56–64. https://doi.org/10.3102/0013189X12437203
- Hoelscher, M. (2017). “It’s the method, stupid.” interrelations between methodological and theoretical advances: The example of comparing higher education systems internationally. Research in Comparative and International Education, 12(3), 347–359. https://doi.org/10.1177/1745499917724287
- Holmes, L., & Schumacker, R. (2020). Latent class analysis of teacher characteristics: Can we identify effective teachers? Measurement: Interdisciplinary Research and Perspectives, 18(2), 75–86. https://doi.org/10.1080/15366367.2019.1657350
- Howell, R. D., Breivik, E., & Wilcox, J. B. (2013). Formative measurement: A critical perspective. ACM SIGMIS Database: The DATABASE for Advances in Information Systems, 44(4), 44–55. https://doi.org/10.1145/2544415.2544418
- Hubbard, R., Haig, B. D., & Parsa, R. A. (2019). The limited role of formal statistical inference in scientific inference. The American Statistician, 73(sup1), 91–98. https://doi.org/10.1080/00031305.2018.1464947
- Hu, B. Y., Fan, X., Gu, C., & Yang, N. (2016). Applicability of the classroom assessment scoring system in Chinese preschools based on psychometric evidence. Early Education and Development, 27(5), 714–734. https://doi.org/10.1080/10409289.2016.1113069
- Jarvis, C. B., MacKenzie, S. B., & Podsakoff, P. M. (2003). A critical review of construct indicators and measurement model misspecification in marketing and consumer research. Journal of Consumer Research, 30(2), 199–218. https://doi.org/10.1086/376806
- Johnson, G. J., Bruner, G. C., II, & Kumar, A. (2006). Interactivity and its facets revisited: Theory and empirical test. Journal of Advertising, 35(4), 35–52. https://doi.org/10.2753/JOA0091-3367350403
- Jones, E., & Bergin, C. (2019). Evaluating teacher effectiveness using classroom observations: A rasch analysis of the rater effects of principals. Educational Assessment, 24(2), 91–118. https://doi.org/10.1080/10627197.2018.1564272
- Kane, T. J., Taylor, E. S., Tyler, J. H., & Wooten, A. L. (2011). Evaluating teacher effectiveness. Education Next, 11(3), 54–61. https://www.educationnext.org/evaluating-teacher-effectiveness/
- Kim, J.-O., & Mueller, C. (1978). Introduction to factor analysis. SAGE Publications, Inc. https://doi.org/10.4135/9781412984652
- Kline, R. B. (2023a). Assumptions in structural equation modeling. In R. H. Hoyle (Ed.), Handbook of structural equation modeling (2nd ed., pp. 128–144). The Guilford Press.
- Kline, R. B. (2023b). Principles and practice of structural equation modeling. Guilford publications.
- Lewis-Beck, M., Bryman, A., & Futing Liao, T. (2004). Confirmatory factor analysis. In The SAGE encyclopedia of social science research methods. Sage Publications, Inc.
- Lin, C. H., Sher, P. J., & Shih, H. Y. (2005). Past progress and future directions in conceptualizing customer perceived value. International Journal of Service Industry Management, 16(4), 318–336. https://doi.org/10.1108/09564230510613988
- Little, T. D. (2013). Longitudinal structural equation modelling. The Guilford Press.
- Lubke, G., & Neale, M. C. (2006). Distinguishing between latent classes and continuous factors: Resolution by maximum likelihood? Multivariate Behavioral Research, 41(4), 499–532. https://doi.org/10.1207/s15327906mbr4104_4
- MacKenzie, S. B., Podsakoff, P. M., & Jarvis, C. B. (2005). The problem of measurement model misspecification in behavioral and organizational research and some recommended solutions. Journal of Applied Psychology, 90(4), 710–730. https://doi.org/10.1037/0021-9010.90.4.710
- Markus, K. A., & Borsboom, D. (2013). Frontiers of test validity theory: Measurement, causation, and meaning. Routledge.
- Masyn, K. E. (2013). Latent class analysis and finite mixture modelling. In T. D. Little (Ed.), The Oxford handbook of quantitative methods (pp. 551–611). Oxford University Press.
- McCaffrey, D. F., Yuan, K., Savitsky, T. D., Lockwood, J. R., & Edelen, M. O. (2014). Uncovering multivariate structure in classroom observations in the presence of rater errors. Educational Measurement Issues & Practice, 34(2), 34–46. https://doi.org/10.1111/emip.12061
- McDonald, R. P. (1985). Factor analysis and related methods. Lawrence Erlbaum Associates.
- McDonald, R. P. (2013). Test theory: A unified treatment. Psychology Press.
- McGrane, J. A., & Maul, A. (2020). The human sciences, models and metrological mythology. Measurement, 152, 107346. https://doi.org/10.1016/j.measurement.2019.107346
- Meijer, R. R., & Tendeiro, J. N. (2018). Unidimensional item response theory. In P. Irwing, T. Booth, & D. J. Hugh (Eds.), The Wiley handbook of psychometric testing: A multidisciplinary reference on survey, scale and test development (pp. 413–433). Wiley. https://doi.org/10.1002/9781118489772.ch15
- Molenaar, P. C. M., & von Eye, A. (1994). On the arbitrary nature of latent variables. In A. von Eye & C. C. Clogg (Eds.), Latent variables analysis: Applications for developmental research (pp. 226–242). Sage Publications, Inc.
- OECD. (2020). Global teaching insights: a video study of teaching. OECD Publishing. https://doi.org/10.1787/20d6f36b-en
- Penttinen, V., Pakarinen, E., von Suchodoletz, A., & Lerkkanen, M. K. (2022). The quality of teacher-child interactions and teachers’ occupational well-being in Finnish kindergartens: A person-centered approach. Early Education and Development, 34(7), 1–22. https://doi.org/10.1080/10409289.2022.2139549
- Peterson, C. H., Gischlar, K. L., & Peterson, N. A. (2017). Item construction using reflective, formative, or rasch measurement models: Implications for group work. The Journal for Specialists in Group Work, 42(1), 17–32. https://doi.org/10.1080/01933922.2016.1264523
- Rademaker, M. E. (2020). Composite-based structural equation modelling [ Doctoral dissertation]. Universität Würzburg.
- Raykov, T., & Marcoulides, G. A. (2011). Introduction to psychometric theory. Routledge. https://doi.org/10.4324/9780203841624
- Reise, S. P., Widaman, K. F., & Pugh, R. H. (1993). Confirmatory factor analysis and item response theory: Two approaches for exploring measurement invariance. Psychological Bulletin, 114(3), 552. https://doi.org/10.1037/0033-2909.114.3.552
- Rhemtulla, M., van Bork, R., & Borsboom, D. (2020). Worse than measurement error: Consequences of inappropriate latent variable measurement models. Psychological Methods, 25(1), 30–45. https://doi.org/10.1037/met0000220
- Ruiz, D. M., Gremler, D. D., Washburn, J. H., & Carrión, G. C. (2008). Service value revisited: Specifying a higher-order, formative measure. Journal of Business Research, 61(12), 1278–1291. https://doi.org/10.1016/j.jbusres.2008.01.015
- Salminen, J., Lerkkanen, M.-K., Poikkeus, A.-M., Pakarinen, E., Siekkinen, M., Hännikäinen, M., Poikonen, P.-L., & Rasku-Puttonen, H. (2012). Observed classroom quality profiles of kindergarten classrooms in Finland. Early Education and Development, 23(5), 654–677. https://doi.org/10.1080/10409289.2011.574267
- Sarstedt, M., Hair, J. F., Ringle, C. M., Thiele, K. O., & Gudergan, S. P. (2016). Estimation issues with PLS and CBSEM: Where the bias lies! Journal of Business Research, 69(10), 3998–4010. https://doi.org/10.1016/j.jbusres.2016.06.007
- Schmiege, S. J., Masyn, K. E., & Bryan, A. D. (2018). Confirmatory latent class analysis: Illustrations of empirically driven and theoretically driven model constraints. Organizational Research Methods, 21(4), 983–1001. https://doi.org/10.1177/1094428117747689
- Schuberth, F. (2021a). Confirmatory composite analysis using partial least squares: Setting the record straight. Review of Managerial Science, 15(5), 1311–1345. https://doi.org/10.1007/s11846-020-00405-0
- Schuberth, F. (2021b). The Henseler-Ogasawara specification of composites in structural equation modeling: A tutorial. Psychological Methods, (4), 843–859. https://doi.org/10.1037/met0000432
- Schweig, J. D., & Martínez, J. F. (2021). Understanding (Dis)agreement in student ratings of teaching and the quality of the learning environment. In W. Rollett, H. Bijlsma, & S. Röhl (Eds.), Student feedback on teaching in schools: using student perceptions for the development of teaching and teachers (pp. 91–110). Springer International Publishing. https://doi.org/10.1007/978-3-030-75150-0_6
- Simonetto, A. (2012). Formative and reflective models to determine latent construct [conference presentation]. 46th Scientific Meeting of the Italian Statistical Society, Rome, Italy.
- Stadler, M., Sailer, M., & Fischer, F. (2021). Knowledge as a formative construct: A good alpha is not always better. New Ideas in Psychology, 60, 100832. https://doi.org/10.1016/j.newideapsych.2020.100832
- Stapleton, L. M., Yang, J. S., & Hancock, G. R. (2016). Construct meaning in multilevel settings. Journal of Educational and Behavioral Statistics, 41(5), 481–520. https://doi.org/10.3102/1076998616646200
- Taber, K. S. (2018). The use of Cronbach’s alpha when developing and reporting research instruments in science education. Research in Science Education, 48(6), 1273–1296. https://doi.org/10.1007/s11165-016-9602-2
- Taut, S., & Rakoczy, K. (2016). Observing instructional quality in the context of school evaluation. Learning and Instruction, 46, 45–60. https://doi.org/10.1016/j.learninstruc.2016.08.003
- van de Grift, W. J. C. M., Helms-Lorenz, M., & Maulana, R. (2014). Teaching skills of student teachers: Calibration of an evaluation instrument and its value in predicting student academic engagement. Studies in Educational Evaluation, 43, 150–159. https://doi.org/10.1016/j.stueduc.2014.09.003
- van de Grift, W. J. C. M., Houtveen, T. A. M., Hurk, H. T. G. V. D., & Terpstra, O. (2019). Measuring teaching skills in elementary education using the rasch model. School Effectiveness and School Improvement, 30(4), 455–486. https://doi.org/10.1080/09243453.2019.1577743
- van der Lans, R. M., van de Grift, W. J. C. M., & Veen, K. V. (2018). Developing an instrument for teacher feedback: Using the rasch model to explore teachers’ development of effective teaching strategies and behaviors. The Journal of Experimental Education, 86(2), 247–264. https://doi.org/10.1080/00220973.2016.1268086
- VanderWeele, T. J. (2022). Constructed measures and causal inference: Towards a new model of measurement for psychosocial constructs. Epidemiology (Cambridge, Mass), 33(1), 141. https://doi.org/10.1097/EDE.0000000000001434
- Vermunt, J., & Magidson, J. (2004). Latent class analysis. In The Sage encyclopedia of social science research methods (pp. 549–553). SAGE Publications, Inc.
- Virtanen, T. E., Pakarinen, E., Lerkkanen, M.-K., Poikkeus, A.-M., Siekkinen, M., & Nurmi, J.-E. (2018). A validation study of classroom assessment scoring system–secondary in the Finnish school context. The Journal of Early Adolescence, 38(6), 849–880. https://doi.org/10.1177/0272431617699944
- Virtanen, T. E., Vaaland, G. S., & Ertesvåg, S. K. (2019). Associations between observed patterns of classroom interactions and teacher wellbeing in lower secondary school. Teaching and Teacher Education, 77, 240–252. https://doi.org/10.1016/j.tate.2018.10.013
- White, M. (2017). Generalizability of scores from classroom observation instruments. University of Michigan. http://hdl.handle.net/2027.42/138742
- White, M., & Klette, K. (2023). What’s in a score? Problematizing interpretations of observation scores. Studies in Educational Evaluation, 77, 101238. https://doi.org/10.1016/j.stueduc.2023.101238
- White, M., Luoto, J. M., Klette, K., & Blikstad Balas, M. (2022, August 19). Bringing the theory and measurement of teaching into alignment Studies in Educational Evaluation, 75. https://doi.org/10.1016/j.stueduc.2022.101204
- Wilson, M., & Gochyyev, P. (2020). Having your cake and eating it too: Multiple dimensions and a composite. Measurement, 151, 107247. https://doi.org/10.1016/j.measurement.2019.107247
- Yang, Y., & Hu, B. Y. (2019). Chinese preschool teachers’ classroom instructional support quality and child-centered beliefs: A latent profile analysis. Teaching and Teacher Education, 80, 1–12. https://doi.org/10.1016/j.tate.2018.12.021
- Yarkoni, T. (2020). Implicit realism impedes progress in psychology: Comment on fried (2020). Psychological Inquiry, 31(4), 326–333. https://doi.org/10.1080/1047840X.2020.1853478