
ABSTRACT
Genes participating in the changes of yolk lipids by unsaturated oils remain elusive. In this study, ducks were randomly assigned to 3 groups, fed with basal-diet (C), basal-diet-plus-2%-flaxseed-oil (FL), or basal-diet-plus-2%-fish-oil (F), respectively. A digital-gene-expression-profiling analysis of livers were performed after four weeks. Compared to C, 36 and 25 differently-expressed-genes (DEG) were identified in FL and F, respectively. These genes participated in lipid metabolism pathways. In both F and FL, the sterol 12 α-hydroxylase 1 gene was down regulated, as well as the fatty acid synthase gene and stearoyl-CoA desaturase gene. In FL, the fatty acid desaturase 2 gene (FADS2) and elongation of the very long-chain fatty acids protein 2 gene (ELOVL2) were up regulated, and the CYP2U (cytochrome P450, family 2, subfamily U) was down regulated. However, the FADS2 and ELOVL2 were down regulated in F to possibly prevent the redundancy of body n-3 PUFAs. In conclusion, FL and F had different molecular pathways to reduce yolk cholesterol and increase n-3 PUFAs. However, CYP8B1 and FADS2 were the key genes in the regulation of both of them. α-linolenic acid in the FL might be transformed to longer n-3 PUFAs. In addition, this study adds sequence information to duck.
Introduction
Duck egg is one of the most important components of human diet, especially in Asia. It contains important nutrition, such as fatty acids and cholesterol. However, people are advised to limit their intake of egg yolks due to the high fat and cholesterol contents. Among the yolk fatty acids, omega-3 polyunsaturated fatty acids (n-3 PUFAs), especially DHA (docosahexaenoic acid, C22:6) and EPA (eicosapentaenoic acid, C20:5), are ‘good fatty acids’ that essential for vertebrates and play an important role in their growth, development, and reproduction. Recent studies suggest that the limits to dietary cholesterol should be abandoned, as it almost has no influences on cardiovascular diseases and diabetes in the human (Geiker et al. Citation2018). However, there are good reasons for longstanding recommendations that dietary cholesterol should be limited to below 200 mg/day in persons at risks of vascular diseases (David Citation2016). Therefore, much attention has been focused on poultry eggs with a low level of cholesterol and a high level of n-3 PUFAs.
Since the first report from Cruickshank (Citation1934) that the fatty acid (FA) compositions of eggs could be significantly influenced by the addition of various dietary FAs. Other studies also demonstrated that dietary PUFAs could not only alter egg FA compositions but also reduce yolk cholesterol amount in avian species (Couch and Saloma Citation1973; Liu et al. Citation2011; Deng et al. Citation2012). Our previous study (Du X et al., 2017) proved that the ducks with optimal egg-production supplemented with 2% fish oil or 2% flaxseed oil on their basal diets increased yolk n-3 PUFA content and reduced yolk cholesterol content. However, the underlying molecular mechanisms remain undefined.
Recently-developed digital gene expression (DGE) profiling technology has been widely applied to identify specific and abundant genes from millions of sequencing tags among experimental groups. The liver plays an important role in the maintenance of cholesterol and fatty acids homeostasis. It is the major site for the biosynthesis of cholesterol and the conversion of other FAs to PUFAs (polyunsaturated fatty acids) in vivo. In this study, the livers of Shan Partridge ducks were collected, and DGE profiling was performed to elucidate the molecular mechanisms of how flaxseed oil and fish oil lower cholesterol and increase n-3 PUFAs contents in the egg-laying ducks. To increase the reliability of the gene function annotation, the de novo assembly of RNA-Seq tags was used. This study provides molecular information on the role of flaxseed oil and fish oil in the production of eggs with high n-3 PUFA and low cholesterol.
Materials and methods
Animal care
In this study, the Shan Partridge ducks were randomly selected from one hereditary line at Guowei Poultry Industry Co., Ltd. China. All experimental ducks were grown in individual cages under natural temperature and light conditions in May in Zhejiang Province. Feed and water were provided ad libitum. Animals used in our study were cared in strict accordance with the Institutional Animal Care and Use Committee (IACUC) of Zhejiang Academy of Agricultural Sciences.
Experimental design
A flock of 135 Shan Partridge ducks with optimal egg production were randomly selected and divided into 3 groups. Each group contained 45 ducks and were divided equally to 3 pens. The control group (the C group) was fed on a basal diet. The other two groups were fed on basal diets supplemented with either 2% flaxseed oil (FL) or 2% fish oil (F). The ingredients and calculated nutrient levels of the basal diet were shown in Table S1 and were formulated to meet or exceed NRC. The fatty acid (FA) contents of the supplements were shown in Table S2. The ducks were reared for 4 weeks. The laid eggs were collected for three days for the measurement of yolk FA and cholesterol contents. At the end of the experiment, the ducks were sacrificed by cervical dislocation to obtain livers for the de novo transcriptome assembly and digital gene expression analysis. The livers were isolated, frozen immediately in liquid nitrogen, and stored at −80°C until RNA extraction.
Lipid extraction and methyl esterification were done as our previous study (Chen et al. Citation2017). Briefly, one gram of the yolk sample was ground and mixed with 2 mL of chloroform/methanol (1:2, v/v in 0.001% Butylated hydroxytoluene), 1 mL of chloroform, and 1 mL of water. The mixture was then centrifuged at 1000 r/min for 15 min, and the lower layer was collected subsequently. The above procedure were repeated twice. All the three lower layers were combined together in a tube and evaporated under a stream of N2 gas. The lipids were then methylated to fatty acid methyl esters (FAMEs) and measured. Briefly, pentadecanoic acid was added to each sample as an internal standard. Derivatization was performed with 1 mL of 3 M methanolic hydrochloric acid at 78°C for 30 min. Then 2 mL of hexane:chloroform (4:1, v/v) were added to each tube. The upper phase was collected after vortex and centrifuge. The above procedure was repeated twice, and the three upper phases were combined and dried under nitrogen gas. The mixture was redissolved in 200 μL of hexane, and transferred into a GC vial with an insert. Then, the lipid compositions were analyzed using a gas chromatography (6890, Agilent, USA) on a HP-5MS column (Agilent 30 m × 0.25 mm × 0.2 μm, Agilent, USA). Helium was used as the carrier gas. The total cholesterol (TC) was determined by the cholesterol oxidase p-aminophenol (COD-PAP) method. Briefly, 1 mL yolk and 9 mL PBS were ground on ice. The mixture was then centrifuged at 1000 r/min for 15 min. Subsequently, the upper layer was collected and measured in a Microplate Reader.
RNA isolation, library construction and sequencing
A two-step approach was applied to analyze the mechanisms of how the flaxseed oil and fish oil diets lowered cholesterol and increased n-3 PUFAs. Three ducks per group were randomly selected. An integrated reference transcriptome was constructed de novo via RNA-Seq by pooling all the 9 samples. Digital gene expression (DGE) libraries were constructed from each duck for differentially expressed gene analysis.
Total RNAs were isolated from the livers using the TRIzol reagent (Life Technologies, USA) according to the manufacturer’s protocol. A Nanodrop ND-1000 spectrophotometer was used to assess the quantity and quality of the RNA samples. All the samples had an A260:A280 ratio >1.8 and an A260:A230 ratio >2.0. An Agilent 2200 TapeStation (Agilent Technologies, USA) was used to evaluate RNA integrity, and all the samples had a RINe >7.0. The messenger RNAs were isolated from total RNA by magnetic Oligo (dT) beads and fragmented to approximate 200 bp. The fragments were reverse-transcribed into double-stranded cDNA. Subsequently, a TruSeq® RNA LT/HT Sample Prep Kit (Illumina, USA) was used for adaptor ligation and enrichment with a low-cycle. The purified library products were evaluated by the Agilent 2200 TapeStation and Qubit® 2.0 (Life Technologies, USA) and then diluted to 10 pM for cluster generation in situ on an Illumina HiSeq™ 2500. The de novo transcriptome library was paired-end sequenced at 2 × 100 bp. The 9 libraries for DGE profiling were constructed from each liver sample and single-end sequenced separately at 1 × 50 bp.
De novo transcriptome assembly and annotation
Before the assembly, high quality clean reads were generated by removing adapter sequences and low quality reads in the employ of fastX toolkit. The Trinity were used for the production of contigs by extension through links of overlapped reads. Subsequently, the contigs were further clustered with TGICL software (Pertea et al. Citation2003) to extract scaffolds. Unigenes with the length equal to or longer than 200 bp were retained to compare with Kyoto Encyclopedia of Genes and Genomes (Kanehisa and Goto Citation2000) (KEGG, https://www.genome.jp/), Gene Ontology (Ashburner et al. Citation2000) (GO), Clusters of Orthologous Group of proteins/ Eukaryotic Orthologous Groups of proteins (Tatusov et al. Citation2003) (COG/KOG), NCBI non-redundant protein database (NR), and SwissProt protein database by BLASTX (version 2.2.14) with an E-value threshold of 1e−5. The results were noted and gathered to obtain the homologous protein sequences and related pathways. The de novo assembly results served as a reference transcriptome for DGE profiling.
The top BLASTX hits of NCBI NR annotations were used for identifying putative homologous proteins, and each unigene was annotated with GO terms using Blast2 GO (Conesa et al. Citation2005). The GO classification was performed using WEGO (Ye et al. Citation2006) according to molecular function, biological process, and cellular component ontologies to provide the background of gene functional category tags and gene functional study. A GO enrichment analysis for the selected gene set with RPKM values >100 was performed and visualized in Cytoscape (v2.8.3). The cytoscape plugin BiNGO (v2.44) (Maere et al. Citation2005) was customized with the GO annotation results of the Shan Partridge duck de novo transcriptome and then used to perform the hypergeometric statistical test of significance (corrected p-value <0.05) to assess GO term enrichment. To adjust for multiple hypothesis testing, a Benjamini and Hochberg false discovery rate (FDR) correction was performed.
In order to investigate the metabolic pathway annotations of unigenes, the unigenes were aligned using the KEGG database. Enzyme codes were acquired for each sequence, and Enzyme Commission numbers were used to color and retrieve the KEGG pathway maps by KOBAS (Xie et al. Citation2011) with a corrected p-value <0.05.
Analysis of differentially expressed genes between treatments
The clean reads of three DGE profiles were gathered and mapped against the reference transcriptome with Tophat (v1.4.0) (Trapnell et al. Citation2009) to get a synthetic evaluation of sequencing coverage regions and depths. Two mismatches per read and 2 gaps per read were permitted in the comparisons. The RPKM of each gene was also calculated and used to estimate the levels of gene expression with p-values adjusted into q-values using the FDR method. Q-values ≤ 0.001 and |log2(Fold change)| > 1 served as the threshold of significance for DEG (Audic and Claverie Citation1997).
Enrichment analyses of DEG using KEGG were applied. Hypergeometric distribution of each DEG was constructed to analyze the most significantly (P < 0.01) enriched KEGG pathways, through which genes with specific functions were identified.
Quantitative real-time PCR validation
RNAs from 6 individuals per group were prepared as detailed above and reverse-transcribed into cDNA by Reverse Transcriptase M-MLV (RNase H-) (TaKaRa, Code No.: D2639A). Quantitative real-time PCR (qRT-PCR) was implemented for the DEG that had shown a relationship with FA or cholesterol metabolism. The duck beta-actin gene (Actin-B) served as an internal control gene, as it stable expressed in liver and ovary. Primer sequences were designed by Primer Premier 5 and shown in . QRT-PCR with SYBR Real-time PCR Premix Ex TaqTM (Tli RNaseH Plus) (TaKaRa, Code No.:RR420A) was performed on a 7300 System (Eppendorf, Germany). The results were normalized to the expression level of the constitutive Actin-B, and a relative quantitative method (2−ΔΔCt) was used to evaluate the quantitative variation.
Table 1. Primers used in qRT-PCR.
Results
Yolk cholesterol and fatty acids
The effect of different oils on yolk cholesterol is shown in . The yolk cholesterol level in the C group was significantly (P < 0.05) higher than those in the F and FL groups, whereas there was no significant difference between the F and FL groups.
Table 2. Influences of dietary oils on yolk cholesterol content (mmol/L yolk) and fatty acid proportions (g/100 g total fatty acids).
The effect of different oils on the proportions of yolk FAs is shown in . There was no significant difference in mono-unsaturated fatty acids (MUFAs) between any 2 groups. Saturated fatty acids (SFAs) in the C group were significantly higher than the FL and F groups, whereas the PUFA content in the C group was significantly lower than the FL and F groups. These results suggested that the diets with 2% flaxseed oil or 2% fish oil could reduce the proportions of SFA and increase the content of PUFAs (both n-6 PUFA and n-3 PUFA) in the yolks. This was in agreement with the findings that supplementation of UFA can increase the concentration of the same UFA in the yolks (Cherian et al. Citation1996; Antruejo et al. Citation2011). The concentrations of EPA and DHA in the F group were significantly higher than those in other groups. Significantly increased ALA (α-linolenic acid, C18:3) was observed in the FL group in comparison to the C and F groups.
Illumina sequencing and de novo assembly
To obtain an overall liver transcriptome for Shan Partridge ducks, a mixture of equal amounts of total RNAs isolated from different groups was used to construct the sequencing library. Illumina sequencing produced 61.6 million raw reads, 53.2 million of which were retained following the removal of adapter sequences and low quality reads. The deep sequencing data has been uploaded to the NCBI Sequence Read Archive, the SRA accession of de novo Transcriptome is SRR7146572. 55,426 unigenes were assembled with an N50 of 1943 bp, which was the length of the shortest contig at 50% of the total transcriptome length.
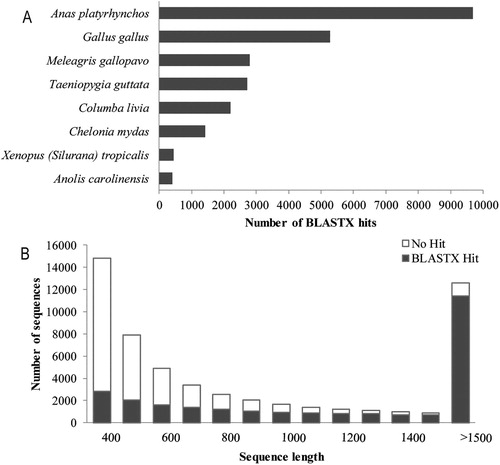
For the annotation and classification of the assembled unigenes, sequence similarity searches were performed against public protein databases: NCBI NR, SwissProt, GO, KOG, and KEGG. There were 27,376 unigenes with a significant similarity (E-value < 1e−5) to the existing records in the databases (Xls. S1). The transcript abundance and BLASTX Hit ratio of the unigenes were evaluated relative to the sequence length (a). Sorting the BLASTX hits by species revealed the top two species: Anas platyrhynchos (36.9%) and Gallus gallus (20.12%) (b). The reference transcriptome was further utilized for the analysis of DEG between the dietary treatments of Shan Partridge ducks.
Figure 1. The length and species distribution of unigenes from the de novo assembled liver transcriptome. (A) Species distribution of the unigenes in the Shan Partridge duck de novo liver transcriptome with significant BLASTX Hits. Top scoring BLASTX Hits against the NCBI-NR protein database are depicted. The number of BLAST hits per species is shown on the x-axis. The 8 most represented species with proportions of more than 1% were shown in the histogram. (B) The distribution of sequence lengths was shown. Most of the sequences longer than 1500 had BLASTX hits.
Functional annotation of Shan Partridge duck de novo transcriptome
To understand the putative functional categories of the annotated unigenes, GO was employed to classify the annotated transcripts ( and Xls. S2). A total of 12,549 unigenes were annotated with one or more terms. The terms were categorized into GO functional groups distributed across three categories: biological processes (10,027), cell components (8913), and molecular functions (9947). KEGG provides a basic database for the systematic analysis of gene functions in terms of the metabolic networks of gene products (Kanehisa et al. Citation2012). The Unigenes annotated by KEGG orthologous proteins were mapped to the metabolic pathways. In total, 25,702 unigenes were mapped to 278 reference pathways. In addition to the GO and KEGG analyses, a KOG analysis was performed to further evaluate the function of the assembled unigenes (). Of 20,577 unigenes assigned to KOG, ‘Signal transduction mechanisms’ (20.6%) was the most represented category, followed by ‘General function prediction’ (19.7%), ‘Post-translational modification, protein turnover, chaperones’ (9.7%), ‘Cytoskeleton’ (9.4%), ‘Extracellular structures’ (7.0%), and ‘Transcription’ (6.8%). These results provide a reference for the investigation of specific functions, processes and pathways, as well as for the identification of novel genes involved in the liver lipid-related metabolism in the Shan Partridge duck.
Figure 2. Gene Ontology classification of the de novo assembled liver transcriptome of the Shan Partridge duck. Gene Ontology annotation results of the genes from the de novo assembled Shan Partridge Duck liver transcriptome were mapped to the categories of GO terms. The y-axis and x-axis indicate the numbers of genes in each cluster and the names of clusters, respectively. Molecular functions, biological processes and cellular components are shown in different colors.
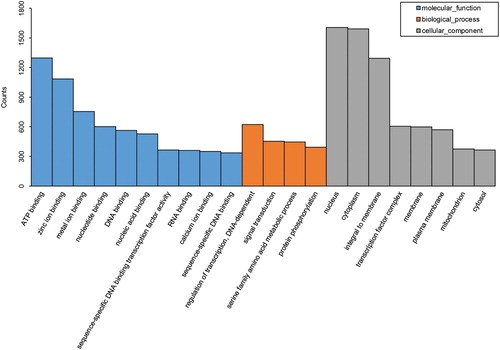
Table 3. KOG functional classification of Shan Partridge duck de novo transcripts.
Expression analysis and DEG
Nine DGE libraries (C1, C2, C3, FL1, FL2, FL3, F1, F2 and F3, see Materials and Methods) were constructed and sequenced. The deep sequencing data have been uploaded to the NCBI Sequence Read Archive. The SRA accessions are SRR7141761 (C1), SRR7141760 (C2), SRR7141763 (C3), SRR7141762 (FL1), SRR7141765 (FL2), SRR7141764 (FL3), SRR7141767 (F1), SRR7141766 (F2), and SRR7141759 (F3). The high quality of each library was confirmed by the Q30 and GC contents of the reads (). More than 10 million clean reads were obtained from each library, and 88% to 92.05% of them were mapped to the reference transcriptome, and over 73% of the reads were uniquely mapped. The numbers of reads aligned to a unigene ranged from 1 to 252,361, with a mean of 155.3 for the C group, 157.8 for the FL group, and 160.0 for the F treatment, respectively. Based on the number of uniquely aligned reads, each unigene was assigned an RPKM value, which was normalized to the total reads obtained in each individual library. The mean RPKM values of transcripts for the C, FL, and F groups were 12.35, 12.16, and 12.48, respectively. The numbers of upregulated DEG were 156, 216, and 231, and the downregulated DEG were 740, 667, and 171 in the comparisons of C vs. FL, C vs. F, and F vs. FL, respectively. Interestingly, the C vs. FL comparison had the least upregulated DEG and the most downregulated DEG. Furthermore, the F vs. FL comparison had the most upregulated DEG and the least downregulated DEG. These results suggested that the regulation mechanism of flaxseed oil and fish oil were different. Compared to the F, the FL treatment induced a larger change in gene expression, which was in consistent with the effects on yolk fatty acid content.
Table 4. Summary for DGE sequencing datasets.
Functional annotation of DEG
The KEGG pathway analysis of DEG was also performed. As expected, the analysis indicated that some DEG resulted from the C vs. FL, C vs. F, and F vs. FL comparisons were related to lipid metabolism pathways ().
Table 5. DEG related to lipid metabolism and the basic information.
Compared to the C diet, the FL diet significantly reduced the expression of cholesterol synthesis related gene, CYP8B1 (cytochrome P450, family 8, subfamily B, polypeptide 1), and significantly increased cholesterol decomposition related gene, CYP7A1 (7-alpha-monooxygenase). On the other side, the FL diet significantly reduced the expression of DHA decomposition related gene, CYP2U (cytochrome P450, family 2, subfamily U), and significantly increased the expression of n-3 PUFAs synthesis related gene, FADS2 (fatty acid desaturase 2). In addition, the FL diet regulated SCD (stearoyl-CoA desaturase) and FASN (FA synthese), these two genes are related to short-chain fatty acid synthesis. Some other differently expressed genes were also detected by comparing C vs FL, including glyceride metabolism related genes, such as LCAT (lecithin–cholesterol acyltransferase), LPIN (lipin-1), ALDH9A1 (aldehyde dehydrogenase 9 family, member A1), and LPL (lipoprotein lipase).
Compared to the C diet, the F diet decreased the expression of CYP8B1. On the other hand, the F diet significantly increased long chain fatty acids decomposition related gene expression, ACSL (long chain fatty acyl-CoA synthetase), and reduced n-3 PUFAs synthesis related gene expression, ELOVL2 (elongation of very long chain fatty acids protein 2) and FADS2. In addition, the F diet regulated the expression of CYP2C (cytochrome P450, family 2, subfamily C), CPT1 (carnitine palmitoyltransferase 1), SCD, and FASN, which are possibly related to the reduction of short-chain fatty acid content.
Quantitative real-time PCR validation
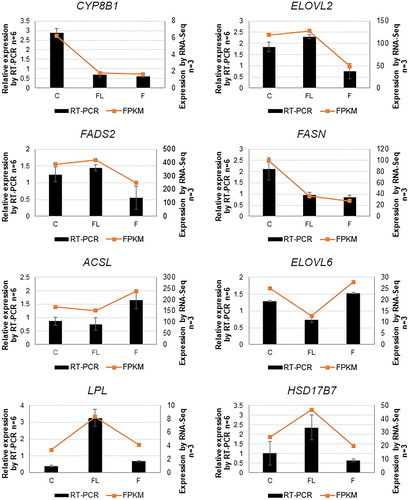
In order to validate the differential gene expression, eight genes were selected for qRT-PCR analysis. The results are shown in . The gene expression results obtained through qRT-PCR mostly corroborated DEG data, suggesting that the DGE profiling analysis provided reliable data for the Shan Partridge ducks fed with fish oil or flaxseed oil diets.
Figure 3. Verification of the expression of 8 DEG by qRT-PCR in the C, FL, and F groups. Actin-B was used as a reference gene for normalization of gene-expression data. The left Y-axis represents relative gene expression levels measured by qRT-PCR, whereas the right Y-axis represents FPKM of the genes measured by RNA-Seq for the stages using the same RNA samples. C: control group; FL: flaxseed oil group; F: fish oil group. All qRT-PCR data are shown as mean ± standard error.
Discussion
In the study, we confirmed that the 2% flaxseed oil or 2% fish oil diet supplements lowered cholesterol and SFA contents, but increased PUFA contents in the yolks of Shan Partridge ducks. This finding was consistent with previous studies on egg-laying hens that were fed dietary flaxseed oil or fish oil (Basmacioglu et al. Citation2004; Liu et al. Citation2011; Du et al. Citation2017). The results of the present study confirmed that the diets supplemented with 2% flaxseed oil or 2% fish oil for 28 days had the same cholesterol-lowering effect on the yolks of Shan Partridge ducks. It is worth noting that the diet plus 2% flaxseed oil, which has the same EPA and DHA content as our C group diet, significantly increased EPA and DHA in the yolks, suggesting that ALA in the FL group diet might be transformed into EPA and DHA in the liver.
To analyze the DEG in the liver induced by the F and FL diet supplements, the duck liver transcriptome was de novo assembled with an N50 of 1943 bp, and 27,376 unigenes were identified and annotated. The top two species that had the most BLASTX hits with the transcriptome were Anas platyrhynchos (36.9%) and Gallus gallus (20.12%). It is important to note that Anas platyrhynchos is a closely-related species of the Shan Partridge duck. However, due to the incomplete sequence information of Anas platyrhynchos in the public databases, the hit ratio was not very high. The results indicated that a large number of specific genes were present in our de novo assembly, which will provide a resource for the development of functional molecular markers of Shan Partridge ducks.
Differentially expressed genes were further identified between the diet groups, which were annotated functionally via GO functional enrichment and KEGG pathway analyses. GO functional enrichment analysis results showed that the most significantly enriched molecular function and cellular component induced by FL and F supplements were ATP binding and cytoplasm, respectively. The enriched function and cellular component of the F vs. FL comparison were metal ion binding and integration to the membrane, respectively. Metal ion binding is important for the structure and function of proteins and other functional molecules. Compared to flaxseed oil, fish oil contains more DHA and EPA, which are important for the integrity of the membranes (Giusto et al. Citation2000). The FL diet led to the enrichment of DEG in the oxidation–reduction process compared to the C or F diets. This is possibly because FL diet is ALA rich, which is the precursor to synthesize DHA and EPA in an oxidation–reduction process.
KEGG pathway analysis of the DEG suggested three key points. First, both fish oil and flaxseed oil reduced yolk cholesterol possibly by decreasing the expression of CYP8B1, which is an important enzyme that catalyzes the monooxygenation at the 12α position of 7α-hydroxy-4-cholesten-3-one in the synthesis of cholesterol. Previous studies have shown that CYP8B1 feedback regulates cholesterol 7α-hydroxylase (CYP7A1), which is the rate-limiting enzyme of cholesterol degradation (Li-Hawkins et al. Citation2002). In addition to CYP8B1, the flaxseed oil diet directly increased the expression of CYP7A1, whereas the fish oil diet had no significant effects on this gene.
Second, both F and FL inhibited FA biosynthesis by reducing the expression of FASN (Munoz et al. Citation2003). FASN is a key enzyme of lipogenesis. In this study, both fish oil and flaxseed oil supplied sufficient basic FAs for the ducks; thus, the body automatically reduced de novo FA synthesis.
Third, both the fish oil and flaxseed oil diets upregulated CPT1 and downregulated SCD in the biosynthesis of UFAs. Additionally, the F diet significantly downregulated ELOVL2 and upregulated ACSL, whereas flaxseed oil did not. CPT1 is an enzyme responsible for the transport of acyl groups of long-chain fatty acid-CoA into mitochondria for oxidation (Guo et al. Citation2012). SCD catalyzes the rate-limiting step in the formation of MUFAs. ELOVL2 is essential for the conversion of dietary ALA to DHA as it can elongate DPA (22:5n-3) to 24:5n-3, which is required for DHA synthesis (Gregory and James Citation2014). ACSL is a ligase that catalyzes the breakdown of complex fatty acids (Soupene and Kuypers Citation2008). It is suggested that when supplied with oils rich in PUFAs, ducks changed their metabolic pathways to promote the decompostion of fatty acids, enhance the synthesis of DHA and EPA, and inhibit the de novo synthesis of FAs. As fish oil is also rich in DHA and EPA, which can satisfy the body demands, the synthesis key enzyme, ELOVL2, was downregulated to prevent energy dissipation.
In conclusion, both flaxseed oil and fish oil supplements reduced yolk cholesterol and increase yolk n-3 PUFAS. However, the flaxseed oil supplements induced a larger change in gene expression than fish oil supplements. CYP8B1 and FADS2 were the key genes in the regulation of both flaxseed oil and fish oil supplements. ALA in the flaxseed oil might be transformed to n-3 PUFAs, such as DHA and EPA. For another, we assembled de novo duck liver transcriptome as a resource for the further studies.
TAAR_1764848_Supplementary_Material
Download Zip (3.4 MB)Disclosure statement
No potential conflict of interest was reported by the author(s).
Additional information
Funding
References
- Antruejo A, Azcona JO, Garcia PT, Gallinger C, Rosmini M, Ayerza R, Coates W, Perez CD. 2011. Omega-3 enriched egg production: the effect of alpha -linolenic omega -3 fatty acid sources on laying hen performance and yolk lipid content and fatty acid composition. Br Poult Sci. 52(6):750–760.
- Ashburner M, Ball CA, Blake JA, Botstein D, Butler H, Cherry JM, Davis AP, Dolinski K, Dwight SS, Eppig JT, et al. 2000. Gene ontology: tool for the unification of biology. The gene ontology consortium. Nat Genet. 25(1):25–29.
- Audic S, Claverie JM. 1997. The significance of digital gene expression profiles. Genome Res. 7(10):986–995.
- Basmacioglu H, Cabuk M, Unal K, Ozkan K, Akkan S, Yalcin H. 2004. Effects of dietary fish oil and flax seed on cholesterol and fatty acid composition of egg yolk and blood parameters of laying hens. S Afr J Anim Sci. 33(4):266–273.
- Chen X, Du X, Shen J, Lu L, Wang W. 2017. Original research: effect of various dietary fats on fatty acid profile in duck liver: efficient conversion of short-chain to long-chain omega-3 fatty acids. Exp Biol Med (Maywood). 242(1):80–87.
- Cherian G, Wolfe FW, Sim JS. 1996. Dietary oils with added tocopherols: effects on egg or tissue tocopherols, fatty acids, and oxidative stability. Poult Sci. 75(3):423–431.
- Chuang SS, Helvig C, Taimi M, Ramshaw HA, Collop AH, Amad M, White JA, Petkovich M, Jones G, Korczak B. 2004. CYP2U1, a novel human thymus- and brain-specific cytochrome P450, catalyzes omega- and (omega-1)-hydroxylation of fatty acids. J Biol Chem. 279(8):6305–6314.
- Conesa A, Gotz S, Garcia-Gomez JM, Terol J, Talon M, Robles M. 2005. Blast2GO: a universal tool for annotation, visualization and analysis in functional genomics research. Bioinformatics. 21(18):3674–3676.
- Couch JR, Saloma AE. 1973. Effect of diet on triglyceride structure and composition of egg yolk lipids. Lipids. 8(7):385–392.
- Cruickshank EM. 1934. Studies in fat metabolism in the fowl: the composition of the egg fat and depot fat of the fowl as affected by the ingestion of large amounts of different fats. Biochem J. 28(3):965–977.
- David SJ. 2016. Dietary cholesterol and egg yolk should be avoided by patients at risk of vascular disease. J Transl Int Med. 4(1):20–24.
- Deng W, Dong XF, Tong JM, Xie TH, Zhang Q. 2012. Effects of an aqueous alfalfa extract on production performance, egg quality and lipid metabolism of laying hens. J Anim Physiol An N. 96(1):85–94.
- Du X, Liu Y, Lu L, Wang W, Zeng T, Tian Y, Xu X, Shen J, Niu D, Lu Y. 2017. Effects of dietary fats on egg quality and lipid parameters in serum and yolks of Shan Partridge duck. Poult Sci. 96(5):1184–1190.
- Geiker N, Larsen ML, Dyerberg J, Stender S, Astrup A. 2018. Egg consumption, cardiovascular diseases and type 2 diabetes. Eur J Clin Nutr. 72(1):44–56.
- Giusto NM, Pasquare SJ, Salvador GA, Castagnet PI, Roque ME, Ilincheta DBM. 2000. Lipid metabolism in vertebrate retinal rod outer segments. Prog Lipid Res. 39(4):315–391.
- Graves JP, Gruzdev A, Bradbury JA, DeGraff LM, Li H, House JS, Hoopes SL, Edin ML, Zeldin DC. 2015. Quantitative polymerase chain reaction analysis of the mouse Cyp2j subfamily: tissue distribution and regulation. Drug Metab Dispos. 43(8):1169–1180.
- Gregory MK, James MJ. 2014. Functional characterization of the duck and Turkey fatty acyl elongase enzymes ELOVL5 and ELOVL2. J Nutr. 144(8):1234–1239.
- Guo H, Liu G, Zhong R, Wang Y, Wang D, Xia M. 2012. Cyanidin-3-O-beta-glucoside regulates fatty acid metabolism via an AMP-activated protein kinase-dependent signaling pathway in human HepG2 cells. Lipids Health Dis. 11:10.
- Kanehisa M, Goto S. 2000. KEGG: kyoto encyclopedia of genes and genomes. Nucleic Acids Res. 28(1):27–30.
- Kanehisa M, Goto S, Sato Y, Furumichi M, Tanabe M. 2012. KEGG for integration and interpretation of large-scale molecular data sets. Nucleic Acids Res. 40(Database issue):D109–D114.
- Li-Hawkins J, Gafvels M, Olin M, Lund EG, Andersson U, Schuster G, Bjorkhem I, Russell DW, Eggertsen G. 2002. Cholic acid mediates negative feedback regulation of bile acid synthesis in mice. J Clin Invest. 110(8):1191–1200.
- Liu WM, Lai SJ, Lu LZ, Shi FX, Zhang J, Liu Y, Yu B, Tao ZR, Shen JD, Li GQ, et al. 2011. Effect of dietary fatty acids on serum parameters, fatty acid compositions, and liver histology in Shaoxing laying ducks. J Zhejiang Univ Sci B. 12(9):736–743.
- Lundblad MS, Stark K, Eliasson E, Oliw E, Rane A. 2005. Biosynthesis of epoxyeicosatrienoic acids varies between polymorphic CYP2C enzymes. Biochem Biophys Res Commun. 327(4):1052–1057.
- Maere S, Heymans K, Kuiper M. 2005. BiNGO: a Cytoscape plugin to assess overrepresentation of gene ontology categories in biological networks. Bioinformatics. 21(16):3448–3449.
- Munoz G, Ovilo C, Noguera JL, Sanchez A, Rodriguez C, Silio L. 2003. Assignment of the fatty acid synthase (FASN) gene to pig chromosome 12 by physical and linkage mapping. Anim Genet. 34(3):234–235.
- Pertea G, Huang X, Liang F, Antonescu V, Sultana R, Karamycheva S, Lee Y, White J, Cheung F, Parvizi B, et al. 2003. TIGR gene Indices clustering tools (TGICL): a software system for fast clustering of large EST datasets. Bioinformatics. 19(5):651–652.
- Soupene E, Kuypers FA. 2008. Mammalian long-chain acyl-CoA synthetases. Exp Biol Med (Maywood. 233(5):507–521.
- Tatusov RL, Fedorova ND, Jackson JD, Jacobs AR, Kiryutin B, Koonin EV, Krylov DM, Mazumder R, Mekhedov SL, Nikolskaya AN, et al. 2003. The COG database: an updated version includes eukaryotes. Bmc Bioinformatics. 4:41.
- Trapnell C, Pachter L, Salzberg SL. 2009. Tophat: discovering splice junctions with RNA-Seq. Bioinformatics. 25(9):1105–1111.
- Xie C, Mao X, Huang J, Ding Y, Wu J, Dong S, Kong L, Gao G, Li CY, Wei L. 2011. KOBAS 2.0: a web server for annotation and identification of enriched pathways and diseases. Nucleic Acids Res. 39(Web Server issue):W316–W322.
- Ye J, Fang L, Zheng H, Zhang Y, Chen J, Zhang Z, Wang J, Li S, Li R, Bolund L, Wang J. 2006. WEGO: a web tool for plotting GO annotations. Nucleic Acids Res. 34(Web Server issue):W293–W297.