
ABSTRACT
The effects of n-6 and n-3 fatty acid supplementation on the fatty acid profile of sow milk were investigated using traditional fatty acid analysis and a novel method of the electronic nose (EN). The control group received 6.3 g of sunflower oil (SO) rich in n-6 fatty acids per kg feed, and experimental animals received the same amount of fish oil (FO) as an n-3 fatty acid source. The diets were corn- and soybean meal-based diets. Supplementation of SO enhanced the amount of linoleic acid (C18:2, n-6) (SO: 8.43 mg/mL vs. FO: 6.63 mg/mL milk), and significantly increased (p < 0.02) the amount of total polyunsaturated fatty acids (SO: 9.92 mg/mL vs. FO: 8.61 mg/mL milk) in the sow’s milk. On the contrary, FO significantly increased the amount of n-3 polyunsaturated fatty acids (FO: 1.17 mg/mL vs. SO: 0.69 mg/mL milk), especially eicosapentaenoic acid (C20:5, n-3), docosapentaenoic acid (C22:5, n-3), and docosahexaenoic acid (C22:6, n-3), in the milk (p < 0.001). FO and SO supplementation did not affect the analytical composition of milk. Milk samples collected from the differently fed individuals could be clearly separated according to the feeding groups based on the odour profile described by the EN.
1. Introduction
Polyunsaturated fatty acids (PUFAs), particularly n-6 and n-3 fatty acids, are the focus of research in both humans and farm animals. The effects of these nutrients on the performance, reproduction biology parameters, health issues, and functional food production in swine have already been widely investigated. The n-3 PUFA sources that have been commonly used in this research are flaxseed/oil (Nuernberg et al. Citation2005; De Tonnac et al. Citation2017; Ogłuszka et al. Citation2020), fish oil (Laws et al. Citation2009; Petrone et al. Citation2019; Komprda et al. Citation2020; McDermott et al. Citation2020), and microalgae extract (De Tonnac et al. Citation2017; Moran et al. Citation2018; Posser et al. Citation2018).
From the n-6 and n-3 PUFAs, linoleic acid (LA) (C18:2, n-6) and linolenic acid (ALA) (C18:3, n-3) are considered essential for swine because they cannot be endogenously synthesized and must therefore be ingested in their diet (Di Pasquale Citation2009). These long-chain (LC) PUFAs can pass through the placenta into the fetus via the bloodstream and are excreted through sow milk (Greenberg et al. Citation2008; Sampels et al. Citation2011). From a physiological point of view, the most important and examined LC PUFAs are LA, ALA, arachidonic acid (ARA, C20:4, n-6), eicosapentaenoic acid (EPA; C20:5, n-3), and docosahexaenoic acid (DHA; C22:6, n-3). These long-chain fatty acids play an important role in both immune and reproductive functions because they are precursors for the synthesis of different types of eicosanoids (Grez et al. Citation2016). Many studies have investigated the effect of LC PUFAs, including n-3 fatty acids, on the health and performance parameters of sows and their progeny (Tanghe et al. Citation2014). Previous research has found that supplementing sow diets with different n-3 fatty acid sources, such as fish oil (containing a large amount of EPA and DHA), increases the amount of n-3 PUFAs in the milk, which may increase piglets’ growth and improve their immune response (Rooke et al. Citation2001; Mateo et al. Citation2009; Luo et al. Citation2013).
Summarizing the results of several studies, the effects of n-3 PUFAs on the pre-weaning performance of piglets remain controversial (Roszkos et al. Citation2020a). Some researchers found an improvement in the performance parameters of current and subsequent parturition when sows were fed n-3 PUFA in the lactation diet (Mateo et al. Citation2009; Luo et al. Citation2013). However, others found no significant difference between pre-weaning growth and the mortality of piglets when sows were fed n-6 fatty acids (sunflower + soybean oil) or diets supplemented with n-3 fatty acids (fish oil) supplemented diets (Papadopoulos et al. Citation2009; Smits et al. Citation2011). A recent study found impaired litter birth weight and pre-weaning mortality when fed 1% salmon oil in gestation and lactation diets, compared to soy oil as a control supplement (McDermott et al. Citation2020). Further investigations and dose-dependent studies are needed in this field.
As pork production is an economically important factor in human nutrition, the impact of different n-3 PUFAs on swine performance has also been widely investigated. Ogłuszka et al. (Citation2020) tested the effect of ALA on the level of the telomere binding protein TRF1 in porcine skeletal muscle. Komprda et al. (Citation2020) examined the effect of fish oil on n-3 fatty acid content in pig tissues and on plasma biochemical parameters.
In addition to high n-3 fatty acid sources, the effects of other fat/oil types on the reproductive performance and milk composition of sows have been investigated. Peng et al. (Citation2019) found that dietary 2% soybean oil in the gestation diet did not markedly improve the performance of sows and their piglets, but advanced colostrum quality, prolactin concentration, intestinal morphology, and immunity of the piglets were observed. Feeding with 6,3 g/kg FO in lactation feed as an experimental diet significantly changed the fatty acid composition of sow milk and also had a positive impact on reproduction in a preliminary study by Roszkos et al. (Citation2020b).
Changes in the feeding of sows may affect not only the composition but also the organoleptic properties of the produced milk, as reported in the case of bovine milk (Urbach Citation1990; Let et al. Citation2005; Palmquist Citation2009; Tóth et al. Citation2019). Therefore, it is reasonable to analyze the aroma-altering effect of feed supplementation in milk. The artificial nose method is based initially on gas sensors, and was first proposed by Persaud and Dodd (Citation1982), who defined the electronic nose (EN) as capable of recognizing simpler and more complex odours. Its name originates from a comparison of the mammalian olfactory system: it detects and translates smell into electronic signals and sends the signals to a computer, which analyzes the data and generates an appropriate response. In practice, the most frequently used EN systems use metal oxide semiconductor (MOS) sensors, which absorb certain gas or vapour molecules on their surface, while changing the electrical resistance as the response signal. Commonly used sensors include quartz crystal sensors and conductive polymers. By selecting several different sensors for different materials, forming a sensor array, the signal sequence from the sensors can contain information on the composition of the tested gas or steam (Aouadi et al. Citation2020). The desired information from the samples is extracted from the signal sequence of the sensor array using a learning (training) process based on complex mathematical-statistical modeling, performed on samples of known composition or group identity (Zaukuu et al. Citation2020). Owing to the development of gas chromatography (GC), EN devices operating on the ultra-fast GC principle are also available. In contrast to the previously mentioned technologies that give an overall smell fingerprint but provide little chance to identify the exact odorant molecules, the GC-based EN systems make it possible to identify the volatile molecules that cause odours by using an appropriate database (Kovacs et al. Citation2020).
MOS sensor array-based EN technology was used to determine the effect of feed supplementation of dairy cows on the sensory properties of milk (Tóth et al. Citation2019). The authors found that feeding extruded linseed meal and fish oil changed the volatile profile of bovine milk samples, and the change was described using the EN system. Based on EN measurements, Falchero et al. (Citation2009) presented a perfect classification of Alpine bovine milk according to two vegetation types, while Amari et al. (Citation2009) described odour differences in cow milk originating from different farms and stored for different times.
The objective of this study was to investigate the effects of different proportions of n-6 and n-3 PUFA supplementation (sunflower oil, SO, and FO) at a practically important low dose (< 1%) on the fatty acid composition and chemical composition of highly proliferative modern sow’s milk. Since there is no existing report on the effect of different n-6 and n-3 PUFA supplementation on the volatiles of sow’s milk, another objective of this study was to examine the efficacy of the electronic nose in differentiating the milk of sows fed diets supplemented with sunflower oil (SO) or fish oil (FO) during the lactation period.
2. Materials and methods
The experimental protocol for animal protection complied with the European Union regulations (EU Directive 2010/63/EU). Ethics approval for our study was issued by the National Scientific Ethical Committee on Animal Experimentation, Hungary (approval number PE/EA/872-8/2020).
2.1. Animals and experimental conditions
The trial was conducted with two replications at a large-scale swine farm in Hungary. In the farrowing rooms, we randomly divided the animals in the given batch into two groups and selected by different parameters. We used the following criteria to select animals: (1) only 2nd to 4th parity sows; (2) at least 15 live-born piglets in the current and most recent farrowing; (3) a maximum of three dead born and one mummified piglets in the current and most recent farrowing.
In the first replication, two groups of 15 animals were selected as the control and experimental groups, from which six and five sows could be milked, respectively. The remaining sows did not intend to produce milk even after oxytocin injection. In the second replication, two groups of 11 animals were selected as the control and experimental groups, from which six and seven sows could be milked for the reasons mentioned above. In both replications, the data of 12 control and 12 experimental sows were evaluated.
The control and experimental animals were maintained under the same conditions. The experiment started at approximately 110–114 days of gestation and ended when the piglets were weaned. The sows were fed according to feeding curves (Big-Dutchman feeders; Big Dutchman International GmbH, Germany) during lactation, and had free access to drinking water. Five days before parturition, the sows were fed individually with two units of lactation feed. One unit of lactating feed was equivalent to 0.916 kg. On the day of parturition, the sows were not fed. From the 1st to the 3rd day of lactation, the sows received 2.0, 2.1 and 2.2 units of feed per day, respectively. From the 4th day, lactation feed was offered (4.4 units), and this was increased by 0.4 units per day until it reached the maximal 12 units per day.
2.2. Dietary treatments
The lactation diet was based on a corn-barley–soybean meal. The composition and calculated analytical values of the diets were provided by the farm (). The given values were also monitored using analytical examinations. The experimental feed was supplemented with FO at an inclusion rate of 6.3 g/kg feed, while the control group received SO at the same inclusion rate. The original oil sources (SO, FO) were taken onto an inorganic carrier (silicon dioxide) at a proportion of 63% and 37%, respectively, and a sufficient amount of supplements was manufactured by one pass before transporting to the farm. The farm has its own mixer facility, so control and experimental supplements were mixed into the lactation feeds by every manufacturing process during the trial. As FO and SO have almost the same energy content and were used at the same inclusion rate, the diets can be considered isocaloric. The fatty acid content of the diets was analyzed from the adequately collected feed samples. Multiple samples were taken from animal feeders and merged for examination. The ratio of n-6:n-3 fatty acids displayed a notable difference (15.08 vs. 7.38%) between the control and experimental diets ().
Table 1. Composition, calculated nutrient, and analysed fatty acid content of the control and the experimental diets.
2.3. Data and sample collection
In the experiment, two to four parity sows were used. The average parity in both groups was 3.17 ± 0.83.
On an average of 13.92 ± 2.91 days of lactation in the control and 12.38 ± 1.48 days in the experimental group, 20–25 mL of milk samples were collected. First, the piglets were separated from their mothers after suckling. One hour later, 10 IU oxytocin was injected intramuscularly (IM) to sows and then they were hand-milked (Noblet and Etienne Citation1989).
Milk samples were stored at 4°C until EN measurements were performed within 24 h after milking. The milk samples preserved for chemical analysis were stored at −20°C and thawed before analysis.
2.4. Chemical analysis
The dry matter, fat, and protein content of milk samples were analyzed according to the Association of Official Analytical Chemists (AOAC Citation2006). The chemical composition of the control and experimental lactation diets (dry matter, crude protein, ether extract, crude fibre, and ash) was determined by proximate analysis (AOAC Citation2006).
The method of the fatty acid composition of feed and milk samples: one gram of feed or 1 mL of milk sample was hydrolyzed with the addition of 40 mL of methanol and 6 mL of NaOH 50% solution, and 1.6 mL of inner standard (500 mg nonadecaenoic acid/100 mL toluene and isopropanol 2:1) at 80°C for 60 min. After chilling, the lipids were extracted with chloroform, and the tubes were evaporated. Fatty acid methyl esters were prepared with 14% boron trifluoride/methanol solution, and hexane (4 mL) was added. The tube was then vortexed, and approximately 1 mL of the upper phase containing the methyl esters was stored in an amber-colored glass bottle and stored at −18°C for later analyses. Analyses of fatty acid methyl esters (FAMEs) were conducted using a gas chromatograph (GCMS-QP2010 SE; Shimadzu, S.A., Kyoto, Japan), and the components of the methyl esters were separated in a BPX70 capillary column (30 m × 0.25 mm × 0.25 µm) (Phenomenex, Torrance, CA, USA). GC-MS analysis was performed as follows: injection temperature, 220°C; injection mode, split; flow control mode, linear velocity; gas, helium; pressure, 60.1 kPa; total flow, 45.4 mL/min; column flow, 1.03 mL/min; linear velocity, 37.1 cm/s; purge flow, 3 mL/min; split ratio, 40.
2.5. Electronic nose measurements
The odour of milk samples (n = 24) was measured in three replicates within 24 h of milk collection. For the odour measurement of the sample, three samples (1 mL each) were placed into 20 mL headspace vials and sealed with a magnetic cap and an UltraCleanTM polytetrafluoroethylene/silicone septum (Supelco, Inc., Merck KGaA, Darmstadt, Germany). EN measurements of the SO and FO samples were performed identically. The EN measurement was performed with a Heracles Neo 300 ultra-fast GC analyzer (Alpha MOS, Toulouse, France), specifically designed for the rapid analysis of volatile compounds. The system was equipped with a PAL-RSI autosampler unit (CTC Analytics AG, Zwingen, Switzerland) for standard handling of the samples, generating headspace and injecting the headspace into the Heracles analyzer unit, including an odour concentrator trap and two metal capillary columns: (1) Restek MXT-5: length 10 m, ID 0.18 mm, thickness: 0.40 μm, low-polarity stationary phase composed of cross bond 5% diphenyl/95% dimethyl polysiloxane (Restek, Co., Bellefonte, PA, USA); (2) Restek MXT-1701: length 10 m, ID 0.18 mm, thickness: 0.40 μm, mid-polarity stationary phase composed of cross bond 14% cyanopropylphenyl/86% dimethyl polysiloxane (Restek, Co., Bellefonte, PA, USA). The volatile compounds were separated by both columns simultaneously and detected using two flame ionization detectors (FIDs). The autosampler and analyzer were operated using AlphaSoft ver. 16 (Alpha MOS, Toulouse, France). The same software was used for the data acquisition and transformation. The retention times of the volatiles were recorded in both columns. Retention times were converted into retention indices (RIs). The Kovats RI relates the retention time of the investigated volatile molecules of a sample to the retention time of n-alkanes under the same conditions (Alpha and Manual Citation2018). The RI characterizes the volatile compounds on the specific columns and can be assigned to specific aromas recorded in the AroChemBase v7 of AlphaSoft software. Throughout this manuscript, ‘1-A’ as an identifier after the RI refers to column MXT-5, and ‘2-A’ for column MXT-1701. Before the analysis, a method was created with the following parameters of the PAL-RSI Autosampler and Heracles GC analyzer: (1) Autosampler: incubation at 50°C for 5 min with 500 rpm agitation to generate headspace, 5 mL of headspace injected into the Heracles analyzer, flushing time between injections: 90 s; (2) Analyzer: carrier gas: hydrogen, the flow of carrier gas: 30 mL/min, trapping temperature: 40°C, initial oven temperature: 50°C, the endpoint of oven temperature: 250°C, heating rate: 2°C/s, acquisition duration: 110 s, acquisition period: 0.01 s, injection speed: 125 μL/s, cleaning phase: 8 min.
2.6. Statistical analysis
Data of the dietary treatments and the chemicals were analyzed using the Kolmogorov–Smirnov test, Levene test, and independent-samples t-test or Mann–Whitney U-test (SPSS 26.0., IBM, Armonk, NY, USA). In all procedures, the significance level was set at P ≤ 0.05.
The multivariate data of the EN measurements describing the odour profiles of the milk samples were analyzed using AlphaSoft (ver. 16) software. The chromatograms were transformed into a series of variables called sensors based on the identified chromatogram peaks (Kovacs et al. Citation2020). The name of a sensor originated from the location of the peak within the chromatogram and was identical to the respective RI. The intensity of the sensor was calculated from the area under the respective chromatogram peaks. PCA was performed using the sensor data to detect outlier records and to describe the unsupervised clustering of the samples within the multidimensional space defined by the sensor variables (Naes et al. Citation2002). The PCA models were characterized by the discrimination index (%) between the classified groups, where positive values indicate group separations without overlapping on the examined plane of principal components. Supervised classification models were built using linear discriminant analysis (LDA) to find linear combinations of the sensor variables, optimally discriminating against predefined groups (Naes et al. Citation2002). The accuracy of the classification models was tested with leave-one-out cross-validation, when a single record was left out of the modeling process and was used for testing by predicting its group identity; this process was repeated iteratively until all samples had been used for validation once (Naes et al. Citation2002). The cross-validations were evaluated based on the validation score, which represents the ratio of correctly classified samples. The sensor selection function of AlphaSoft was used to identify the most distinctive variables that showed the greatest capability to identify the predefined groups. LDA calculations based on the selected sensors were also performed, and the impact of the sensors was evaluated based on their orientations in the PCA and LDA bi-plots. The volatile compounds described by the selected sensors were identified using the AroChemBase database.
3. Results
3.1. Fatty acid content of milk
Sunflower oil and fish oil supplementation changed the fatty acid composition of the feeds and, hence, the fatty acid profile of the milk (). FO supplementation reduced the amount of lauric acid (C12:0) (p < 0.1) and increased CLA (c9,t11) (p < 0.09) in milk. Supplementation with SO enhanced the amount of LA (C18:2) (8.43 mg/mL vs. 6.63. mg/mL milk) and significantly increased (p < 0.02) the amount of PUFAs (9.92 mg/mL vs. 8.61 mg/mL milk) in the milk of control sows. In contrast, sows that received FO had significantly higher EPA (C20:5), DPA (C22:5), and DHA (C22:6) content in the milk (p < 0.001). The amount of n-3 PUFAs in the control milk samples was 0.69 mg/mL, while it was 1.17 mg/mL in the experimental milk samples (p < 0.001).
Table 2. Fatty acid composition of the control and the experimental sows’ milk.
The n-6:n-3 ratio was 15.08 in the control lactation feed (), which led to a ratio of 13.42 in the milk of the control group. In the experimental lactation feed, this ratio was 7.38, which resulted in a ratio of 6.35.
3.2. Chemical composition of milk
The results showed that FO supplementation had a significant effect on the fatty acid profile of milk, enhancing its n-3 fatty acid content. However, the dry matter, protein, and fat content of the milk were not affected by supplementation with FO or SO ().
Table 3. The chemical composition of the control and the experimental milk samples.
3.3. Odour profiles of milk measured with an electronic nose
All the recorded EN data were merged into a single database file. During the data transformation, 130 sensors were identified. PCA was performed using the entire database to identify the outliers. All replicates of four samples were excluded from the classification analyses because they were extreme outliers in the PCA of the general EN database. These samples may have been contaminated during milking, causing a distinct off-odour that was highly different from the rest of the sample set. In addition, three single replicates were excluded as outliers for the individual samples. Therefore, the electronic nose data of 57 samples were analyzed.
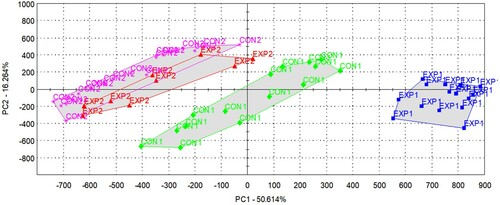
shows the score plot of the PCA by employing the data of all sensors. Both the experimental and control groups formed two subgroups according to the sampling dates, and there was no clear separation of the treatment groups either along the first principal component (PC1) or along PC2.
Figure 1. PCA score plot of milk samples based on the odour profiles described by all sensors, indicating the four groups of samples (CON1: control, 1st sampling, green diamond; CON2: control, 2nd sampling, pink star; EXP1: experimental, 1st sampling, blue square; EXP2: experimental, 2nd sampling, red triangle).
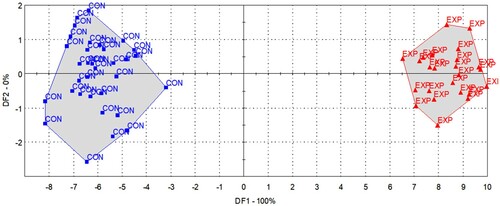
In the case of supervised classification, the LDA model found a difference in the odour patterns, based on which the differently fed groups showed a significant difference, and a hit rate of 93% was achieved during cross-validation (). A large number of sensors may cause severe over-fitting; thus, reduction of dimensions was carried out by selecting the most relevant sensors for the discrimination of the feeding groups.
Figure 2. LDA results for the discrimination of the control (CON, blue square) and experimental (EXP, red triangle) milk samples based on the odour profiles described by all sensors.
Five dominant sensors were identified by the sensor selection algorithm of AlphaSoft, and the selection was optimized to detect differences between the control and experimental groups. The selected dominant sensors were 666.66-1-A, 463.61-2-A, 510.56-2-A, 566.26-2-A, and 1117.47-2-A. The spider plot in shows the intensity values of the individual samples obtained from each sensor.
Figure 3. Spider plot of the electronic nose (EN) data of the control (blue) and experimental (red) milk samples on the plane defined by the five selected sensors, indicating the names of the sensors (retention index and column type) on the angle, and intensity values (area under the chromatogram peak at the respective retention index) along the radius.
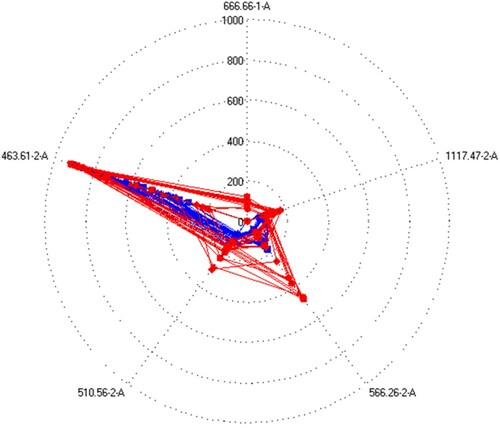
Based on the t-test, sensors 666.66-1-A, 510.56-2-A, 566.26-2-A, and 1117.47-2-A showed significant (p < 0.05) differences according to the feeding groups (SO vs. FO), but none of these sensors were clear discriminators.
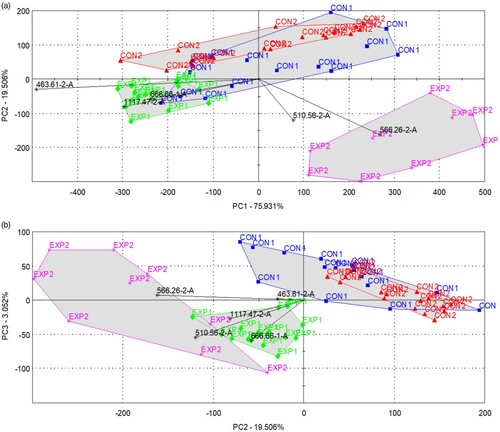
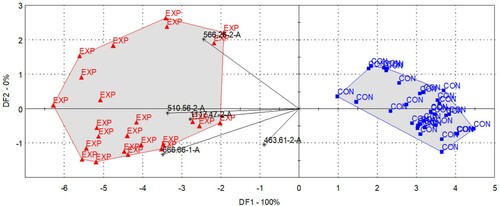
The PCA results obtained using the five dominant sensors are shown in . Although it was not possible to identify the treatment groups based on the individual sensor signals, the linear combinations of the signals were good discriminators. In (a), the clustering of the samples is shown in the plane described by PC1 and PC2 with the indication of the treatment and sampling groups, while in (b), the clustering is shown in the planes of PC2 and PC3. There is a definite difference between the control and experimental groups in the plane defined by the 2nd and 3rd principal components. When the discrimination index was calculated with the two treatments alone, a value of +28 was obtained, indicating the non-overlapping separation of the control and experimental groups. A clear separation by treatment was also observed in (b). In addition to the PCA score plots, (a,b) indicate the loading vectors. As the loadings of (b) point towards the experimental groups, the volatile compounds influencing the selected sensors were more dominant in the experimental milk samples and less dominant in the control samples.
Figure 4. Bi-plots showing the loading vectors and the score plots of milk samples (CON1: control, 1st sampling, blue square; CON2: control, 2nd sampling, red triangle; EXP1: experimental, 1st sampling, green diamond; EXP2: experimental, 2nd sampling, pink star) in the plane of (a) PC1-PC2 and (b) PC2-PC3 when the PCA was performed with data from five selected sensors.
Supervised classification was repeated using the selected sensors. The results of the LDA model are shown in . The hit rate of the cross-validation improved and reached 98% of the correctly classified cases. The loadings again showed that, in all the selected sensors, the experimental group was dominant.
Figure 5. Bi-plot showing the LDA results for the discrimination of the control (CON, blue square) and experimental (EXP, red triangle) milk samples based on the odour profiles described by five selected sensors, and the loading vectors representing the dominance of the sensors.
4. Discussion
4.1. Fatty acid groups of milk
Animals with epitheliochorial placenta-like pigs have relatively less permeability to fatty acids (Battaglia and Meschia Citation1988) than those with hemochorial placenta, where LA, ALA, and long-chain PUFAs are transported by a series of placental fatty acid-binding and fatty acid-transfer proteins (Koletzko et al. Citation2007). For this reason, long-chain PUFA supplementation in piglets must mainly occur via the sow’s milk.
During digestion, the majority of absorbed fatty acids are incorporated into triglycerides or phospholipids and transported from the intestine to peripheral tissues in triglyceride-rich lipoproteins such as chylomicrons and very low-density lipoproteins (VLDL). Triglycerides of chylomicra and VLDL are taken up by the mammary gland by the action of lipoprotein lipase (LPL) (Palmquist and Mattos Citation1978), but LPL seems to be less active in long-chain PUFAs, most likely because they are transported mainly in phospholipids (Rymer et al. Citation2003).
Conversions of shorter to longer chain PUFAs are mediated by microsomal desaturases and chain-elongation enzymes. The conversion rates of longer-chain PUFAs from precursors are determined by the amount of substrate and enzymes available for conversion (Sprecher Citation2000). Previous research found a very low conversion rate of ALA to EPA or DHA (Palmquist Citation2009), indicating the importance of n-3 PUFA sources used in sow feed.
The amount of SFAs and MUFAs in the milk samples was unaffected by the treatments. Sows that received FO supplemented diet had a higher amount of PUFAs in their milk, except for LA, which was significantly lower. In contrast, EPA, DPA, and DHA levels were significantly (p < 0.001) higher in the milk of the experimental group. These results are similar to those of Lauridsen and Danielsen (Citation2004) and Lauridsen and Jensen (Citation2007), who used the same oil sources, but at an 8% inclusion rate, and Jin et al. (Citation2017), who used a fed comprised of 4.1% palm oil, 3.9% FO, and 3.8% soybean oil. The observations of Lavery et al. (Citation2019) are also consistent with our findings. These scientists fed soya and salmon oil to PIC F1 (Landrace × Large White) sows in two experimental groups. Offering a diet for sows containing salmon oil increased the proportions of EPA, DPA, and DHA (p < 0.001) and decreased the proportion of LA (p < 0.001) compared to other treatments. Luo et al. (Citation2019) also arrived at the same conclusion. In their work, the proportion of n-6 PUFAs was lower, while the proportion of n-3 PUFAs was higher (p < 0.001) in the milk of the fish oil supplemented group than in the soy oil supplemented group (p < 0.001). They found that fish oil decreased the proportions of LA (p < 0.001) and ARA (p < 0.001), but increased the proportion of EPA (p < 0.001), DPA (p < 0.001), and DHA (p < 0.001) in milk.
In an experiment with Norwegian Landrace sows fed a diet supplemented with 50 mL of cod liver oil per day, Taugbøl et al. (Citation1993) found a significant increase in EPA and DHA compared to the milk of control sows on day 14 of lactation. An experiment conducted by Fritsche et al. (Citation1993) found that menhaden fish oil (MFO) significantly increased the content of n-3 PUFAs in the blood serum and milk of crossbred (Landrace × Duroc) sows, but decreased the levels of ARA, when MFO was used to substitute lard for 3.5% and 7% of the diet. In another study, when conjugated linoleic acid (CLA) was administered to Landrace × Large White 3–4 parity sows at a dose of 10 g/kg into late gestation and lactation feed against a negative control, researchers found that dietary CLA increased the concentration of SFAs and CLAs (c9t11 and t10,c12), but decreased that of MUFAs in the milk samples collected on day 23 of lactation (Cordero et al. Citation2011). The same scientists found that dietary CLA positively influences the proportion of EPA as an n-3 fatty acid.
4.2. Relationship between n-6:n-3 ratios of feed and milk
In our study, in accordance with data from the literature, we found a strong relationship between the fatty acid composition of the sow diet and that of milk. The n-6:n-3 ratio of the control lactation feed was 15.08, which resulted in a ratio of 13.42 in the milk. This ratio in the experimental lactation compound feed was 7.38, which caused a 6.35 n-6:n-3 ratio in the milk. These results are in agreement with our former results, where the n-6:n-3 ratio in the milk was 13.82 vs. 5.89 in the control and experimental groups with the same supplementation (0.63% SO and 0.63% FO) (Roszkos et al. Citation2020b). Lauridsen and Danielsen (Citation2004) investigated the effects of sunflower oil, soybean oil, rapeseed oil, fish oil, coconut oil, and animal fat on the fatty acid profile of milk of Danish Landrace × Yorkshire sows, and observed that 8% SO supplementation caused a 12.4 n-6:n-3 fatty acid ratio in the milk. The same inclusion rate of FO led to a 1.95 n-6:n-3 ratio. Yao et al. (Citation2012) also found a strong correlation between the n-6:n-3 ratio of dietary treatments and the milk of Landrace sows. As the n-6:n-3 PUFA ratio (amount of n-3 PUFA and α-linolenic acid decreased) increased in the diets (3:1, 9:1, 13:1), the n-6:n-3 PUFA ratio of the milk was also enhanced (3.21, 10.33, 11.48.). Eastwood et al. (Citation2014) also found a very similar relationship between the fatty acid profile of diets and colostrum of sows, but noted a lower n-6:n-3 ratio in the colostrum than in the diets. The n-6:n-3 ratios of 9:1, 5:1, and 1:1 in plant-based diets provided colostrum profiles of 5:1, 4:1, and 1:1, respectively. In a recent study, it was also observed that dietary treatments supplemented with four different LA:ALA ratios (a special mixture of canola, corn, or flaxseed oil), at 15.3, 5.1, 20.7, and 6.9, changed the n-6:n-3 ratio of the milk in a very similar way to 15, 5, 23, and 9 (Rosero et al. Citation2015). Gunnarsson et al. (Citation2009) also reported that feeding linseed oil (10 g/kg feed), which is rich in ALA (C18:3, n-3), modified the n-6:n-3 ratio of the diet from 11.04 (control) to 1.95 in the experimental group.
As different types of fatty acids in feed are excreted into milk with high efficiency, even a fat source such as soybean oil, which is undoubtedly rich in n-6 fatty acids, can decrease the n-6:n-3 fatty acid ratio in the milk of sows. In another study, 3% coconut oil, palm oil, or soybean oil were included in the lactation feed of Landrace × Large white multiparous sows from day 107 of gestation to day 21 of lactation. On day 11 of lactation, the n-6:n-3 ratio of milk was the smallest in the soybean oil group, compared to the coconut and palm oil groups (13 vs. 15.5% vs. 15%) (Bai et al. Citation2017).
4.3. Milk composition
The dietary treatments (SO and FO) in our investigation did not affect the milk composition of sows, similar to the findings of Grez et al. (Citation2016) and Lauridsen and Danielsen (Citation2004). Laws et al. (Citation2009) also observed the same when feeding commercial genotype sows with FO and other oil sources (palm oil, olive oil, SO) at a rate of 10% energy surplus in the diet. In a study by Cordero et al. (Citation2011), 10 g/kg dietary CLA supplementation resulted in a lower concentration of fat in the milk of sows compared to the negative control (45.8 vs. 53 g fat/kg milk).
4.4. Amount of used fat sources
The aim of this study was to investigate the effect of different proportions of n-6 and n-3 PUFA supplementation (SO, FO) at a practically important low dose (0.63% each) during lactation on the fatty acid composition and odour profile of modern sow’s milk. In previous studies, 8% (Lauridsen and Danielsen Citation2004; Lauridsen and Jensen Citation2007), 3.8–4.1% (Jin et al. Citation2017) and 3.5% (Luo et al. Citation2019) from a different type of plant or animal fat source (e.g. sunflower oil, soybean oil, rapeseed oil, fish oil, coconut oil, and animal fat) have been used to investigate the effect of fat sources on the fatty acid composition of milk. In the presented study, we proved that even a low dose of fat supplement in the diets could be detected in the fatty acid profile and the odour profile of sow milk.
4.5. Odour profile of milk
The milk samples collected from the differently fed individuals were well separated according to the feeding groups, based on the odour profile described by the EN. The fact that there is a clear separation between the experimental and control groups, even with an unsupervised classification method (PCA), indicates the significant effect of feeding on the odour profile of milk. The selected sensors that played dominant roles in the discrimination of the treatment groups were more characteristic in the experimental group, indicating that the volatile substances described by the respective retention indices were in larger amounts within the experimental samples. lists the identified chemicals that influence the sensor signals and summarizes the associated attributes of the chemicals.
Table 4. Assignment of the retention indices corresponding to the five selected sensors.
Kang et al. (Citation2014) examined volatile compounds in bovine milk using an EN system equipped with GC-MS, and among 30 volatile compounds, including aldehyde, 2, 2, 3-trimethyl-3-oxetanol, 1-pentanol, 1-hexanol, 3-methyl-1-butanol, 1-octanol, 4-methyl-1-penten-3, butyric acid, benzoic acid, and heptanoic acid. They also found 3-methyl butanol in off-flavored milk. The authors identified five volatile compounds that could cause rancidity in milk; one of these was acetaldehyde, while the others were 1-hexanol, 1-pentanol, and butyric and heptatonic acid.
Malonaldehyde is the most abundant peroxidation product of LC-PUFAs, notably in those with more than two double bonds (Bird and Draper Citation1984; Esterbauer et al. Citation1991). Therefore, the lipid precursors for malonaldehyde in vivo are mainly ARA and DHA (Esterbauer et al. Citation1991). Acetaldehyde is a product of malondialdehyde metabolism by mitochondrial aldehyde dehydrogenase, which is formed through the peroxidation of PUFAs (Siu and Draper Citation1982). Since long-chain polyunsaturated n-3 fatty acids are highly susceptible to oxidation (Yin et al. Citation2011), their presence may have increased lipid peroxidation (Hammer and Wills Citation1978), and consequently, malondialdehyde acetaldehyde formation, of which the latter appeared in the recorded odour profiles. In addition to lactic acid, acetaldehyde is also a major component of milk fermentation (Gutiérrez-Méndez et al. Citation2008; Liu et al. Citation2016) that could occur during the short storage of the sow milk samples collected in a non-sterile environment.
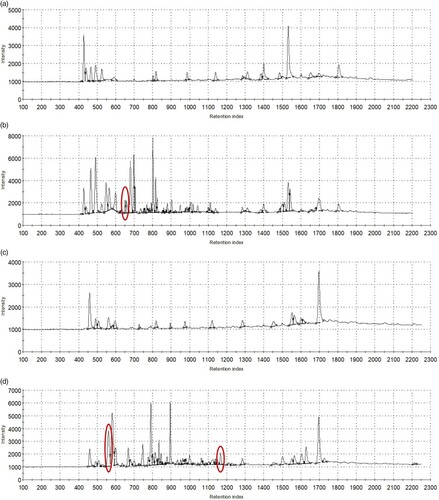
shows the chromatograms of the added SO and FO, measured using the same EN device used for the milk measurements. The odour fingerprints of the oils highlight the considerable differences in their volatile compounds. According to the peak annotations, FO has peaks at retention indices of 666 on column 1-A (MXT-5), 566, and 1117 on column 2-A (MXT-1701), and these peaks significantly exceed those of SO. These retention indices were also identified in EXP milk samples. This draws attention to the possibility that the related odorants, appearing in both the added oil (FO) and the sow milk (EXP), can pass through the sows’ metabolic system and appear in the milk as a direct result of feeding.
Figure 6. The chromatograms of sunflower oil (a,c) and fish oil (b,d) recorded using GC columns MXT-5 (a,b) and MXT-1701 (c,d), with the indications (red circles) of peaks specific for fish oil appearing in EXP milk samples (retention index 666 on column 1-A, 566 and 1117 on column 2-A, refer to for assignment).
5. Conclusions
Feeding sows with LC-PUFAs affects the fatty acid profile of their milk. FO, used at a low dietary inclusion rate (0.63%) in maize-soybean meal-based lactating sow feed, increased the amount of physiologically important n-3 fatty acids in sow milk. The reduction of the n-6:n-3 ratio in milk shows that dietary n-3 fatty acids can be successfully transferred to the milk and then utilized in the body of piglets for advantageous physiological purposes. The benefits of practically low FO doses (<1%) should be evaluated in further experiments on the performance parameters of sows and their piglets. FO supplementation compared to SO caused a distinguishable change in the odour profile of sow milk recorded with EN. The reason for this could be that FO contains more double-bonded LC-PUFAs, which are more susceptible to oxidation, and the acetaldehyde that is formed may cause this effect.
Since the feeding of LC-PUFAs, even at a normal dietary dose, has a detectable impact on the aroma of the milk of sows, it is important to investigate its effect not only on the performance (production parameters) of piglets, but also on the feeding habits (e.g. sow’s milk consumption). These investigative studies may include preference tests with sows and piglets, in which EN technologies as supplementary methods may also have potential.
Conflicts of interest
The authors state that there are no conflicts of interest.
Disclosure statement
No potential conflict of interest was reported by the author(s).
Data availability statement
The data presented in this study are available upon request from the corresponding author.
Additional information
Funding
References
- Alpha MOS, Manual H. 2018. [cited 25 Oct 2020]. Available from: https://www.alpha-mos.com/heracles-smell-analysis. Toulouse, France: Alpha MOS; p. 1–163.
- Amari A, El Bari N, Bouchikhi B. 2009. Conception and development of a portable electronic nose system for classification of raw milk using principal component analysis approach. Sens Transducers. 102:33–44. [cited 25 Oct 2020]. Available from: http://www.sensorsportal.com.
- Aouadi B, Zaukuu J-LZ, Vitális F, Bodor Z, Fehér O, Gillay Z, Bazar G, Kovacs Z. 2020. Historical evolution and food control achievements of near infrared spectroscopy, electronic nose, and electronic tongue-critical overview. Sensors (Basel. 20(19):5479. doi:10.3390/s20195479.
- Association of Official Analytical Chemists. 2006. Official methods of analysis, 18th ed. Washington, DC: AOAC.
- Bai YS, Wang CQ, Zhao X, Shi BM, Shan AS. 2017. Effects of fat sources in sow on the fatty acid profiles and fat globule size of milk and immunoglobulins of sows and piglets. Anim Feed Sci Technol. 234:217–227. doi:10.1016/j.anifeedsci.2017.10.006.
- Battaglia FC, Meschia G. 1988. Fetal nutrition. Annu Rev Nutr. 8:43–61.
- Bird RP, Draper HH. 1984. Comparative studies on different methods of malonaldehyde determination. Methods Enzymol. 105:299–305. doi:10.1016/s0076-6879(84)05038-2.
- Cordero G, Isabel B, Morales J, Menoyo D, Piñeiro C, Daza A, Lopez-Bote CJ. 2011. Conjugated linoleic acid (CLA) during last week of gestation and lactation alters colostrum and milk fat composition and performance of reproductive sows. Anim Feed Sci Technol. 168:232–240. doi:10.1016/j.anifeedsci.2011.04.085.
- De Tonnac A, Karim-Luisset S, Mourot J. 2017. Effect of different dietary linseed sources on fatty acid composition in pig tissues. Livest Sci. 203:124–131. doi:10.1016/j.livsci.2017.03.022.
- Di Pasquale MG. 2009. The essentials of essential fatty acids. J Diet Suppl. 6:143–161. doi:10.1080/19390210902861841.
- Eastwood L, Leterme P, Beaulieu AD. 2014. Changing the omega-6 to omega-3 fatty acid ratio in sow diets alters serum, colostrum, and milk fatty acid profiles, but has minimal impact on reproductive performance. J Anim Sci. 92:5567–5582. doi:10.2527/jas.2014-7836.
- Esterbauer H, Schaur RJ, Zollner H. 1991. Chemistry and biochemistry of 4-hydroxynonenal, malonaldehyde and related aldehydes. Free Radic Biol Med. 11:81–128. doi:10.1016/0891-5849(91)90192-6.
- Falchero L, Sala G, Gorlier A, Lombardi G, Lonati M, Masoero G. 2009. Electronic nose analysis of milk from cows grazing on two different Alpine vegetation types. J Dairy Res. 76:365–371. doi:10.1017/S0022029909004105.
- Fritsche KL, Huang SC, Cassity NA. 1993. Enrichment of omega-3 fatty acids in suckling pigs by maternal dietary fish oil supplementation. J Anim Sci. 71:1841–1847. doi:10.2527/1993.7171841x.
- Greenberg JA, Bell SJ, Van Ausdal WV. 2008. Omega-3 fatty acid supplementation during pregnancy. Rev Obstet Gynecol. 1:162–169.
- Grez M, Gandarillas M, González F, Vargas-Bello-Pérez M. 2016. Influence of a spray-dried fat enriched with EPA and DHA on the fatty acid composition of sow milk. Cienc Investig Agr. 43:347–355. doi:10.4067/S0718-16202016000300001.
- Gunnarsson S, Pickova J, Högberg A, Neil M, Wichman A, Wigren I, Uvnäs-Moberg K, Rydhmer L. 2009. Influence of sow dietary fatty acid composition on the behaviour of the piglets. Livest Sci. 123:306–313. doi:10.1016/j.livsci.2008.12.002.
- Gutiérrez-Méndez N, Vallejo-Cordoba B, Gonzalez-Córdova AF, Nevárez-Moorillón GV, Rivera-Chavira B. 2008. Evaluation of aroma generation of lactococcus lactis with an electronic nose and sensory analysis. J Dairy Sci. 91:49–57. doi:10.3168/jds.2007-0193.
- Hammer CT, Wills ED. 1978. The role of lipid components of the diet in the regulation of the fatty acid composition of the rat liver endoplasmic reticulum and lipid peroxidation. Biochem J. 174:585–593.
- Jin C, Fang Z, Lin Y, Che L, Wu C, Xu S, Feng B, Li J, Wu D. 2017. Influence of dietary fat source on sow and litter performance, colostrum and milk fatty acid profile in late gestation and lactation. Anim Sci J. 88:1768–1778. doi:10.1111/asj.12836.
- Kang NK, Jun TS, Yang YS, Kim YS. 2014. Analysis of volatile flavor compounds in milk using electronic nose system. J Sens Sci Technol. 23:320–325. doi:10.5369/JSST.2014.23.5.320.
- Koletzko B, Larqué E, Demmelmair H. 2007. Placental transfer of long-chain polyunsaturated fatty acids (LC-PUFA). J Perinat Med. 35(Supplement 1):S5–11. doi:10/1515/JPM2007.030.
- Komprda T, Jůzl M, Matejovicová M, Levá L, Piechowiczová M, Nedomová Š, Popelková V, Vymazalová P. 2020. Effect of high dietary level (8%) of fish oil on long-chain polyunsaturated fatty acid n-3 content in pig tissues and plasma biochemical parameters. Animals (Basel). 10(9):1657. doi:10.3390/ani10091657.
- Kovacs Z, Bodor Z, Zinia Zaukuu JL, Kaszab T, Bazar G, Tóth T, Mohácsi-Farkas C. 2020. Electronic nose for monitoring odor changes of Lactobacillus species during milk fermentation and rapid selection of probiotic candidates. Foods. 9(11):1539. doi:10.3390/foods9111539.
- Lauridsen C, Danielsen V. 2004. Lactational dietary fat levels and sources influence milk composition and performance of sows and their progeny. Livest Prod Sci. 91:95–105. doi:10.1016/j.livprodsci.2004.07.014.
- Lauridsen C, Jensen SK. 2007. Lipid composition of lactational diets influences the fatty acid profile of the progeny before and after suckling. Animal. 1:952–962. doi:10.1017/S175173110700033X.
- Lavery A, Lawlor PG, Miller HM, Magowan E. 2019. The effect of dietary oil type and energy intake in lactating sows on the fatty acid profile of colostrum and milk, and piglet growth to weaning. Animals (Basel). 9(12):1092. doi:10.3390/ani9121092.
- Laws J, Amusquivar E, Laws A, Herrera E, Lean IJ, Dodds PF, Clarke L. 2009. Supplementation of sow diets with oil during gestation: Sow body condition, milk yield and milk composition. Livest Sci. 123:88–96. doi:10.1016/j.livsci.2008.10.012.
- Let MB, Jacobsen C, Meyer AS. 2005. Sensory stability and oxidation of fish oil enriched milk is affected by milk storage temperature and oil quality. Int Dairy J. 15:173–182. doi:10.1016/j.idairyj.2004.06.003.
- Liu W, Yu J, Sun Z, Song Y, Wang X, Wang H, Wuren T, Zha M, Menghe B, Heping Z. 2016. Relationships between functional genes in Lactobacillus delbrueckii ssp. bulgaricus isolates and phenotypic characteristics associated with fermentation time and flavor production in yogurt elucidated using multilocus sequence typing. J Dairy Sci. 99:89–103. doi:10.3168/jds.2015-10209.
- Luo J, Huang F, Xiao C, Fang Z, Peng J, Jiang S. 2013. Responses of growth performance and proinflammatory cytokines expression to fish oil supplementation in lactation sows’ and/or weaned piglets’ diets. BioMed Res Int. 2013:1-9. 905918. doi:10.1155/2013/905918.
- Luo W, Xu X, Luo Z, Yao J, Zhang J, Xu W, Xu J. 2019. Effect of fish oil supplementation in sow diet during late gestation and lactation period on litter characteristics, milk composition and fatty acid profile of sows and their offspring. Int J Anim Sci. 19:8–17. doi:10.1080/1828051X.2019.1685917.
- Mateo RD, Carroll JA, Hyun Y, Smith S, Kim SW. 2009. Effect of dietary supplementation of n-3 fatty acids and elevated concentrations of dietary protein on the performance of sows. J Anim Sci. 87:948–959. doi:10.2527/jas.2008-0964.
- McDermott K, Icely S, Jagger S, Broom LJ, Charman D, Evans CM, Miller HM. 2020. Supplementation with omega-3 polyunsaturated fatty acids and effects on reproductive performance of sows. Anim Feed Sci Technol. 267:114529. doi:10.1016/j.anifeedsci.2020.114529.
- Moran CA, Morlacchini M, Keegan JD, Fusconi G. 2018. Dietary supplementation of finishing pigs with the docosahexaenoic acid-rich microalgae, aurantiochytrium limacinum: effects on performance, carcass characteristics and tissue fatty acid profile. Asian-Australas J Anim Sci. 31:712–720. doi:10.5713/ajas.17.0662.
- Naes T, Isakson T, Fearn T, Davies T. 2002. A user-friendly guide to multivariate calibration and classification. Chichester, UK: NIR Publications.
- Noblet J, Etienne M. 1989. Estimation of sow milk nutrient output. J Anim Sci. 67:3352–3359.
- Nuernberg K, Fischer K, Nuernberg G, Kuechenmeister U, Klosowska D, Eliminowska-Wenda G, Fiedler I, Ender K. 2005. Effects of dietary olive and linseed oil on lipid composition, meat quality, sensory characteristics and muscle structure in pigs. Meat Sci. 70:63–74. doi:10.1016/j.meatsci.2004.12.001.
- Ogłuszka M, Te Pas MFWT, Poławska E, Nawrocka A, Stepanow K, Pierzchała M. 2020. Omega-3 alpha-linolenic fatty acid affects the level of telomere binding protein TRF1 in porcine skeletal muscle. Animals (Basel). 10(6):1090. doi:10.3390/ani10061090.
- Palmquist DL. 2009. Omega-3 fatty acids in metabolism, health, and nutrition and for modified animal product foods. Prof Anim Sci. 25:207–249. doi:10.15232/S1080-7446(15)30713-0.
- Palmquist DL, Mattos W. 1978. Turnover of lipoproteins and transfer to milk fat of dietary (1-carbon-14) linoleic acid in lactating cows. J Dairy Sci. 61:561–565.
- Papadopoulos GA, Maes DGD, Van Weyenberg S, van Kempen TATG, Buyse J, Janssens GPJ. 2009. Peripartal feeding strategy with different n-6:n-3 ratios in sows: effects on sows’ performance, inflammatory and periparturient metabolic parameters. Br J Nutr. 101:348–357. doi:10.1017/S0007114508026160.
- Peng X, Yan C, Hu L, Liu Y, Xu Q, Wang R, Qin L, Wu C, Fang Z, Lin Y, et al. 2019. Effects of fat supplementation during gestation on reproductive performance, milk composition of sows and intestinal development of their offspring. Animals (Basel). 9(4):125. doi:10.3390/ani9040125.
- Persaud K, Dodd G. 1982. Analysis of discrimination mechanisms in the mammalian olfactory system using a model nose. Nature. 299:352–355. doi:10.1038/299352a0.
- Petrone RC, Williams KA, Estienne MJ. 2019. Effects of dietary menhaden oil on growth and reproduction in gilts farrowed by sows that consumed diets containing menhaden oil during gestation and lactation. Animal. 13:1944–1951. doi:10.1017/S1751731119000193.
- Posser CJM, Almeida LM, Moreira F, Bianchi I, Gasperin BG, Lucia T. 2018. Supplementation of diets with omega-3 fatty acids from microalgae: effects on sow reproductive performance and metabolic parameters. Livest Sci. 207:59–62. doi:10.1016/j.livsci.2017.11.006.
- PubChem [Database]. 2020. [cited 25 Oct 2020]. Available from: https://pubchemdocs.ncbi.nlm.nih.gov/. Natl Cent Biotechnol Inf, US. Bethesda, MD: National Library of Medicine.
- Rooke JA, Sinclair AG, Ewen M. 2001. Changes in piglet tissue composition at birth in response to increasing maternal intake of long-chain n-3 polyunsaturated fatty acids are non-linear. Br J Nutr. 86:461–470. doi:10.1079/BJN2001422.
- Rosero DS, Odle J, Mendoza SM, Boyd RD, Fellner V, van Heugten E. 2015. Impact of dietary lipids on sow milk composition and balance of essential fatty acids during lactation in prolific sows. J Anim Sci. 93:2935–2947. doi:10.2527/jas.2014-8529.
- Roszkos R, Tóth T, Fébel H, Mézes M. 2020b. Effect of different n-6/n-3 fatty acid proportion oil sources on reproduction performance and fatty acid profile of milk in modern genotype sows - preliminary results. Acta Agrar Debr. 1:121–128. doi:10.34101/actaagrar/1/3742.
- Roszkos R, Tóth T, Mézes M. 2020a. Review: practical use of n-3 fatty acids to improve reproduction parameters in the context of modern sow nutrition. Animals (Basel). 10(7):1141. doi:10.3390/ani10071141.
- Rymer CD, Givens I, Wahle KWJ. 2003. Dietary strategies for increasing docosahexaenoic acid (DHA) and eicosapentaenoic acid (EPA) concentrations in bovine milk: A review. Nutr [Abstr]. Rev. B. 73:9–25.
- Sampels S, Pickova J, Högberg A, Neil M. 2011. Fatty acid transfer from sow to piglet differs for different polyunsaturated fatty acids (PUFA). Physiol Res. 60:113–124.
- Siu GM, Draper HH. 1982. Metabolism of malonaldehyde in vivo and in vitro. Lipids. 17:349–355. doi:10.1007/BF02535193.
- Smits RJ, Luxford BG, Mitchell M, Nottle MB. 2011. Sow litter size is increased in the subsequent parity when lactating sows are fed diets containing n-3 fatty acids from fish oil. J Anim Sci. 89:2731–2738. doi:10.2527/jas.2010-3593.
- Sprecher H. 2000. Metabolism of highly unsaturated n-3 and n-6 fatty acids. Biochim Biophys Acta. 1486:219–231. doi:10.1016/s1388-1981(00)00077-9.
- Tanghe S, Missotten J, Raes K, Vangeyte J, De Smet S. 2014. Diverse effects of linseed oil and fish oil in diets for sows on reproductive performance and pre-weaning growth of piglets. Livest Sci. 164:109–118. doi:10.1016/j.livsci.2014.03.009.
- Taugbøl O, Framstad T, Saarem K. 1993. Supplements of cod liver oil to lactating sows. influence on milk fatty acid composition and growth performance of piglets. Zentralbl Veterinarmed A. 40:437–443. doi:10.1111/j.1439-0442.1993.tb00650.x.
- Tóth T, Mwau PJ, Bázár G, Andrássy-Baka G, Hingyi H, Csavajda É, Varga L. 2019. Effect of feed supplementation based on extruded linseed meal and fish oil on composition and sensory properties of raw milk and ultra-high temperature treated milk. Int Dairy J. 99:104552. doi:10.1016/j.idairyj.2019.104552.
- Urbach G. 1990. Effect of feed on flavor in dairy foods. J Dairy Sci. 73:3639–3650. doi:10.3168/jds.S0022-0302(90)79067-4.
- Yao W, Li J, Wang JJ, Zhou W, Wang Q, Zhu R, Wang F, Thacker P. 2012. Effects of dietary ratio of n-6 to n-3 polyunsaturated fatty acids on immunoglobulins, cytokines, fatty acid composition, and performance of lactating sows and suckling piglets. J Anim Sci Biotechnol. 3(1):43. doi:10.1186/2049-1891-3-43.
- Yin H, Xu L, Porter NA. 2011. Free radical lipid peroxidation: mechanisms and analysis. Chem Rev. 111:5944–5972. doi:10.1021/cr200084z.
- Zaukuu JLZ, Bazar G, Gillay Z, Kovacs Z. 2020. Emerging trends of advanced sensor based instruments for meat, poultry and fish quality-A review. Crit Rev Food Sci Nutr. 60:3443–3460. doi:10.1080/10408398.2019.1691972.