
 ?Mathematical formulae have been encoded as MathML and are displayed in this HTML version using MathJax in order to improve their display. Uncheck the box to turn MathJax off. This feature requires Javascript. Click on a formula to zoom.
ABSTRACT
The study was carried out at Holetta agricultural Research center dairy farm to estimate the growth and dry matter intake curves parameters of different genetic groups of crossbred male calves. A total of 48 weaned Friesian Boran (FB) crossbred calves consisting of 24 male calves having 50% Friesian blood level and another 24 growing calves having 75% Friesian blood level were used for this study. The calves were managed under individual feeding management for a fattening period of 626 days. Body weight and dry matter intake data were fitted into Gompertz nonlinear growth model. Mean values for growth parameters in 50% FB and 75% FB crosses were 727.0 and 730.2 kg; 2.85 and 2.78; 0.0019 and 0.0017 kg/day; 547.95 and 595.68 days; 257.46 and 268.63 kg; for mature weight, integration constant, maturity rate, age at inflection point and body weight at inflection point, respectively. This study revealed that 50% FB crossbred bull calves are fast maturing genotype and had significantly lower DMI at mature age than 75% FB crosses. Generally, 50% FB crossbred bull calves can be used for fattening purpose to meet increasing lean meat demand of consumers in Ethiopia with decreased feed cost under improved feeding system.
Introduction
The growth patterns of various genetic groups of crossbred growing male calves from weaning to slaughtering age have substantial economic implication and greatly contribute to the cattle genetic improvement programs. Under the Ethiopian context, some scholars (Demeke et al. Citation2003; Effa et al. Citation2006) reported relative performances and genetic parameters of the early growth traits of indigenous breeds and their crosses with regard to birth weight (BW), weaning weight (WWT), six-month weight (SMWT), yearling weight (YWT). In addition, different research results documented on growth and meat production performance of crossbred breed male cattle in Ethiopia (Merera et al. Citation2004; Alemayehu et al. Citation2013; Shumye et al. Citation2021). These reports indicated that dairy farmers or producer could benefit from fattening young crossbred bulls.
The findings incorporating estimated growth and dry matter intake curve parameters have been evaluated for Friesian, Limousin x Friesian and Piedmontese x Friesian cattle to address the relationship between feed intake and body weight gain (Akbaş et al. Citation2006). However, as indicated earlier, in Ethiopia most of the available evidences on crossbred dairy cattle focus on the post-calving traits such as on productive and reproductive performances, except the research work done by (Shumye Citation2021) on growth curve analysis of growing crossbred female cattle using different nonlinear growth models such as Logistic, Gompertz, and Von Bertalanffy.
Feed intake should be measured to explain the growth of an animal. It is often a major cost in the fattening of animals and thus there is a need to improve the efficiency of its utilization (Arthur et al. Citation1998). A review by (Golze Citation2001) has generally concluded that a change in mature body weight has little effect on the biological efficiency of cattle fattening enterprise, because of the associated changes in other feeding and growth parameters. In this study, we hypothesized that there may be apparent difference in growth and dry mater intake between crossbred bull calves having 50% Frisian and 75% Frisian gene inheritance supplemented with concentrate feed constituting 20% crude protein. In line to this, however, no adequate experiential evidences are available on the growth and dry matter intake curve parameters of different genetic groups of growing crossbred male calves produced in Ethiopia. Therefore, the objective of this study was to estimate and compare the growth and dry matter intake curve parameters of male crossbred calves having different genetic groups.
Material and methods
Description of the study site
The Holetta Agricultural Research Center (HARC) is located at 35 km west of Addis Ababa at 38.5°E longitude and 9.8° N latitude. It is situated at about 2400 m above sea level. The average annual rainfall is about 1200 mm and an average maximum temperature is 21.3 (18.6–24 °C). Common livestock specious reared around the study area are cattle, sheep, goat and equines.
Study animals and feeding management
All calves were weighed at birth and separated from their dams immediately after this time and moved to individual calf pens. For the first 4 days, each calf was allowed to consume 3 Litters of colostrum per day. The calves were reared on bucket feeding of whole milk until weaning. The total amount of whole milk provided to each calf until weaning age (98 days) was about 260 kg. All calves had free access to hay and an allowance of 0.5 kg of concentrate feed was provided starting from 15th day of birth up to weaning.
A total of forty-eight weaned Friesian Boran (FB) crossbred calves consisting of 24 crossbred male calves having 50% Friesian blood level and another 24 growing calves having 75% Friesian blood level reared at HARC were used for this study. Calves were moved to individual tied stalls and fed independently for fattening period of 626 days. The dimensions for the floor area was 2.80 m X 1.25 m = 3.50m2/animal excluding the area for the feeding and watering troughs.
The feeds considered in this study were native pasture hay (5.7% CP, 72.8% NDF and 8.22 MJ, ME/Kg DM) and a concentrate mixture (20% CP, 37.5% NDF and 10.69 MJ, ME/KG DM). The concentrate mixture (CP %) was formulated from 38.5% Noug seed cake, 60.5% Wheat bran and 1% salt. The total daily feed allowance was formulated based on initial body weight and subjected to change every month thereafter to meet nutrient requirements of the calves according to (Kearl Citation1982). Body weight measurements were taken every month. The amounts of feed offered and refused were recorded daily throughout the fattening period. Experimental male calves were de-wormed against internal parasites. Water was provided for experimental calves at ad libitum.
Statistical analysis
Growth curve analysis
The following Gompertz function suitable for fitting the growth curve in cattle (Kratochvilova et al. Citation2002) was chosen to estimate individual curve parameters:
(1)
(1) where Yt = is body weight (BW) at time t (age of animal since birth), A is asymptotic BW (final or mature BW), B is the integration constant which is time scale parameter and related to birth weight (W0) as B = ln(A/W0). The parameter K is the relative growth rate. To understand the shape of the growth curves, age (t*), weight (W*), maximum weight gain (K*) at time of inflection point where growth rate is maximum were calculated as t* = ln (B)/K; W* = A/e and k* = A*K/e, respectively. In addition to that degree of maturity (Ut), proportion of mature size attained at age t (ut = yt/A) at birth, 6, 12 and 24 months of age (u0, u6, u12 and u24) were considered. Other parameter was age of animal reached to 75% of mature weight (t0.75A). Similar curve parameters were estimated for dry matter intake (DMI) using the same model.
The following general linear model was used to compare genotypes for the growth and DMI curve parameters:
(2)
(2) where y = Curve parameters for BW and DMI,
μ = overall mean,
Gi = fixed effect of the genotype, i = 1–2,
Eij = residual error distributed as N (0, σ2).
Phenotypic correlation coefficients between growth and DMI curves parameters were also estimated. Nonlinear model (1) was used to estimate growth and DMI curves parameters while the general linear model (2) was to identify genotype differences after fitting the data into (SAS Citation2008).
Results and discussion
Preliminary data analysis
The results of preliminary least squares mean analysis which was carried out to examine the difference in growth performance over ages of crossbred male calves from different genetic background are presented in . Body weight did not significantly varied (P > 0.05) between 3 and 12 months of the calves’ age. However, it was highly significant (p < 0.01) at birth and between 18 and 24 months of the calves’ age with genetic group. Crossbred bull calves having 75% Friesian blood level had greater body weight than the 50% Friesian crosses at birth weight. This could be because of dam body size difference i.e. 75% FB crosses born from dam having 50% Friesian blood level, where as 50% FB crosses born from local (Boran breed) dam. Body weight differences were noted to be considerably higher (P < 0.05) among the two genotypes between 18 and 24 months of the calves’ age. Thus, the result from the present study indicated that 50% FB crosses attained higher body weight required for either local and/or export market compared to 75% FB crosses. The observed difference between the two genetic groups could be perhaps attributed to the quality (in terms of protein and energy density) of the concentrate diet to meet the vast nutritional requirements of the bull calves with higher levels of exotic blood inheritance i.e. 75% FB. Moreover, the lower body weight at 18 and 24 months ages for 75% FB crosses compared to 50% FB crosses could be the result of poor adaptation of bull calves with the higher level of Frisian blood level. Similarly, (Sisay Citation2003) reported that Simmental Boran crossbred calves having 50% Simmental blood level had the heavier body weights than calves with 75% Simmental blood level at all ages starting from six months of age.
Table 1. Least squares means of body weight at birth, 3, 6, 12, 18, and 24 months of age of crossbred growing bull calves.
The overall mean body weight of Friesian Boran crossbred bull calves at the age of 12 months (174.46 kg) was almost comparable to the results reported by (Merera and Galmessa Citation2013) for Horro Friesian crossbred bulls attained at the age of 12–24 Months (199.2 Kg). Moreover, mean body weight of bull calves at the age of 24 months (362.15 kg) in this study was found to be higher than the body weight (329.6 kg) reported by the same authors earlier for Horro Friesian bulls fed on Rhodes grass and supplemented with recommended level of on-station formulated concentrate mix at the age of 37–48 months. The difference could be attributed to genetic difference of experimental bulls and variation of supplemental feed ingredients used in formulating the ration.
Growth curve parameters
Least square means of the individual growth curve parameters for body weight were given in . Among the parameters, only A, B, K, T*, W*, U0 and k* were influenced by genotype (P < 0.05). Obtained values for the parameter A, B and K were 727.0, 2.85 and 0.0019 and 730.2 kg 2.78, 0.0017 kg/day for 50% FB and 75% FB crossbred bull calves, respectively. This study indicated that 75% FB crosses had low growth rate (K) and matured late but exhibited heavier mature weight (A) than 50% FB crosses. As shown in , 50% FB crossbred bull calves matured earlier than 75% FB crosses. The result from the current study was found to be lower than the values 743.9, 2.97, 0.0045 and 800.7, 3.02, 0.0042 and 742.5 kg, 2.81, 0.0047 kg/day that were observed for the parameters A, B and K by (Akbaş et al. Citation2006) for Frisian, Limousin x Frisian and Piedmontese x Frisian crosses, respectively. In addition, (Tutkun Citation2019) also obtained greater values of 986.44, 3.55 and 0.004 for the parameters A, B and K, respectively for Holstein Friesian bulls using the Gompertz model. The difference between this result and the later reports may be due to the difference in breed of cattle and environment under which the animals were managed.
Table 2. Estimated growth curve parameters for body weight of Frisian Boran crossbred bull calves.
50% FB crossbred bull calves also reached to the maximum growth rate (age at point of inflection) 48 days earlier than 75% FB crosses. 75% FB crossbred bull calves were late matured and heavier than 50% FB crosses at the point of inflection age (268.63 kg vs 257.46 kg). Body weight of crossbred bull calves at point of inflection age in the current study was lower than that reported earlier for Frisian (273.7), Limousin x Frisian (294.6) and Piedmontese x Frisian (273.2 kg) crosses fed on fixed amount of wheat straw and an increasing amount of concentrate diet ranging between 5 and 9 kg/day (Akbaş et al. Citation2006).
On the contrary, body weight at point of inflection age of crossbred bull calves of both genotypes in our study is higher than Dhofari cattle breed (117.0 kg) fed on commercial concentrate and Rhodes grass hay (Bahashwan et al. Citation2015) Perhaps the variation can be associated to the difference in the age, experimental diet and breeds of experimental animals used in the studies.
Degree of maturity at birth (U0) was higher in 75% crossbred bull calves but, degree of maturity at 6 (U6), 12 (U12) and 24 (U24) months of age were numerically higher in 50% crosses. This indicates that 75% FB crosses have greater birth weight compared to 50% FB crosses that the calves born from dams having 50% Frisian blood level had larger body size than those calves born from the local Boran dams. Mean degree of maturity of bull calves at birth, 6 (U6), 12 (U12) and 24 (U24) months were 3.6, 14, 25 and 51% and 4.3, 13, 23 and 47% for 50% FB and 75% FB crosses, respectively. This values from the present study were found to be smaller than mean values of degree of maturity at birth, 6 (U6), 12 (U12) and 24 (U24) months reported by (Bahashwan et al. Citation2015) for Dhofari cattle for which the mean degree of maturity values of 5.59, 33.3, 54.1 and 80.6% have, respectively been recorded. The difference could be linked to variation in the genetics of experimental bulls and supplemental feed used under the respective experimental cases.
Significant difference was not observed between 50% and 75% FB crossbred bull calves in the age to reach 75% of mature weight. Maximum weight gain (K*) at the point of inflection was significantly (p < 0.05) higher in 50% FB crosses. The mean maximum weight gain (K*) of 50% FB and 75% FB crossbred bull calves were 0.52 and 0.46 kg, respectively. The result observed from the present study was found to be lower than the 0.97 kg K* value reported for Hanwoo bulls by (Cho et al. Citation2002) and 1.22, 1.21 and 1.24 kg for pure Frisian, Limousin x Frisian and Piedmontese x Frisian crosses, respectively (Akbaş et al. Citation2006).
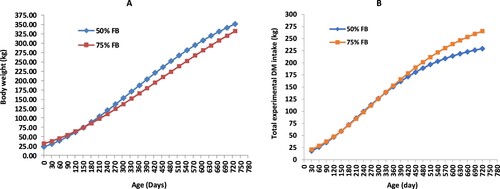
Observed and estimated growth curves for body weight are plotted in (A). To compare growth performances of genotypes, estimated growth curves of both genotypes for BW are also given in (A). The body weights of 50% FB crosses were found to be substantially higher starting from the age of 210 days up to the end of growing period than that observed for 75% FB crosses. In contrast to the present finding, Mesfin et al. (Citation2013) noted that 75% FB crossbred growing calves had better body weight gain than 50% FB crossbred calves. This could be possibly attributed to the quality (in terms of protein and energy density) of the concentrate diet to meet the huge nutritional requirements of the bull calves with higher levels of exotic blood level i.e. 75% FB crosses.
Figure 1. Estimated and observed curves of 50% FB and 75% FB crossbred Bull calves for body weight (A) and total experimental DM intake (B).
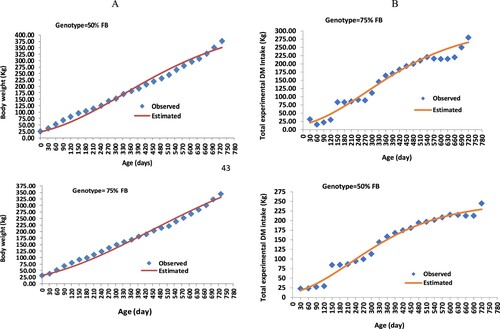
Figure 2. Estimated curves of 50% FB and 75% FB crossbred bull calves for body weight (A) and total experimental DM intake (B).
Curve parameters of dry matter intake
Least square means of the individual curve parameters for DMI were given in . Significant differences (P < 0.05) between genotypes for the curve parameters except maximum DMI increase (K*) and age of animal reached to 75% of mature age DMI (T0.75A) were observed. 75% FB crossbred bull calves had significantly higher (P < 0.05) DMI at mature age (A) than 50% FB crosses, which implies that mature age feed consumption was higher in 75% FB crosses compared to 50% FB crosses. However, K parameter for DMI was lower (P < 0.05) in 75% FB crosses compared to 50% FB crosses. Small K parameter value for 75% FB crosses resulted from high parameter A value for DMI, in contrast, the high K parameter value recorded for 50% FB crosses indicated the faster the rate of feed intake and the smaller A value for DMI. The observed result for K and A parameters for DMI of 75% FB crosses were similar to the report of (Akbaş et al. Citation2006) who obtained smaller K parameter and higher A parameters values on pure Frisian male cattle than on their crosses with Limousin and Piedmontese having 50% Frisian blood level. This implies that growing male cattle having 75% and more Frisian blood level have lower DMI rate (k) and higher mature age feed consumption (A) than those having 50% Frisian blood level.
Table 3. Estimated growth curve parameters for dry matter intake of Frisian Boran crossbred bull calves.
Age at point of inflection (T*) of 75% FB crosses for DMI was 37.8 days longer (P < 0.05) than the age of 50% FB crosses. This results showed that 50% FB crosses reach to maximum dry matter intake in 37.8 days earlier than 75% FB crosses while contrary to this DMI at point of inflection (DMI*) for 75% FB crosses was greater by 12.53 kg (P < 0.05) than that of 50% FB crosses. This finding goes in line with the result of (Akbaş et al. Citation2006) who confirmed 50% Piedmontese X Frisian (PixF) crossbred male cattle reach to maximum dry matter intake earlier than pure Friesian male cattle but DMI at point of inflection of pure Frisian male cattle was greater than that of 50% PixF crossbred male cattle. This implies that male cattle having high proportion of Frisian blood reach to maximum dry matter intake latter than 50% crossbred male cattle and have greater DMI at point of infection age.
Observed and estimated dry matter intake (DMI) curves of crossbred bull calves were plotted in (B). Estimated DMI curves of both genotypes for DMI were compared in (B). Both genotypes had similar DMI values through the days that extend from 30 to 390 days of their age but from 420 to 730 days of their age, 75% FB crosses had higher DMI than that of 50% FB crosses. DMI of FB crossbred bull calves had an increasing trend after 390 days of age as seen in (B). This study is in favor of an earlier research result by (Hicks et al. Citation1990) who indicated that DMI of feedlot cattle increases rapidly during the earlier phase of the finishing period after which it would remain consistent over the period and at later phase it begins to descend when the animal somehow approached on the finishing period.
Correlations between curve parameters of body weight and dry matter intake
Phenotypic correlation coefficients between the curve parameters of body weight (BW) and dry matter intake (DMI) are given in . Correlation of A (BW) with A (DMI), T*(DMI) and W* (DMI) were positive while it was negative between A (BW) and K (DMI). This revealed that crossbred male calves, which matured later, tended to have higher DMI at maturity i.e. the more time to reach maximum DMI, the higher BW at mature.
Table 4. Correlation coefficients between growth curve parameters for body weight and dry matter intake of Frisian Boran crossbred bull calves.
The (p < 0.01) negative correlation between K (BW) and A (DMI) or W* (DMI) show that growth rate of crossbred male calves was associated negatively with DMI at mature and DMI at point of inflection age. The growing male calves which grew earlier tend to have shown lower mature DMI. In this study, a significant (p < 0.05–0.01) positive correlation between K (BW) and K (DMI) or K* (DMI) were also observed.
The more calf grows fast, the higher dry matter intake rate it has. The result is supported by report of (Ceacero et al. Citation2016) who confirmed that there was positive correlation of average daily gain and metabolic body weight with DMI of Nellore cattle. Similarly, the correlation between K (BW) and T* (DMI) or T0.75A (DMI) of FB crossbred male calves were highly negative (p < 0.01) implying that male calves which grew faster tends to reach earlier to the age at point of inflection and the age at 75% of mature DMI.
The age at point of the inflection for body weight (T* (BW)) with A (DMI), T*(DMI), T0.75A (DMI), W*(DMI) were positively correlated (p < 0.01) but it was significantly (p < 0.05–0.01) negative between T* (BW) and K (DMI) or K*(DMI). The male calves with the longer accelerated phase had higher mature DMI but lower rate of DMI. The observed results for relationship between bodyweight and DMI curve parameters of FB crossbred bull calves were also similar to the report of (Akbaş et al. Citation2006) on pure Frisian, Limousin x Frisian and Piedmontese x Frisian crosses.
Conclusions
This study indicated that 75% FB crossbred bull calves had low growth rate and maturity but exhibited heavier mature weight than 50% FB crosses. This study also revealed that 50% FB crossbred bull calves are an earlier maturing genotype and had significantly lower DMI at mature age than 75% FB crosses, which implies that feed consumption at maturity, was lower in 50% FB crosses compared to 75% FB crosses. The inverse relationship between mature weight and DMI increasing rate revealed that the animal, which matured earlier, tended to have lower DMI at maturity. Generally, 50% FB crossbred bull calves can be used for fattening purpose to meet increasing lean meat demand of consumers in Ethiopia with decreased feed cost under improved feeding system.
Acknowledgements
We are thankful to Ethiopian Institute of Agricultural Research (Holeta Agricultural Research Center) for financing this work. Technical assistances of Dairy Research Program at Holeta Research Center are also acknowledged for their unreserved support during experiment work.
Disclosure statement
No potential conflict of interest was reported by the author(s).
References
- Akbaş Y, Alçiçek A, Önenç A, Güngör M. 2006. Growth curve analysis for body weight and dry matter intake in Friesian, Limousin x Friesian and Piemontese x Friesian cattle. Arch Anim Breed. 49(4):329–339. doi:10.5194/aab-49-329-2006.
- Alemayehu M, Wondatir Z, Gojjamand Y. 2013. Evaluation of Friesian x Boran crossbred and Ethiopian highland zebu oxen with a reciprocal work effect on carcass characteristics. Livest Res. 25:1016–1021.
- Arthur P, Archer J, Herd R, Richardson E. 1998. A review of variation in feed efficiency of beef cattle. Paper Presented at the Proc. 6th World Congr. Genet. Appl. Livest. Prod.
- Bahashwan S, Alrawas AS, Alfadli S, Johnson E. 2015. Dhofari cattle growth curve prediction by different non-linear model functions. Livest Res Rural Dev. 26:236.
- Ceacero TM, Mercadante MEZ, Cyrillo JNdSG, Canesin RC, Bonilha SFM, de Albuquerque LG. 2016. Phenotypic and genetic correlations of feed efficiency traits with growth and carcass traits in Nellore cattle selected for postweaning weight. PLoS One. 11(8):e0161366. doi:10.1371/journal.pone.0161366.
- Cho Y, Yoon H, Park B, Ahn B, Jeon B, Park Y. 2002. Study on the optimum range of weight-age data for estimation of growth curve parameters of Hanwoo. J Anim Sci Technol. 44(2):165–170. doi:10.5187/JAST.2002.44.2.165.
- Demeke S, Neser F, Schoeman S. 2003. Variance components and genetic parameters for early growth traits in a mixed population of purebred Bos indicus and crossbred cattle. Livest Prod Sci. 84(1):11–21. doi:10.1016/S0301-6226(03)00074-5.
- Effa K, Hegde B, Kumsa T. 2006. Lifetime production and reproduction performances of Bos Taurus x Bos indicus crossbred cows in the central highlands of Ethiopia. Ethiop J Anim Prod. 6(2):1–16.
- Golze M. 2001. Wachstum, Schlachtleistung und Schlachtkörperqualität von Weidemastkälbern aus der Mutterkuhhaltung mit Fleischrindrassen. Arch Anim Breed. 44(6):621–628. doi:10.5194/aab-44-621-2001.
- Hicks R, Owens F, Gill D, Oltjen J, Lake R. 1990. Daily dry matter intake by feedlot cattle: influence of breed and gender. J Anim Sci. 68(1):245–253.
- Kearl LC. 1982. Nutrient requirements of ruminants in developing countries. Logan: International Feedstuffs Institute, Utah State University.
- Kratochvilova M, Hyankova L, Knizetova H, Fiedler J, Urban F. 2002. Growth curve analysis in cattle from early maturity and mature body size. Czech J Anim Sci-UZPI. 47(4).
- Merera C, Galmessa U. 2013. Fattening performances of culled dairy bulls to boost benefits of dairy farmers in Western Oromia, Ethiopia. Int J Livest Prod. 4(10):161–164. doi:10.5897/IJLP2013.0170.
- Merera C, Galmessa U, Lemma T, Kebede M, Dassalegn J. 2004. Study on the utilization and management of draft animals in east and west Wellega zones. ESAP Proceedings. 112–116.
- Mesfin R, Bekele T, Kitaw G, Dejene M, Kehaliew A. 2013. Growth performance of F1 and high grade Friesian-Boran crossbred calves fed on oilseed cake based concentrate supplements. Livest Res. 103–112.
- SAS. 2008. Statistical Analysis system user’s guide, Release 9.2 SAS Institute, Inc., Cary, NC, USA.
- Shumye M. 2021. Growth curve analysis of body weight in crossbred dairy cattle in central Ethiopia. Livest Res Rural Dev. 33:7.
- Shumye M, Wondatir Z, Kitaw G, Kahaliw A. 2021. Growth and fattening performances of Friesian-Boran crossbred bull calves fed on different protein supplements. Ethiop J Agric Sci. 31(4):57–70.
- Sisay A. 2003. Growth performance of Boran cattle and their Simmental crosses in Ethiopia. ESAP Proceedings. 233–239.
- Tutkun M. 2019. Growth curve prediction of Holstein-Fresian bulls using different non-linear model functions. Appl Ecol Environ Res. 17(2):4409–4416. doi:10.15666/aeer/1702_44094416.