
 ?Mathematical formulae have been encoded as MathML and are displayed in this HTML version using MathJax in order to improve their display. Uncheck the box to turn MathJax off. This feature requires Javascript. Click on a formula to zoom.
ABSTRACT
In this study, we employed a number of geospatial techniques to examine the spatio-temporal patterns and changes of environmental attitudes and place attachment values in the Gauteng province of South Africa. The data were obtained from the Gauteng City Region Observatory’s Quality of Life Survey collected at three separate points in time, namely 2013, 2015, and 2017. Results indicated that wards (smallest administrative and analysis units) located on the urban periphery of Gauteng, which are generally less affluent, largely held more negative environmental attitudes and place attachment values during the three time periods. In contrast, centrally located wards, which are generally more affluent, expressed more positive environmental attitudes but less place attachment values, especially in 2017. The findings of this research not only highlight the complex spatio-temporal distribution of environmental attitudes and place attachment values throughout Gauteng but also emphasize the need for spatially targeted state interventions for future environmental planning within the province.
1. Introduction
Over the past few decades, studies examining human-environment interactions have increased substantially in both size and scope. This has largely been due to the increased pressure placed on the environment as a result of rapid urbanization as well as rising globalization (Scotts and Willits Citation1994; Thogersen Citation2006; Chen et al. Citation2011). Examining the ways in which individuals perceive their environment as well as ascribe value to their place of residence is important as these factors are known to greatly impact environmental behavior (Kollmuss and Agyeman Citation2002), as well as influence environmental planning and management (Zube Citation1987; Shaoa and Liu Citation2017; Dominiques and Gonçalves Citation2018). Environmental attitudes in this study refer to the feelings (either positive or negative) that individuals develop toward their surroundings (Borden and Schettino Citation1979; Triandis Citation1979). According to Hidalgo and Hernaèndez (Citation2001), these attitudes are made up of three components, namely cognitive, affective, and behavioral. The cognitive component refers to thoughts and ideas whereas the affective component refers to feelings and emotions. Finally, the behavioral component refers to intentions and/or overt actions. Place attachment on the other hand is defined as the feelings and bonds we develop toward places that are highly familiar to us (Raymond Citation2010; Van Veelen and Haggett Citation2017). It also reflects human experiences, emotions, and thoughts as well as their meanings, values, and feelings associated with a place (Stedman Citation2003; Chapin and Knapp Citation2015). Thus, attachment to an area represents both an individual’s internalized perceptions of the area (i.e. identity), as well as the extent to which he or she feels that visiting the area will fulfill motivational goals (i.e. dependence). Whilst inherently different, both environmental attitudes and feelings of place attachment are similar in the sense that they both have been found to predict pro-environmental social behaviors (Ramkissoon and Mavondo Citation2017; Qu, Xu, and Lyu Citation2017). Daryanto and Song (Citation2021) conducted a meta-analysis on the relationship between place attachment and pro-environment behavior. They obtained 130 effect sizes from 38 research articles published between 2002 and 2019 and found a positive effect of place attachment on pro-environmental behavior, with the effect size in the studies they examined ranging from small to large, with the overall effect being moderate (r = 0.270).
Research examining these two concepts has increasingly used Geographical Information Systems (GIS) to measure and describe any interactions. For example, in Australia, Brown, Raymond, and Corcoran, (Citation2015) used GIS to examine how the socio-demographic background of participants influenced their place attachment values and found that place attachment is influenced by occupational roles. The researchers also found that there was a spatial element inherent in the distribution of place attachment values. Brown, Reed, and Raymond (Citation2020) later highlighted the importance of socio-demographic factors on participants’ environmental attitudes by demonstrating how social ties and networks can predict positive attitudes. Other studies have used more advanced spatial analysis techniques to better understand human-environment interactions. For example, Andrade et al. (Citation2019) used the Getis-Ord Gi* statistic to identify how patterns of attitudes toward the desert are spatially distributed throughout neighborhoods in metropolitan Phoenix, Arizona. The researchers found that these attitudes are spatially clustered throughout neighborhoods. Positive views of the desert were found to be concentrated in high-income areas, whereas negative attitudes were clustered in areas associated with lower socioeconomic status. Other studies have examined the spatial contagion and/or diffusion of related concepts. For example, Schultz et al. (Citation2014) used a variety of items (e.g. severity of environmental problems in a community, perceptions of the seriousness of world environmental problems) to measure spatial bias in environmental perceptions. The researchers found that participants perceived environmental problems to be more severe globally than in their local communities (i.e. spatial bias). The concept of spatial bias has been aligned with the so-called “spatial mismatch hypothesis” (Holzer Citation1991) which posits that there is a spatial difference in the perception of environmental problems from the central of urban centers to their peripheries; the central most often being dominated by the more affluent residents and the periphery by the poor.
In South Africa, Cheruiyot, Wray, and Katumba (Citation2015) used spatial error modeling to investigate levels of dissatisfaction with the performance of local government in Gauteng province while Katumba, Cheruiyot, and Mushongera (Citation2019) also used a number of geospatial techniques to examine poverty in the same province. Both studies found significant spatial clustering in the level of dissatisfaction with the performance of local government and poverty levels, respectively, with the former study also identifying a number of spatial predictors of the level of local dissatisfaction. Similarly, Peberdy, Harrison, and Dinath (Citation2017) used the core-periphery concept to demonstrate the socio-economic divide inherent in South African cities whereby the poor and marginalized mostly occupy decaying areas within the city center, or the urban periphery of cities where land values are relatively low whereas the more affluent occupy suburban enclaves of wealth often distinct from the urban core. Likewise, Apotsos (Citation2019) also found that social vulnerability varies spatially with a distinct core-periphery variation, driven primarily by socio-economic factors such as income as well as by demographics such as race. These factors played a role in peoples access to basic services in these localities. A limited number of studies have been undertaken in South Africa examining patterns of residence related to various human-environment interactions; however, they have often neglected the important spatial component (Roos Citation2008; Chigeza, Roos, and Puren Citation2013; Cundill et al. Citation2017; Giddy and Webb Citation2018). Elsewhere, most studies have primarily focussed on homogenous locales (e.g. Cheung and Hui Citation2018 on attitudes toward heritage forest conservation in China,; Heidari et al. (Citation2019), on leisure activities in Iran) or treated environmental attitudes and place attachment in isolation (e.g. Baierl, Johnson, and Bogne Citation2021; Daryanto and Song Citation2021), and not holistically, as in the present study.
In contrast, in this paper we examine the spatial and temporal component inherent in the distribution of environmental attitudes and place attachment in the Gauteng province of South Africa. We study three iterations of the Gauteng City-Region Observatory (GCRO) Quality of Life surveys, namely 2013, 2015, and 2017. Examining these two concepts over three separate time intervals allows for more meaningful and informed targeted policy interventions to be potentially implemented aimed at improving environmental behavior. It could also assist in enabling better and broader environmental decision-making processes to be adopted for the advancement and planning of local service delivery strategies within the province. If environmental attitudes and levels of place attachment change over space and time, then development strategies can be selectively and spatially targeted to groups or wardsFootnote1 where certain sentiments dominate.
2. Materials and methods
2.1. Data
Data pertaining to the environmental attitudes and place attachment values for the five municipalities in Gauteng were obtained from the GCRO’s Quality of Life (QoL) surveys conducted in 2013, 2015, and 2017 (the GCRO has been conducting surveys biennially, the next survey was scheduled for 2020). The 2013 QoL survey consisted of 27,490 randomly selected respondents across all 508 wards in Gauteng. The 2015 survey consisted of a sample of 30,002 respondents while the 2017 survey comprised 24,889 respondents, all across the same 508 wards throughout the province. The spatial data used were based on the 2011 Enumeration Areas (EA) spatial sampling frame developed by Stats SA (Citation2011). The weights were applied prior to data collection and post data collection before analysis could take place to correct for sampling bias and non-response. Weighting is a common statistical method used to reduce possible selection-bias in studies of this nature. After weighting, the weights were benchmarked using Statistics South Africa (Stats SA) Census 2011 adult population (18 years and older) based on gender and race per ward to allow for the generalizability of findings to the entire province. For 2017 survey, the Stats SA Community Survey 2016 data, which was collected at the municipal level, was used to update the Census 2011 ward-level population for benchmarking the weights based on race and gender (GCRO Citation2019). For all the surveys, data collection involved face-to-face interviews with randomly selected adult residents using Computer Assisted Personal Interviewing instruments; results were geo-located. .A number of survey questions were asked pertaining to a number of sections related to migration status, household economic characteristics, neighborhood/community, and general environmental questions (e.g. opinions on the quality of respondents’ surroundings), among others. For a technical review of the GCRO QoLsurveys, the reader is referred to Orkin (Citation2020).
One question from the survey was selected as a proxy for each concept. The selected question was the same for the three survey years under consideration (2013, 2015, and 2017), allowing for the trends of the data to be compared over time. Admittedly, different respondents were selected for each survey iteration; therefore, our results should be interpreted with this in mind. Additionally, the term “environment” referred to in all surveys is broad and open to interpretation. As such, care was taken to define the context in which the word was used during the interview process (GCRO Citation2015). The following statement was used to ascertain respondents’ environmental attitude: “There has been environmental improvements in the community/suburb over the last 12 months”. Responses for this question were recorded on a three-point Likert-type scale ranging from (1) improvement, (2) deterioration, and (3) no change. Respondents who believe that their suburb had improved over the past year were categorized as exhibiting positive environmental attitudes while respondents who believed that their suburb had declined over the past year were categorized as exhibiting negative environmental attitudes. While we duly acknowledge that the concept of environmental attitudes is multifaceted and can be operationalized using a range of questions, we extracted this particular question since it best represented how respondents felt about their environment. The responses provided by the respondents would also likely impact all three kinds of evaluative responses linked to environmental attitudes outlined earlier, namely cognitive, affective and behavioral.
For place attachment, the following question was used: “How satisfied are you with the area/neighborhood you live in?” This question was chosen because it closely represents “place satisfaction”, which has been cited as a concept of place attachment especially in tourism studies (Ramkissoon, Weiler, and Smith Citation2013; Hosany et al. Citation2015; Chen and Dwyer Citation2018). Place satisfaction was used in these studies as a predictor of environmental behavior, an angle that is also followed in this article. Responses for this question were recorded on a five-point Likert-type scale ranging from (1) highly satisfied, (5) to strongly dissatisfied. Similar to the previous concept, respondents who were highly satisfied with the neighborhood in which they reside were categorized as exhibiting positive place attachment values, while respondents who were highly dissatisfied with the neighborhood in which they reside were categorized as exhibiting negative place attachment values. All responses to these questions were aggregated to the ward level, with high values representing aggregated positive responses in the Likert scale (highly satisfied) and lower values representing the aggregated negative responses (strongly dissatisfied). The three QoL surveys questionnaire used for this study are available as Additional Files or Supplementary Files at the end of this article. We are aware that the accuracy of aggregating survey data to the ward level is open to debate; however, we were largely constrained by the design of the survey and for practical and policy reasons, felt a ward level would be the most beneficial level of aggregation. After a thorough examination of our methods, we are reasonably satisfied that the data obtained from the QoL survey broadly reflects the attitudes and behaviors of the majority of residents at the ward level. Besides, the use of this form of aggregation of survey data is common in multi-level modeling research and other research of a similar nature (Breetzke and Pearson Citation2014; Pearson, Breetzke, and Ivory Citation2015).
2.2. Global Moran’s I
The first step in the analysis procedure was to identify whether there was any evidence of spatial autocorrelation (clustering) of environmental attitudes and place attachment values in the data. Spatial autocorrelation occurs when similar or dissimilar values for a random variable cluster together in space (Anselin Citation1995). The concept is synonymous with Tobler’s first law of geography that states that everything is related to each other, but near things are more related than distant things (Tobler Citation1970). In the context of this study, we hypothesize that wards that are close to each other are more likely to exhibit similar environmental attitudes and place attachment values than wards that are geographically farther apart. A spatial autocorrelation test was done using the global Moran’s I statistic (Moran Citation1950). The global Moran’s I statistic indicates the degree of global spatial association between a variable and its spatial lag. Formally, the Moran’s I in matrix form is depicted as:
where N is the number of cases; X is the mean of the variable; Xi is the variable value at a particular location; Xj is the variable value at another location; Wij is a weight indexing location of i relative to j.
The Moran’s I statistic ranges from −1 to 1 where −1 indicates clustering of dissimilar values (i.e. perfect dispersion) and +1 indicates perfect clustering of similar values. A value of 0 indicates no spatial autocorrelation (complete spatial randomness).
2.3. Hot spot analysis (Getis-Ord Gi* statistic)
In order to determine the significance of the clustering, hot spot analysis was performed. Hot spot analysis was undertaken using the Getis-Ord Gi* statistic to identify hot and cold spots of positive and negative environmental attitudes and place attachment values. The Getis-Ord Gi* statistic measures the intensity of clustering of high or low Gi-Bin-values and allows the output to be mapped at an aggregate level. The Gi* statistic as defined by Getis and Ord (Citation2010) is defined as:
where Gi* describes the spatial dependency of a variable i over all n events, Xj = magnitude of variable X at incident location (the ward) j over all n (j may equal i), and wij = weight value between event i and j that represents their spatial interrelationship. Hot spot areas on the resultant maps indicate a statistically significant clustering of high (positive) values for environmental attitudes and place attachment values. Cold spot areas on the resultant maps indicate a clustering of low values for environmental attitudes and place attachment values. Hot and cold spots were mapped at the ward level for each of the three time periods (2013, 2015, and 2017) under investigation.
2.4. Local indicators of spatial association (LISA)
Local Indicators of Spatial Association (LISA) analysis was conducted to identify significant localized clustering of environmental attitudes and place attachment values. Unlike the global Moran’s I statistic above which generates a single statistic outlining the degree of global spatial clustering in the data, and the hotspot analysis that only identifies areas of statistically significant hot and cold spots, the LISA statistics highlight localized areas of spatial clustering. The statistics is expressed as follows:
where wij is the spatial weight between ward i and ward j given by the weight matrix “w”, yi is the environmental attitude/place attachment value of the ward of interest while yj represents the attitude/place attachment index value of the neighboring ward. Finally, Y represents the average attitude/place attachment value (Anselin Citation1995).
The analysis output is the categorization of each ward into one type of cluster. High-high clusters indicate neighborhoods which exhibit positive environmental attitudes and place attachment values and are surrounded by other neighborhoods which exhibit similar positive environmental attitudes and place attachment values. Low-low clusters indicate neighborhoods which exhibit negative environmental attitudes and place attachment values and are surrounded by other neighborhoods which exhibit similar negative environmental attitudes and place attachment values. Spatial outliers (low-high and high-low clusters) refer to wards that exhibit values of environmental attitudes and attachment that are dissimilar from their neighboring wards (neighborhoods which exhibit positive environmental attitudes and place attachment values and are surrounded by neighborhoods which exhibit negative environmental attitudes and place attachment values and vice versa).
Previous studies have used the above and other geospatial techniques to investigate a range of similar phenomena. For example, Gao et al. (Citation2019) used spatio-temporal autocorrelation analysis (specifically Moran’s I and LISA to examine human mobility in Beijing, China while also in China Yang et al. (Citation2020) used hotspots analysis to examine land surface temperature changes. In Vietnam, Le, Liu, and Lin (Citation2020) also used hotspot analysis to assess road accident hotspots. The present study follows an almost similar methodology to assess spatio-temporal changes in the selected human-nature sentiments.
3. Results
The results of the Moran’s I analysis are shown in . Significant spatial clustering was found for environmental attitudes and place attachment values across all 3 years. That is, neighborhoods that exhibited positive environmental attitudes and place attachment values clustered together and neighborhoods that exhibited negative environmental attitudes and place attachment values likewise clustered together. Interestingly, there was no discernible change in the spatial clustering of environmental attitudes and feelings of place attachment from 2013 to 2015. However, there was a noticeable increase in the Moran’s I values in 2017. This suggests that individuals’ positive or negative environmental attitudes and place attachment values clustered together more significantly during this period.
Table 1. Moran’s I values for environmental attitudes and place attachment for Gauteng
Results of the hot spot analysis indicate that the central wards of Gauteng generally exhibited more positive environmental attitudes for the three study years, whilst the peripheral wards most often expressed more negative attitudes (see ). Hot spots were concentrated in the central wards of the City of Johannesburg, the City of Ekurhuleni and the southern wards of the City of Tshwane in 2013. These were variable, however, and increased from 2013 to 2015 but dropped in 2017, with the City of Tshwane in particular exhibiting less positive attitudes in 2017. Finally, the concentration of cold spots around peripheral wards generally decreased toward 2017 especially in the southern and eastern regions of the province.
Figure 1. Hot and cold spots for environmental attitudes (a–c) and place attachment (d–f) for 2013, 2015, and 2017 respectively
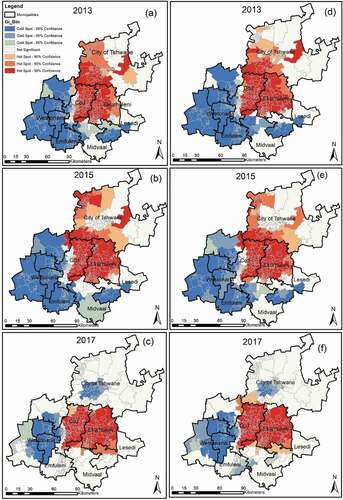
Positive place attachment values were again centered on the central wards of Gauteng (see . These positive place attachment values increase in magnitude from 2013 to 2015, with the City of Tshwane in the north contributing the most to this increase. Similar to the above, peripheral wards of Emfuleni and Midvaal in Sedibeng, and Westonaria in the West Rand most often exhibited more negative place attachment (although these decreased toward 2017) whereas the central wards showed positive place attachment, with a decrease toward 2017.
Positive environmental attitudes (high–high clusters) were concentrated on the central wards of the City of Johannesburg, the City of Ekurhuleni and the southern wards of the City of Tshwane in 2013 (see . This shifted somewhat in 2015 toward northern Tshwane and toward the southern peripheral wards of Sedibeng (Midvaal and Emfuleni). This indicates that between 2013 and 2015 residents around the provincial centroid were exhibiting more positive environmental attitudes, and these shifting further north and south. For place attachment, positive place attachment stretched from Sedibeng in the south toward the north of the City of Tshwane (see . In 2015, positive place attachment was less pronounced in the northern wards of Sedibeng, and the whole of the West Rand. In 2017, the high–high hotspot was concentrated around the City of Ekurhuleni and in the northern peripheral wards of the Sedibeng. The central wards of the City of Johannesburg, City of Tshwane, and parts of Sedibeng showed more negative place attachment during this period.
Figure 2. Cluster and outlier maps for environmental attitudes (a–c) and place attachment (d–f) for 2013, 2015, and 2017 respectively
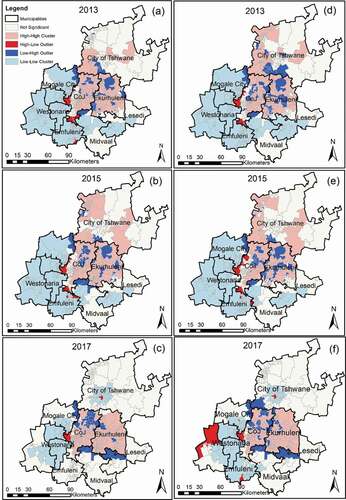
Negative environmental attitudes (low–low clusters) were dominant in the peripheral wards of the West Rand and Sedibeng in 2013 and 2015. In 2017, this cluster was evident in the City of Johannesburg and City of Tshwane and in the central wards of the West Rand. This suggests that even though peripheral wards held more negative environmental attitudes from 2013 to 2015 this changed to central wards in the major cities expressing more negative environmental attitudes in 2017. In terms of place attachment, negative place attachment values spatially correlated with negative environmental attitudes in 2013 and 2015. In 2017, there were more negative place attachment values in the peripheral wards of Sedibeng and the West Rand, and to the extreme south of the City of Tshwane and parts of the City of Johannesburg. This indicates that from 2013 to 2015 people were feeling less bonded to the province, and this increased in 2017. Finally, spatial outliers (low–high and high–low clusters) were scattered throughout mainly smaller wards in Sedibeng and in the West Rand in 2013 and 2015. In 2017, these outliers increased and were more pronounced in the peripheral wards of the West Rand and the southerly peripheral wards of Sedibeng.
4. Discussion
In this study we used three geospatial techniques, namely global Moran’s I, the Getis Ord Gi* statistic, and Anselin’s LISA to visualize the spatio-temporal patterns of environmental attitudes and place attachment values in Gauteng over three time periods. The global Moran’s I results showed significant spatial clustering of environmental attitudes and place attachment values in 2013 and 2015, which increased significantly in 2017. In subsequent analysis we found positive environmental attitudes (high-high clusters) were concentrated in the central, generally more affluent wards of the City of Johannesburg, the City of Ekurhuleni and the southern wards of the City of Tshwane. Peripheral, less affluent wards generally exhibited more negative environmental attitudes. In terms of place attachment, positive place attachment values were again centered on these central wards of Gauteng. These positive place attachment values increased in magnitude from 2013 to 2015, with the City of Tshwane in the north contributing the most to this increase. Similar to the above, peripheral wards most often exhibited more negative place attachment (although these decreased toward 2017) whereas the central wards showed positive place attachment, with a decrease toward 2017. These findings are discussed in light of relevant literature below.
4.1. Peripherality, environmental attitudes, and place attachment
Wards located on the urban periphery generally expressed negative environmental attitudes and feelings of place attachment for almost all the periods under investigation. Reasons for these findings could be related to the underlying level of wealth of residents of Gauteng in these respective wards. Indeed, residents in wards located on the urban periphery of cities in South Africa are in most cases less affluent than residents of more central wards. Being less affluent may lead to residents caring less about their environment and sense of “place” and caring more about satisfying their own day-to-day economic needs. Cheruiyot, Wray, and Katumba (Citation2015) and Katumba, Cheruiyot, and Mushongera (Citation2019) found a similar socio-spatial pattern in their examination of levels of dissatisfaction with local government in Gauteng with residents in the periphery exhibiting greater levels of dissatisfaction with local government than residents located in the more central parts of the province. The researchers argued that a core and peripheral divide exists in the spatial distribution of these attributes. Peberdy, Harrison, and Dinath (Citation2017) also highlighted how areas on the geographic edge of cities in South Africa, or at various intermediary spaces within cities including those outside the urban central of the city-region and province are also socially and economically marginalized. Of course, the historical antecedents to the current (and continued) socio-spatial nature of South African cities can be found in the previous apartheid government’s purposeful design of its cities. Under apartheid, the nonwhite population were forcibly removed from former Whites-only neighborhoods in the central regions of cities and relocated into predominantly outlying peripheral areas distant and distinct from the White urban core. The result was the creation of so-called “townships”. It is the historical neglect of these township communities in terms of the provision of public services, resources and infrastructure which researchers have argued has given rise to an increase in dissatisfaction with government (Cheruiyot, Wray, and Katumba Citation2015; Katumba, Cheruiyot, and Mushongera Citation2019). In this context, socio-economic impoverishment, and concentrated disadvantage has colluded to create ecologically isolated and stereotyped communities. Given these historical circumstances, it is therefore not surprising that the peripheral wards in South Africa’s most populous province (Gauteng) may be more likely to exhibit negative environmental attitudes and place attachment. It could also reflect the fact that levels of poverty in the province have not declined markedly since democracy in 1994 which has had spill-over effects in the province such as the growth in informal settlements, and the concomitant increase in the competition for resources (Apotsos Citation2019).
4.2. Adjacency, environmental attitudes, and place attachment
Certain regions of Gauteng did, however, display substantial localized variability in their environmental attitudes with a number of wards with negative attitudes adjacent to wards where more positive attitudes were indicated. This suggests that there could be some other underlying individual characteristic and/or mechanism that drives an individuals’ attitude and attachment regardless of spatial location. Similarly, previous studies have found an individual-level link between environmental attitudes, place attachment and respondents’ socio-economic standing. For example, in Shanghai, China, Shen and Saijo (Citation2007) found that individuals with a high income and a high level of education exhibited greater concern for the environment than those with lower income and levels of education. Other researchers have argued that high-income earners tend to live in more environmentally friendly areas, and are, therefore, more likely to be protective toward the environment (Philippsen, Angeoletto, and Santana Citation2017). Van Liere and Dunlap (Citation1981) motivate that environmental matters are more of a “luxury” for low-income earners and can only be indulged upon after more basic material issues (adequate food, shelter, and economic security) have been addressed. These findings suggest a more complex human-environment interaction, as the relationship between socio-economics and attitudes and attachment was not always that clear. In their study of environmental concern in South Africa, Hunter, Strife, and Twine (Citation2010) found that environmental attitudes evolve around livelihoods, socio-economics and the individual experience. They note that these factors intertwine with other individual-level factors in a complex way to determine one’s outlook toward the environment. Typically, the peripheral areas of major urban centers in Gauteng are dominated by relatively poor and unemployed black African residents, a remnant of the former apartheid government’s regional development policies wherein cities across the country were spatially segregated by racial group. This segment of the population does not often have the financial means to commute to the central city to seek economic opportunities, and so is confined to the city fringes (Holzer Citation1991). This spatial mismatch, as hypothesized by Holzer (Citation1991), between poverty and access to economic opportunities may express itself in negative environmental attitudes and place attachment, a finding we note in this study. Paradoxically, the more affluent may choose to live in these outlying locations, or the poor may invade these locations due to a shortage of space (Peberdy, Harrison, and Dinath Citation2017) leading to a juxtaposition of poor/affluent wards. In this study, this could explain the limited number of spatial outliers found on the urban periphery of most main urban centers.
4.3. Outliers, environmental attitudes, and place attachment
Finally, we found a high incidence of spatial outliers (high-low and low-high clusters) for place attachment for all the years under consideration. This suggests a juxtaposition of positive values for environmental attitudes and attachment juxtaposed with negative values. Again, the explanations for the high incidence of spatial outliers in our study may not be conclusive but may reflect the high levels of inequality that exist in the country that often manifests itself spatially in areas of extreme wealth being located adjacent to areas of extreme poverty. The most obvious example of this in Gauteng is the neighborhoods of Sandton and Alexandra located in the City of Johannesburg. These two neighborhoods are adjacent to each other, separated only by a highway, but have markedly different socio-economic profiles. Indeed, Sandton, whose central business district is generally regarded as Africa’s richest square mile is: “neat, salubrious and conducive to human well-being. Conversely, Alexandra township is dirty, polluted and overcrowded.” (Nyapokoto Citation2014, 4). Residents of Sandton may understandably exhibit positive values for environmental attitudes and place attachment whereas residents of Alexandra would likely exhibit negative values despite their being spatially adjacent to Sandton. Likewise, the proliferation and mushrooming of informal settlements and so-called “squatter-camps” in affluent residential areas in Gauteng could also lead to a juxtapositioning of positive and negative environmental attitudes and levels of attachment. Affluent areas in the City of Tshwane, the City of Johannesburg, and the City of Ekurhuleni have all seen informal settlements mushrooming on their peripheries which could affect social bonding and general environmental sentiments in these locations, as the more affluent feel “invaded” and thereby lose a sense of safety and security.
Finally, the gentrification occurring within certain cities of Gauteng could also result in a juxtaposition of residents of varying socio-economic circumstances, with concomitant varying views on the environment based on their underlying economic circumstances. In Eastern Europe, Lewicka (Citation2011) found that social ties and networks are positive predictors of place attachment. These bonds are also reflected in a sense of security that neighborhoods build based on common aspects like socio-economic status (Lewicka Citation2011) and a history of past criminality (Mesch and Manor Citation1998). These sentiments may then express themselves in environmental behavior with the more affluent exhibiting greater positive environmental behavior than the less affluent.
4.4. Study limitations
The present study has some limitations. First, proxy variables were used to represent the concepts of environmental attitude and place attachment. We are aware that both these concepts are multifaceted and complex and can be represented in a number of ways. We were restricted however in the data that were obtained from the QoL survey which does not ask questions specifically related to environmental behavior per se but on indicators of quality of life, socio-economic circumstances, attitudes to service delivery, and psycho-social attitudes, among others. Despite this, we are reasonably satisfied that the proxies we used largely approximate the concepts we employed. Second, generalizations have been made on the socio-economic status of wards (poor/affluent), even though no measures of affluence were conducted in this analysis. Our reference to the socio-economic wealth of wards in Gauteng is based on previous research (see Peberdy, Harrison, and Dinath Citation2017; Katumba, Cheruiyot, and Mushongera Citation2019) as well as prior experience of having resided and visited these wards on numerous occasions over the past three decades. Finally, different respondents were interviewed during each iteration of the survey; therefore, the respondents do not reflect specific individuals’ views over the period under consideration but rather the general attitudes and feelings of people who reside in the same locality. As a result, we do not track the progression of results from the same individuals; instead, we provide a spatially based inference of these feelings from residents of these locations without making individual-level assumptions.
5. Conclusions
In this study, a number of distinct spatial variations in environmental attitudes and place attachment values were identified between central and peripheral wards in the province of Gauteng in South Africa. Results for 2013 and 2015 show a clear spatial pattern in the concentration of positive environmental attitudes and attachment in more affluent central locations in the City of Johannesburg and the City of Tshwane. During this period, the relatively less affluent, peripheral wards exhibited lower levels of environmental attitudes and place attachment. Toward 2017, results also showed decreased place attachment in central wards of the province. These results provide an indication of the complex interplay of factors that need to be taken into account in human-environment relations and their temporal and spatial characterization. Peripheral wards in general expressed more unhappiness about their environment than the central wards although central wards generally expressed decreased place attachment toward 2017. The latter generally comprise more affluent wards than those at the provincial fringes that imply that there is a spatial element in the distribution of environmental sentiments and socio-economic deprivation across the province.
This study has also highlighted the potential of GIS to identify and map human-environment relations. The results of this research also open up possibilities of spatially targeted state interventions for environmental planning and education within the province. These interventions can inform future research in understanding what other factors may potentially impact spatio-temporal patterns or changes of environmental attitudes and place attachment. The spatial clustering and concentration of negative environmental attitudes and attachment depict target areas that need more attention of policymakers to provide better environmental services and resource allocation based on limited provincial resources.
Although context-specific, our study gives an indication of the spatial disparities symptomatic of the inequalities that exist in most urban environments in the country, attributed largely to long-term racial segregation. This, therefore, presents an opportunity for future researchers to investigate whether or not race has a role to play in individuals’ environmental attitudes and place attachment aligned to their place of residence. To what extent have environmental attitudes and feelings of place attachment evolved since democracy in 1994? An examination of the long-term effects that other factors such as migration, displacement, dislocation, and disruption play on individuals’ environmental attitudes and place attachment would also be of value.
Supplementary material
Supplemental data for this article can be accessed here.
Acknowledgments
The authors would like to thank the University of Johannesburg (UJ), the Human Sciences Research Council (HSRC) and the Council for Scientific and Industrial Research (CSIR) for material support during the preparation of this article. The Gauteng City-Region Observatory (GCRO) is also acknowledged for their permission on the use of their data.
Disclosure statement
No potential conflict of interest was reported by the author(s).
Data availability statement
Data used in this research is based on the Gauteng City Region Observatory Quality of Life Surveys for 2013, 2015, and 2017. The questionnaires used in this survey are included as a supplementary file accompanying this research.
Additional information
Funding
Notes on contributors
Simangele Dlamini
Simangele Dlamini received his PhD from the University of Johannesburg, South Africa, in 2020. He is a Researcher at the Geospatial Analytics division at the Human Sciences Research Council, Pretoria.
Solomon G. Tesfamichael
Solomon G. Tesfamichael received his PhD from the University of KwaZulu-Natal, South Africa. He is an Associate Professor at the Department of Geography, Environmental Management and Energy Studies, University of Johannesburg.
Gregory D. Breetzke
Gregory D. Breetzke is an associate professor at the Department of Geography, Geoinformatics and Meteorology, University of Pretoria.
Tholang Mokhele
Tholang Mokhele received his PhD from the University of KwaZulu-Natal, South Africa. He is a Senior Research Specialist at the Geospatial Analytics division at the Human Sciences Research Council, Pretoria.
Notes
1. A ward is the smallest geopolitical subdivision of a municipality used for administrative and electoral (voting) purposes in South Africa.
References
- Andrade, R., K.L. Larson, D.M. Hondula, and J. Franklin. 2019. “Social–Spatial Analyses of Attitudes toward the Desert in a South-western U.S. City.” Annals of the American Association of Geographers 109 (6): 1845–1864. doi:https://doi.org/10.1080/24694452.2019.1580498.
- Anselin, L. 1995. “Local Indicators of Spatial association—LISA.” Geographical Analysis 27: 93–115. doi:https://doi.org/10.1111/j.1538-4632.1995.tb00338.x.
- Apotsos, A. 2019. “Mapping Relative Social Vulnerability in Six Mostly Urban Municipalities in South Africa.” Applied Geography 105: 86–101. doi:https://doi.org/10.1016/j.apgeog.2019.02.012.
- Baierl, T., B. Johnson, and F.X. Bogne. 2021. “Assessing Environmental Attitudes and Cognitive Achievement within 9 Years of Informal Earth Education.” Sustainability 13 (7): 3622. doi:https://doi.org/10.3390/su13073622.
- Borden, R., and A. Schettino. 1979. “Determinants of Environmental Responsible Behavior: Facts or Feelings?” Journal of Environmental Education 10 (4): 35–39. doi:https://doi.org/10.1080/00958964.1979.9941906.
- Breetzke, G. D., and A. L. Pearson. 2014. “The Fear Factor: Examining the Spatial Variability of Recorded Crime on the Fear of Crime.” Applied Geography 46: 45–52. doi:https://doi.org/10.1016/j.apgeog.2013.10.009.
- Brown, G., C.M. Raymond, and J. Corcoran. 2015. “Mapping and Measuring Place Attachment.” Applied Geography 57: 42–53. doi:https://doi.org/10.1016/j.apgeog.2014.12.011.
- Brown, G., P. Reed, and C.M. Raymond. 2020. “Mapping Place Values: 10 Lessons from Two Decades of Public Participation GIS Empirical Research.” Applied Geography 116: 102–156. doi:https://doi.org/10.1016/j.apgeog.2020.102156.
- Chapin, F.S., and C.N. Knapp. 2015. “Sense of Place: A Process for Identifying and Negotiating Potentially Contested Visions of Sustainability.” Environmental Science & Policy 53: 38–46. doi:https://doi.org/10.1016/j.envsci.2015.04.012.
- Chen, N.C., and L. Dwyer. 2018. “Residents’ Place Satisfaction and Place Attachment on Destination Brand-Building Behaviours: Conceptual and Empirical Differentiation.” Journal of Travel Research 57 (8): 1026–1041. doi:https://doi.org/10.1177/0047287517729760.
- Chen, X, M.N. Pieterson, V. Hull, C. Lu, G.D. Lee, D. Hong, and J. Liu. 2011. “Effects of Attitudinal and Sociodemographic Factors on Pro-environmental Behaviour in Urban China.” Environmental Conservation 38: 45–52. doi:https://doi.org/10.1017/S037689291000086X.
- Cheruiyot, K., C. Wray, and S. Katumba. 2015. “Spatial Statistical Analysis of Dissatisfaction with the Performance of Local Government in the Gauteng City-Region, South Africa.” South African Journal of Geomatics 4 (3): 224–239. doi:https://doi.org/10.4314/sajg.v4i3.4.
- Cheung, T.O., and L.H. Hui. 2018. “Influence of Residents’ Place Attachment on Heritage Forest Conservation Awareness in a Peri-urban Area of Guangzhou, China.” Urban Forestry and Urban Greening 33: 37–45. doi:https://doi.org/10.1016/j.ufug.2018.05.004.
- Chigeza, S., V. Roos, and K. Puren. 2013. “Here We Help Each Other”: Sense of Community of People Subjected to Forced Removals.” Journal of Psychology in Africa 23 (1): 97–100. doi:https://doi.org/10.1080/14330237.2013.10820599.
- Cundill, G., J.C. Bezerra, A. De Vos, and N. Ntingana. 2017. “Beyond Benefit Sharing: Place Attachment and the Importance of Access to Protected Areas for Surrounding Communities.” Ecosystem Services 28 (B): 140–148. doi:https://doi.org/10.1016/j.ecoser.2017.03.011.
- Daryanto, A., and Z. Song. 2021. “A Meta-analysis of the Relationship between Place Attachment and Pro-environmental Behaviour.” Journal of Business Research 123: 208–219. doi:https://doi.org/10.1016/j.jbusres.2020.09.045.
- Dominiques, R., and G. Gonçalves. 2018. “Assessing Environmental Attitudes in Portugal Using a New Short Version of the Environmental Attitudes Inventory.” Centre for Marine and Environmental Research 1: 1–18.
- Gao, Y., J. Cheng, H. Meng, and Y. Liu. 2019. “Measuring Spatiotemporal Autocorrelation in Time Series Data of Collective Human Mobility.” Geo-spatial Information Science 22 (3): 166–173. doi:https://doi.org/10.1080/10095020.2019.1643609.
- GCRO. 2015. Quality of Life Survey 2015. Johannesburg: Gauteng City Region Observatory. Accessed 06 June 2018. http://www.gcro.ac.za/research/project/detail/quality-of-lifesurvey-iv-2015/
- GCRO. 2019. GCRO Quality of Life Survey V (2018): Data Report. Johannesburg: Gauteng City Region Observatory.
- Getis, A., and J.K. Ord. 2010. “The Analysis of Spatial Association by Use of Distance Statistics.” Geographical Analysis 24 (3): 189–206. doi:https://doi.org/10.1111/j.1538-4632.1992.tb00261.x.
- Giddy, J.K., and N.L. Webb. 2018. “Environmental Values and Adventure Tourism Motivations.” GeoJournal 83: 1–15. doi:https://doi.org/10.1007/s10708-017-9768-9.
- Heidari, K., S. Heydarinejad, M. Saffari, and A. Khatibi. 2019. “Investigating the Leisure Behavior of Iranians: The Structural Model of Serious Leisure, Recreation Specialization and Place Attachment.” Journal of Policy Research in Tourism, Leisure and Events 13 (1): 77–93. doi:https://doi.org/10.1080/19407963.2019.1694030.
- Hidalgo, M.C., and B. Hernaèndez. 2001. “Place Attachment: Conceptual and Empirical Questions.” Journal of Environmental Psychology 21: 273–281. doi:https://doi.org/10.1006/jevp.2001.0221.
- Holzer, H.J. 1991. “The Spatial Mismatch Hypothesis: What Has the Evidence Shown?” Urban Studies 28 (1): 105–122. doi:https://doi.org/10.1080/00420989120080071.
- Hosany, S., G. Prayag, S. Deesilatham, S. Cauševic, and K. Odeh. 2015. “Measuring Tourists’ Emotional Experiences: Further Validation of the Destination Emotion Scale.” Journal of Travel Research 54 (4): 482–495. doi:https://doi.org/10.1177/0047287514522878.
- Hunter, L.M., S. Strife, and W. Twine. 2010. “Environmental Perceptions of Rural South African Residents: The Complex Nature of Environmental Concern.” Society & Natural Resources 23 (6): 525–541. doi:https://doi.org/10.1080/08941920903357782.
- Katumba, S., K. Cheruiyot, and D. Mushongera. 2019. “Spatial Change in the Concentration of Multidimensional Poverty in Gauteng, South Africa: Evidence from Quality of Life Survey Data.” Social Indicators Research 145: 95–115. doi:https://doi.org/10.1007/s11205-019-02116-w.
- Kollmuss, A., and J. Agyeman. 2002. “Mind the Gap: Why Do People Act Environmentally and What are the Barriers to Pro-environmental Behavior?” Environmental Education Research 8 (3): 239–260. doi:https://doi.org/10.1080/13504620220145401.
- Le, K.G., P. Liu, and L. Lin. 2020. “Determining the Road Traffic Accident Hotspots Using GIS-based Temporal-spatial Statistical Analytic Techniques in Hanoi, Vietnam.” Geo-spatial Information Science 23 (2): 153–164. doi:https://doi.org/10.1080/10095020.2019.1683437.
- Lewicka, M. 2011. “Place Attachment: How Far Have We Come in the Last 40 Years?” Journal of Environmental Psychology 3 (31): 207–230. doi:https://doi.org/10.1016/j.jenvp.2010.10.001.
- Mesch, G.S., and O. Manor. 1998. “Social Ties, Environmental Perception and Local Attachment.” Environment and Behaviour 30: 504–519.
- Moran, P.A.P. 1950. “Notes on Continuous Stochastic Phenomena.” Biometrika 37: 17–23. doi:https://doi.org/10.1093/biomet/37.1-2.17.
- Nyapokoto, R. 2014. “The Road between Sandton and Alexandra Township: A Fanonian Approach to the Study of Poverty and Privilege in South Africa.” Masters diss., University of South Africa, South Africa.
- Orkin, M. 2020. Technical Review of the GCRO QoL Surveys: Synthesis Report. Johannesburg: Gauteng City-Region Observatory. Accessed 20 October 2020. https://gcro.ac.za/research/project/detail/quality-life-survey-10-year-review/
- Pearson, A. L., G. D. Breetzke, and V. Ivory. 2015. “The Effect of Neighborhood Recorded Crime on Fear: Does Neighborhood Social Context Matter?” American Journal of Community Psychology 56: 170–179. doi:https://doi.org/10.1007/s10464-015-9741-z.
- Peberdy, S., P. Harrison, and Y. Dinath. 2017. Uneven Spaces: Central and Periphery in the Gauteng City-Region, 1–315. Johannesburg: Gauteng City-Region Observatory.
- Philippsen, S.J., F.H. Angeoletto, and R.G. Santana. 2017. “Education Level and Income are Important for Good Environmental Awareness: A Case Study from South Brazil.” Ecología Austral 27 (1): 39–44.
- Qu, Y., F. Xu, and X. Lyu. 2017. “Motivational Place Attachment Dimensions and the Pro Environmental Behaviour Intention of Mass Tourists: A Moderated Mediation Model.” Current Issues in Tourism 22 (2): 197–217. doi:https://doi.org/10.1080/13683500.2017.1399988.
- Ramkissoon, H., and F. T. Mavondo. 2017. “Pro-environmental Behavior: Critical Link between Satisfaction and Place Attachment in Australia and Canada.” Tourism Analysis 22 (1): 59–73. doi:https://doi.org/10.3727/108354217X14828625279735.
- Ramkissoon, H., B. Weiler, and L.G.D. Smith. 2013. “Relationships between Place Attachment, Place Satisfaction and Pro-environmental Behaviour in an Australian National Park.” Journal of Sustainable Tourism 21 (3): 434–457. doi:https://doi.org/10.1080/09669582.2012.708042.
- Raymond, M. 2010. “The Measurement Place Attachment: Personal, Community and Environmental Connections.” Journal of Environmental Psychology 30 (4): 422–434. doi:https://doi.org/10.1016/j.jenvp.2010.08.002.
- Roos, V. 2008. “The Mmogo-Method: Discovering Symbolic Community Interactions.” Journal of Psychology in Africa 18 (4): 659–668. doi:https://doi.org/10.1080/14330237.2008.10820249.
- Schultz, P.W., L. Taciano, R.C. Molfont, G.T. Trou, G. Chance, S. Lius, K. Ando, et al. 2014. “Cross-cultural Evidence for Spatial Bias in Beliefs about the Severity of Environmental Problems.” Environment and Behaviour 46 (3): 267–302. doi:https://doi.org/10.1177/0013916512458579.
- Scotts, D., and F.K. Willits. 1994. “Environmental Attitudes and Behaviour: A Pennyslavia Survey.” Environment and Behaviour 2: 239–260. doi:https://doi.org/10.1177/001391659402600206.
- Shaoa, Y., and B. Liu. 2017. “Place Attachment Assessment System in Contemporary Urbanism.” Procedia Engineering 198: 152–168. doi:https://doi.org/10.1016/j.proeng.2017.07.079.
- Shen, J., and T. Saijo. 2007. “The Socioeconomic Determinants of Individual Environmental Concern: Evidence from Shanghai Data.” Osaka School of International Public Policy, Osaka University. Accessed 06 June 2018. http://files/131/07e003.html
- Stats SA. 2011. Mid-Year Population Estimate 2011: Statistical Release P0302. Pretoria: Statistics South Africa.
- Stedman, R.C. 2003. “Is It Really Just a Social Construction? the Contribution of the Physical Environment to Sense of Place.” Society & Natural Resources 16 (8): 671–685. doi:https://doi.org/10.1080/08941920309189.
- Thogersen, J. 2006. “Norms for Environmentally Responsible Behaviour: An Extended Taxonomy.” Journal of Environmental Psychology 26: 247–261. doi:https://doi.org/10.1016/j.jenvp.2006.09.004.
- Tobler, W.R. 1970. “A Computer Movie Simulating Urban Growth in the Detroit Region.” Economic Geography 46: 234–240. doi:https://doi.org/10.2307/143141.
- Triandis, H.C. 1979. “Values, Attitudes and Interpersonal Behavior.” In Nebraska Symposium on Motivation, no. 27: 195–259. University of Nebraska Press.
- Van Liere, K.D., and R.E. Dunlap. 1981. “Environmental Concern: Does It Make a Difference How It’s Measured?” Environment and Behaviour 13: 651–676. doi:https://doi.org/10.1177/0013916581136001.
- Van Veelen, B., and C. Haggett. 2017. “Uncommon Ground: The Role of Different Place Attachments in Explaining Community Renewable Energy Projects.” Sociologia Ruralis 57: 533–554. doi:https://doi.org/10.1111/soru.12128.
- Yang, C., Q. Zhan, S. Gao, and H. Liu. 2020. “Characterizing the Spatial and Temporal Variation of the Land Surface Temperature Hotspots in Wuhan from a Local Scale.” Geo-spatial Information Science 23 (4): 327–340. doi:https://doi.org/10.1080/10095020.2020.1834882.
- Zube, E.H. 1987. “Perceived Land Use Patterns and Landscape Values.” Landscape Ecology 1 (1): 37–45. doi:https://doi.org/10.1007/BF02275264.