
 ?Mathematical formulae have been encoded as MathML and are displayed in this HTML version using MathJax in order to improve their display. Uncheck the box to turn MathJax off. This feature requires Javascript. Click on a formula to zoom.
ABSTRACT
Evaluating how land cover is being transformed is essential to identify patterns necessary to infer the change trajectories and the driving factors. This study considers the case of Nigeria, where various natural ecosystems are being converted and for which a current national scale assessment at high spatial resolution is lacking. Producing 30 m Landsat-based time-series data, we analyze change among land cover types (i.e. tree-covered area, grassland, wetland, waterbody, cropland, artificial surface, and otherland) across seven agroecological zones. The annual change intensity was assessed at multi-levels across two time-intervals (i.e. 2000–2013, 2013–2022). Distinguishing between natural land cover and human activity-related land-use, we estimate the extent of change signifying how humans have appropriated natural land cover. Insights from analysis at the interval level reveal that land transformation accelerated from 3.3% in 2000–2013 to 4.5% during 2013–2022 in all agroecological zones (e.g. rainforest, mangrove), except in Sudan savannah and Sahel savannah where speed was higher in 2000–2013 as grasslands were increasingly cultivated. Cropland expanded almost two-fold (22% to 37%), whereas tree-cover declined from 50% to 31% and wetland from 7% to 3.7% over the 23 years. Much loss of natural land cover (e.g. tree-cover, grassland, and wetland) to cropland occurred in 2000–2013 (22%) when most irrigation schemes in Nigeria were established. In contrast, the loss of natural land cover to settlement (0.9%) during 2000–2013 increased to 2.0% in 2013–2022. Of all agroecological zones, the mangrove zone was most disturbed as its persisting land cover areas reduced from 69% to 5% between 2000–2013 and 2013–2022. The amount of persisting land cover was highest in the Sudan savannah at 44% in 2000–2013 and 49% in 2013–2022. Processes of human-appropriated natural land cover in Nigeria are related to urbanization and cropland expansion into natural areas with some instances of natural regeneration, especially in croplands and abandoned settlement areas.
1. Introduction
The toll on natural resources to provide food, feed, fiber, water, energy, and shelter for more than eight billion people on the planet has never been so great. Converging evidence shows that humans increasingly appropriate natural land cover (e.g. Alexander et al. Citation2016; Twongyirwe, Bithell, and Richards Citation2018; Wang, Wei, and Svenning Citation2023; Winkler et al. Citation2021). Current and timely information on changes to land cover and land-use is essential to maintain ecosystem functions, prevent land resources from degrading, provide accurate carbon accounting, and take land-based climate action (Findell et al. Citation2017; Yue et al. Citation2020). With mounting human pressure on land-based natural resources, evaluating human-appropriated natural land cover (HANLC) will inform use (Akinyemi and Ifejika Speranza Citation2022; Herrmann et al. Citation2020; UNCCD Citation2019).
Knowledge is to be gained from a multiyear assessment of changes to land cover. The case of Nigeria is examined as it is an agroecologically diverse context and a hotspot of land cover change (Akinyemi and Ifejika Speranza Citation2022; FAO Citation2020). While changing land conditions in Nigeria need monitoring, high spatial resolution land cover time-series datasets are lacking. Although the time-series can be provided through Remote Sensing, the potential has not been fully utilized in this context (Ifejika Speranza et al. Citation2023). Most available products are often outdated and provide a one-time snapshot of land cover for single periods, which is inadequate to assess change. In the absence of local or national data, reliance is often on global datasets, which are freely available for use. Global datasets often do not adequately capture local realities and may not be so well suited for local or national level policy action (Akinyemi et al., Citation2021). Nigeria’s most recent national scale analysis of land cover change was only up to 2016 (FAO Citation2020). Thus, knowledge of ongoing changes to land cover at national and local levels is minimal.
A multi-level assessment of the annual intensity of land cover change was conducted using two time-intervals (i.e. 2000–2013 and 2013–2022). Assessing land cover change involves mapping and quantifying transitions among broad land cover types from an initial to a final time point (e.g. tree-covered area conversion to cropland between 2000 and 2022). Land cover transitions to other types are not necessarily permanent over time as any of these three states are possible using the example of tree-covered area: i) tree-covered area transitions to another use (e.g. cropland); ii) tree-covered area remains tree-covered area (i.e. persisting as tree-covered area); iii) tree-covered area transitions to cropland at an earlier period and re-converts back to tree-covered area afterward due to cropland abandonment. A simple analysis of land cover change from an initial time point to a final time point (e.g. 2000 to 2022) may not capture intermediate possible states as in iii. Thus, assessing the intensity and the direction of the observed changes during multiple time intervals is essential to better understand land cover dynamics (Akinyemi, Pontius Jr., and Braimoh Citation2017).
We examined the intensity of change at the interval and category levels and by agroecological zones (AEZ). The interval level analysis provides the speed at which land was transformed during an interval and compares this across all time-intervals. In contrast, the change intensity for each category is computed in terms of its gross loss and gross gain during each time-interval (Aldwaik and Pontius Citation2012). The AEZ level analysis calculates the intensity of land cover change per category for each zone. Analyzing LULC at AEZ levels enables considering the diverse agroecological contexts across Nigeria. Limiting further analysis to major change patterns exemplifying human activities, we estimated the extent of HANLC, identified the processes and drivers as well as outcomes along agroecological gradients for which little work has yet been done in Nigeria.
The objectives of this study are three. First, we produced land cover data in Nigeria for three time points (i.e. 2000, 2013, 2022). Second, we conducted a multi-level assessment of the annual intensity of land cover change during 2000–2013 and 2013–2022 across seven AEZs. Third, we estimated the extent of change in HANLC areas resulting in the loss of natural land cover such as in tree-covered areas, wetlands, and grasslands. The following subsections describe the methods used to create the land cover datasets and quantify the annual intensity of change across time-intervals. We present the results of the multi-level analyses of change intensity during each time-interval and how this differed between categories in AEZs. Further, we present and discuss the drivers and processes of HANLC changes. This study contributes to efforts to monitor anthropogenic-induced land cover changes in predominantly tropical forest-agriculture mosaic landscapes.
2. Materials and methods
2.1. Study area
Nigeria’s land area is ~ 910,731 km2. With an estimated 223,804,632 million inhabitants (2.8% of the world’s population), it is the most populous African country (Department of Drought and Desertification Amelioration Citation2018; UNFPA Citation2023). It is bordered in the south by the Atlantic Ocean and has Niger, Benin, Cameroon, and Chad as neighbors ().
Figure 1. Nigeria a) Agroecological zones, major settlements, and Local Government Areas (3rd administrative level), b) Biophysical map depicting elevation, topography, major rivers and lakes.
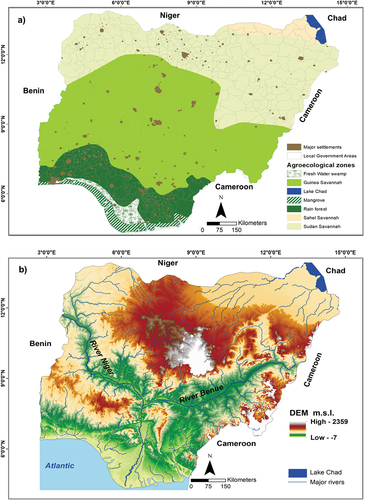
Nigeria stretches across multiple latitudes with diverse agroecological conditions () and elevation (). Agroecological conditions range from the ultra humid in the mangrove, freshwater swamps – FWS and Rainforests – RaF (>2000 mm yr−1 rainfall and monthly temperature (tmin/tmax) of 23–33°C), sub-humid in the Guinea Savannah – GS (>1000 mm yr−1 rainfall and 20–37°C tmin/tmax) to the Sudan Savannah – SS and Sahel Savannah – SaS (440–600 mm yr−1 rainfall and 13–40°C tmin/tmax) (Iloeje Citation2001; Adelodun, Choi, and Echodu Citation2018). Lake Chad, in the country’s northeast, is a Ramsar site differentiated from the SaS due to its lacustrine context. In most regions, the rainy season is from March/April to October, with the southern part having bimodal rainfall distribution, whereas the dry season (Harmattan) is from November to March.
2.2. Workflow
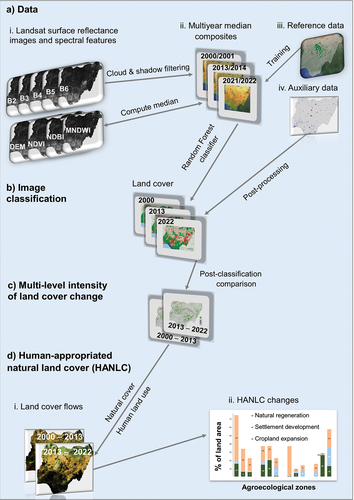
The steps in the workflow, depicted in , are a) Data collection and image preprocessing, b) Image classification and change detection, c) Multi-level assessment of the intensity of land cover change, and d) Evaluating HANLC changes. Reference data were collected both on the field and from high resolution images in Google Earth ProⓇ (GEP). Preprocessing and classification were conducted in Google Earth EngineⓇ (GEE), and post-processing was done in QGIS/ArcGIS.
Figure 2. Workflow. a) Input data, i–ii. Preprocessing of images and multiyear composites — Surface reflectance median bands, Normalized Difference Vegetation Index (NDVI), Modified Normalized Difference Water Index (MNDWI), Normalized Difference Built-up Index (NDBI), iii. Reference datasets used for training and validation, iv. Auxiliary data for post-processing land cover maps for misclassified settlements and wetlands. b) Image classification of land cover with Random Forest classifier for 2000, 2013, 2022. c) Intensities of land cover change computed at the interval and category levels for 2000–2013, 2013–2022. d) Human-appropriated natural land cover (HANLC), i. Land cover flows between natural land cover types and human activity-related land-uses, ii. Estimates of HANLC changes by agroecological zones.
2.3. Data collection and image processing
The multi-level assessments of annual change intensity (rate) and HANLC were conducted using datasets of the highest quality selected based on availability. Datasets used are satellite remote sensing images, reference data collected from the field and GEP, which were needed for image classification and validation, and other datasets such as the Nigerian boundary used to constrain analyses to the study area. provides the details of these datasets.
Table 1. Datasets used in this study.
2.3.1. Satellite data and preprocessing
The median of Landsat 7 (ETM+) and 8 (OLI) 30 m surface reflectance tier 1 image bands (henceforth LSR) () were used to create multiyear image composites for 2000/2001, 2013/2014, and 2021/2022 (). Only LSR was used for comparability because it meets the geometric and radiometric quality requirements for multitemporal and multispectral land cover mapping (USGS 2021). LSR is spatially registered and atmospherically corrected, including orthorectification (Main-Knorn et al. Citation2017). Atmospheric correction involves calibrating raw digital numbers to Top of Atmosphere reflectance to account for solar elevation and seasonally variable Earth-Sun distance, which is then corrected to surface reflectance (Young et al. Citation2017). Surface reflectance images have reduced variability between multiple images of different dates over the same area (Pons et al. Citation2014). For further details about processing LSR images from various Landsat missions, including the algorithms used, see USGS (2023).
We filtered the LSR images for cloud and cloud shadows using mainly the Landsat QA_PIXEL band and retained only images with ≤70% cloud cover. After cloud filtering, some images had gaps as some pixels were without data, especially for the year 2000, whereas gaps were minimal in images of other years. Since single-date or monthly image composites were not optimal for use due to excessive cloud cover and cloud shadows in the coastal regions, these necessitated creating multiyear composites with images from the immediate previous and subsequent years (i.e. 2000/2001, 2013/2014, and 2021/2022). Afterwards, we computed the median of each LSR image band in the multiyear image composites. Three spectral features that are beneficial in capturing the biophysical conditions of the land surface were computed from the median bands as in Eqs. 1–3. These spectral features are the Normalized Difference Vegetation Index (NDVI), Modified Normalized Difference Water Index (MNDWI), and the Normalized Difference Built-up Index (NDBI). The MNDWI is especially useful for distinguishing surface water features often correlated with built-up areas in other spectral indices (Mack et al. Citation2017).
With the vast geographic size of Nigeria, preprocessing and classifying more than 2400 images per time point, as in this study, would have been very computationally demanding and time-consuming without access to the cloud computing platform (i.e. GEE).
2.3.2. Reference data
We created 55 data samples per category for training and validating the classified maps (). Using stratified sampling ensures sufficient samples of each class are produced and well-distributed (McRoberts et al. Citation2018). The seven strata are tree-covered areas, grassland, cropland, wetland, artificial surfaces, otherland, and waterbody. Fieldwork for collecting samples of land cover was conducted in 2022 (July – November). For 2000 and 2013, reference datasets were independently generated in GEP and from the USGS land-use maps (USGS-WA) of 2000 and 2013, respectively (Tappan et al. Citation2016). USGS-WA, comprising 26 categories for West Africa, was validated by national partners (Cotillon and Mathis Citation2017; Cushing et al. Citation2016). Sampling points generated from USGS-WA were cross-checked for correctness using images in GEP. This latter step minimized the potential transfer of errors from existing maps to the samples generated. Some studies utilizing USGS-WA maps are Herrmann et al. (Citation2020) and Barnieh et al. (Citation2022).
2.3.3. Auxiliary data
AEZ boundaries were used as mapping units for analyzing land cover change intensity. The outline of fragmented and cultivated wetlands (e.g. Hadejia-Nguru, Lake Chad) were digitized in GEP for year 2000, 2013, and 2022. The JRC built-up surface datasets for 2000, 2015, and 2020 were used to create settlement masks as binary maps for each time point in ArcGISⓇ for postprocessing the land cover maps (see ).
2.4. Image classification
For image classification, the median blue, green, red, NIR, and SWIR LSR bands and the three spectral features were used ().
2.4.1. Classification scheme
We used the United Nations Convention to Combat Desertification (UNCCD) classification scheme comprising seven categories (). This scheme was used to support Nigeria’s Land Degradation Neutrality (LDN) baseline setting (2000–2015) and monitoring till 2030 (Sims et al. Citation2021).
Table 2. The classification scheme used in this study.
2.4.2. Land cover mapping and accuracy assessment
Applying the Random Forest (RF) machine learning algorithm, we produced land cover maps for 2000, 2013, and 2022 (). RF is an ensemble method suitable for classifying categorical values as used in land cover maps (Breiman Citation2001; Pelletier et al. Citation2016). For the three time points for mapping land cover, 300 trees were used with the nodes per split set as the square root of the total number of input variables (Akinyemi, Ghazaryan, and Dubovyk Citation2021). As a decision tree-based method, RF is applied to massive datasets owing to its computational simplicity and robustness to handle noise and overtraining. As a non-parametric test, normality is not assumed (Löw, Conrad, and Michel Citation2015). It is less dependent on strong a priori assumptions about a class’s statistical properties (Canty Citation2019; Schonlau and Zou Citation2020).
We computed the overall accuracy (OA), user accuracy (UA) and producer accuracy (PA) to validate the land cover maps produced. Wetlands were difficult to distinguish from croplands when cultivated or when the spectral reflectance from the inundated vegetation resembles the reflectance from other vegetation types. Classifying settlement pixels in rural areas in highly forested regions was also problematic. Class confusion necessitated relabeling misclassified pixels using the wetland and settlement binary masks created for post-processing.
2.5. Multi-level assessment of the intensity of land cover change
Land cover maps of 2000, 2013 and 2022 were used as input for change detection during two time-intervals (i.e. 2000–2013 and 2013–2022). Applying the post-classification bi-temporal method, we derived a change matrix of transitions between categories using a per-pixel-based approach overlaying independently classified images of two time points (Akinyemi and Mashame Citation2018; Young et al. Citation2017). Change patterns between land cover categories are to be detected for each time-interval to compute the multi-level annual intensity of observed changes. With the interval’s initial time in the rows and the final time in the columns, the matrix expresses the land area under each category and quantifies land transitions between categories. A change budget that explicitly quantifies each category’s persistence, gains, and losses during the time-intervals is provided. The annual intensity of land cover change was quantified () at time-interval and category levels using the Intensity Analysis as in EquationEqs. 4(4)
(4) -Equation6
(6)
(6) (annotations are in ) (Aldwaik and Pontius Citation2012).
Table 3. Mathematical notation for computing annual intensities of land cover change patterns following Aldwaik and Pontius (Citation2012).
The intensity of annual change (St) during interval [Yt,Yt +1], is computed as the size of the change divided by the length of the time-interval and expressed as a percentage of the spatial extent. This provides the speed at which land was transformed during an interval (Akinyemi, Pontius Jr., and Braimoh Citation2017).
Analyzing change between land cover categories involves a gaining category and a losing category as the loss of one category is the gain of another category (Aldwaik and Pontius Citation2013). Thus, loss at the category level (Lti) is computed as the observed intensity of the annual gross loss of the losing category i during interval [Yt,Yt +1] divided by the size of category i at the initial time point t (Eq. 5). In contrast, for gain (Gtj), the annual gross gain of the gaining category j during interval [Yt,Yt +1] is divided by the size of category j at time t+1 as in Eq. 6.
Examining the intensity of annual change at these different levels is essential to gauge the speed at which land transformation occurred during an interval and how these varied between land cover categories.
2.6. Evaluating human appropriation of natural land cover
This study defines human-appropriated natural land cover (HANLC) as the conversion of natural land cover (NLC) into predominantly human activity-related land-use (HLU). This required differentiating between NLCs and HLUs. Although NLCs are not entirely excluded from human use in Nigeria, they are differentiated from HLUs because they are not cultivated or developed. For example, although grasslands are subject to high grazing intensities, especially in SS and SaS, they were grouped as NLC since grasslands occur naturally in Nigeria (Jimoh et al. Citation2020).
Focusing on major processes of observed change patterns, transitions between land cover categories were aggregated into HANLC classes for each time point (i.e. 2000, 2013, 2022). HANLC classes are: 1) Cropland expansion, 2) Settlement and infrastructure development (SID), and 3) Natural regeneration and afforestation (NRA) comprising areas of NLC recovery. The first and second classes are areas where HLU expanded into NLCs. We estimated the extent and changes of HANLC during both time-intervals. The latter formed the basis for identifying the drivers and processes underlying the observed HANLC changes across AEZ and at the national level ().
3. Results
Against the backdrop of monitoring land transformation in Nigeria, maps of land cover patterns (i.e. the spatial and temporal configuration) and changes over the 23 years are presented. Beyond mapping land cover change, this study measured the intensity of change patterns at multi-levels, including between land cover categories and AEZs as well as the extent of human appropriation of natural land cover.
3.1. Evaluating mapping accuracy
Accuracies with which the images were classified into seven land categories are summarized in .
Table 4. User, producer and overall accuracy for each category.
Compared to other categories, waterbody and otherland were well classified with high UA and PA values, except when otherland was confused with grassland, especially in 2022. Wetlands were mostly confused with croplands and sometimes tree-covered areas. For example, cultivated wetlands are difficult to distinguish from croplands. Wetland confusion with tree-covered area mainly occurred in riparian and flooded forests due to forest inundation. Artificial surfaces were not well captured in the classification, especially rural settlements occurring in forest-agriculture mosaic landscapes, because of their small size. See further details in the supporting materials https://zenodo.org/doi/10.5281/zenodo.8205098.
3.2. Varying spatial configurations of land cover
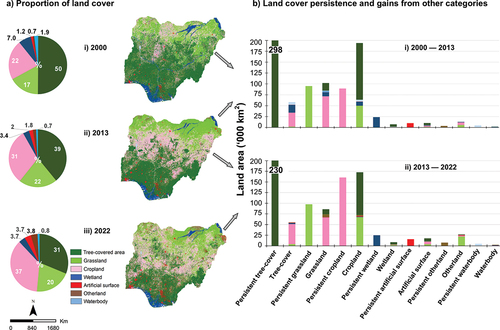
Land cover configuration varied between 2000, 2013, 2022 () and the dynamics during 2000–2013 and 2013–2022 (). The amount of persistent land cover and gains per category from other categories were quantified. In 2022, cropland had the largest share of land (37%) of all seven categories, followed by tree-covered areas at 31%. This contrasts with the land cover configurations of other years. Tree-covered areas declined from approximately 455,000 km2 in 2000, 357,000 km2 in 2013 to 285,000 km2 in 2022 — the converted tree-covered area (170,000 km2) corresponds to a size slightly larger than Tunisia (155,360 km2). Cropland expanded from approximately 200,000 km2 in 2000, 284,000 km2 in 2013, to 333,000 km2 in 2022. Cropland in Nigeria grew by about 5700 km2 yr−1 assuming a uniform annual amount of cropland gain over the 23-year study period – gained cropland area (131,000 km2) corresponds to a size slightly larger than Greece (130,647 km2). There was a steady increase in artificial surfaces from approximately 1.2% (10,500 km2) in 2000, 2% (20,300 km2) in 2013 to 3.7% (33,400 km2) in 2022. Wetlands reduced from about 7% (63,600 km2) in 2000, to 3.4% (31,300 km2) in 2013 but increased to 3.7% (33,500 km2) in 2022.
Figure 3. Land area of each category a) Proportion of land per category (%) and the spatial distribution in ai) 2000, aii) 2013 and aiii) 2022. bi) Amount of persisting land cover and land area (km2) gained by each category from other land cover types during the first time-interval (2000–2013) and, bii) second time-interval (2013–2022). Note that actual values of persistent tree-cover are depicted on the bars. Appendix 1 provides an overview of changes by category during each time-interval.
3.3. Land cover change budget
In the context of land cover change accounting, a budget was created per land category to provide insights into the gains, losses, and persistence of that category during both time-intervals. Each category’s gains, losses and persistence are depicted in . Otherland (), artificial surface (), cropland () and grassland () were net-gaining categories during both time-intervals, whereas tree-covered area () was a net-losing category across both time-intervals. In contrast, wetland () and waterbody were net-losing categories in 2000–2013 but were net-gaining in 2013–2022 ().
Figure 4. The change budget per land cover category during both time-intervals (2000–2013, 2013–2022). Each category’s gains, persistence and losses are shown as a percentage of the study area (+ means net gain, – means net loss).
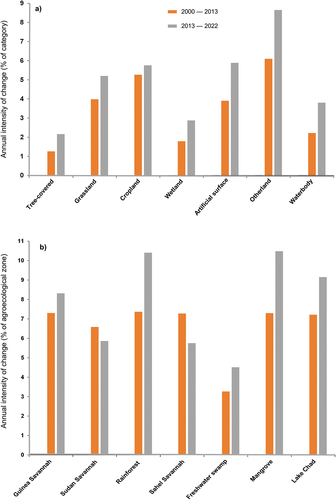
3.4. Multi-level intensity of land cover changes from 2000–2013 to 2013 – 2022
The overall intensity of annual change during an interval, capturing the speed of land transformation, increased from 3.3% in 2000–2013 to 4.5% in 2013–2022. We further quantified the intensity at which land cover change occurred at the category level and by AEZs (). depicts the observed intensity of annual gross gain for each category during both time-intervals. The annual change intensity among land cover categories () increased from 2000–2013 to 2013–2022 for all categories. Thus, annual change intensities were higher in the second time-interval than in the first time-interval. Otherland had the highest intensity of change during 2000–2013 (6.1% yr−1) which increased in 2013–2022 to 8.7% yr−1. At the level of the AEZs, annual change intensity mainly increased from 2000–2013 to 2013–2022, similar to the increasing trends at the category level. The change intensities were higher during 2013–2022 in all AEZs except SS and SaS whose rates were higher in 2000–2013. The annual change intensity increased in the mangrove zone from 7.3% yr−1 in 2000–2013 to 10.5% yr−1 in 2013–2022, whereas for RaF, the change intensity increased from 7.4% yr−1 to 10.1% yr−1 over the same periods.
Figure 5. Annual observed intensity of change during two time-intervals, 2000–2013, 2013–2022 (a) Annual intensity of change among land cover categories, (b) Annual intensity of change by agroecological zones.
3.5. Agroecological zone gradients of land cover change
The proportion of land in areas of change and persisting land cover in AEZs are depicted in . See further details about the proportion of land in change areas by AEZs without persisting land cover in https://zenodo.org/doi/10.5281/zenodo.8205098.
Figure 6. Persisting and major land cover transitions by agroecological zones during 2000–2013 and 2013–2022.
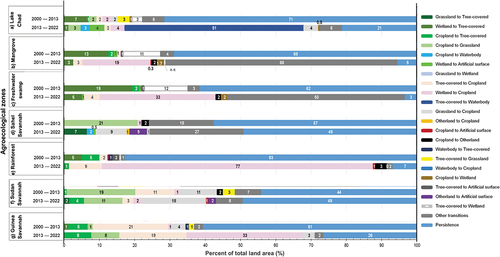
Wetland conversion to cropland was higher during 2013–2022 in RaF (77%), FWS (33%), GS (33%), and mangrove (19%). Tree-cover loss to cropland was higher in 2000–2013 in GS (21%) and SS (11%), whereas tree-cover gains from cropland was higher in 2013–2022 in GS (8%). The conversion of croplands to grasslands was highest in the SaS (21%) and SS (19%) during 2000–2013. Wetland conversion to tree-cover was higher during 2000–2013 in FWS (19%) and mangrove (13%). Many persistent areas were lost over time such as in the mangrove zone, which reduced from 69% in 2000–2013 to 5% in 2013–2022. In contrast, persistent areas in SS increased from 44% in 2000–2013 to 49% in 2013–2022.
3.6. Human appropriation of natural land cover
We differentiated NLCs from HLUs and aggregated these changes into these three HANLC classes, 1) Cropland expansion, 2) Settlement and infrastructure development (SID), 3) Natural regeneration and afforestation (NRA).
3.6.1. Trajectories of natural and human-appropriated natural land cover
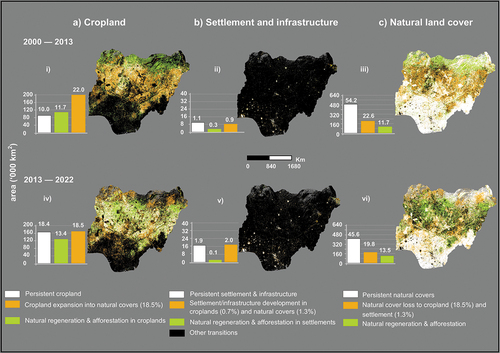
Nine trajectories of HANLC were identified in each time-interval (). depicts the three most prominent ones. NLC displacement by cropland decreased from 196,000 km2 (21.7%) in 2000–2013 to 167,000 km2 (18.4%) in 2013–2022, whereas NLC displacement by SID increased from approximately 7800 km2 (0.9%) in 2000–2013 to 11,000 km2 (1.2%) in 2013–2022. Cropland displacement by SID increased from 200 km2 (0.03%) in 2000–2013 to 6000 km2 (0.7%) in 2013–2022. Settlement persistence increased from 10,000 km2 (1.1%) in 2000–2013 to 17,195 km2 (1.9%) in 2013–2022. NRA increased from 105,000 km2 (11.7%) over croplands and 400 km2 (0.04%) over settlements in 2000–2013 to 120,000 km2 (13.4%) over croplands and 2,000 km2 (0.1%) over settlements in 2013–2022. Despite the considerable amount of persisting NLC, it reduced from about 490,000 km2 (54.2%) in 2000–2013 to 410,000 km2 (45.6%) in 2013–2022.
Figure 7. Major trajectories of natural and human-appropriated natural land cover (‘000 km2) during 2000–2013 and 2013–2022) in areas of (a) Cropland, (b) Settlement and infrastructure (c) Natural land cover. Using 2013–2022 as an example, actual percentages are shown in the legend to highlight how the values of the land cover transitions between the classes match. For example, 18.5% of cropland expansion into natural land cover in 2013–2022 (Fig. a–iv) is a subset of the 19.8% lost by natural cover to cropland and settlement in Fig. c–vi.
3.6.2. Agroecological zone gradient of HANLC processes and drivers
We related observed HANLC change patterns to drivers and processes underlying these changes in each AEZ (). depicts the extent of these broad HANLC changes across AEZs (less aggregated values of HANLC changes are provided as supporting information (https://zenodo.org/doi/10.5281/zenodo.8205098).
Figure 8. Extent of human-appropriated natural land cover in agroecological zones.
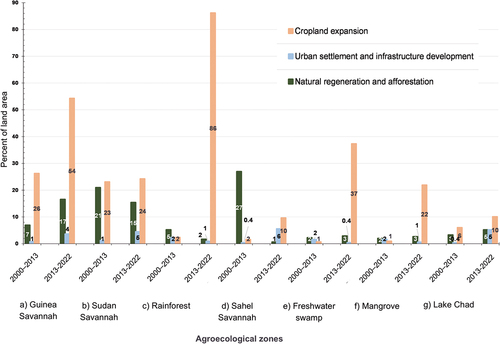
More details of the drivers and processes are provided in , which shows values for individual HANLC changes. The NRA process, for example, through tree-cover regeneration in croplands, drove changes to land cover. The type of NRA differed between tree-cover or grassland expansion into croplands. The former was the highest in the guinea savannah (GS) (5.5% in 2000–2013 and 7.9% in 2013–2022). In contrast, grassland expansion into cropland, which was higher in 2000–2013 than in 2013–2022, was approximately 21% in Sahel savannah (SaS) and 19.5% in Sudan savannah (SS). Despite the limited land area involved, settlement and infrastructure development (SID) expansion drove natural land cover (NLC) decline, mainly over tree-cover in 1.9% of the total area of the RaF in 2000–2013, whereas SID encroached into other NLCs aside tree cover in GS (13.6%) and RaF (5.7%) in 2013–2022. In contrast, cropland expansion into NLC (e.g. tree-cover) was highest in GS during 2000–2013 (21.4%), whereas it was 19% in 2013–2022. Further, the loss of wetlands to croplands by agroecological zones (AEZs) was highest in 2013–2022. In these four AEZs and in this order, rainforest (RaF) (76.8%), GS and freshwater swamp (FWS) (32.8%), and mangrove (19.3%). NLC degradation (e.g. tree-cover loss to otherlands signifying land degradation), was highest in SS (5.9%) in 2000–2013 than in any other AEZ. Although cropland degradation, leading to conversion into otherland, was minimal, values were higher in 2013–2022 in SaS (0.77%) and in SS (0.6%).
Table 5. HANLC changes expressed as percent of total land area in agroecological zones, where the upper number is 2000–2013 and the lower number is 2013–2022.
4. Discussion
4.1. Image classification and land cover mapping
Maintaining the same methods necessitated using only data from Landsat as it had the longest record. Consequently, this study did not use higher resolution multispectral images such as Sentinel-2. There were seasonal variations in vegetation cover and perpetual cloud cover in AEZs such as mangrove, FWS, and RaF. Hence, only multiyear composites were used for mapping land cover instead of single or monthly composites. The low OA recorded in 2000 is probably related to the excessive cloud cover in the composite. Including the median values of each LSR band, NDVI, NDBI and MNDWI in the composites improved the classification results. Our findings, however, differed from most previous studies (e.g. Alademomi et al. Citation2022; Grigoras and Uritescu Citation2019) in that the effect of NDBI on the image classification for Nigeria was negligible or sometimes reduced the accuracy.
Identifying artificial surfaces and wetlands was difficult, especially for rural settlements in highly forested regions such as in RaF. Wetlands were difficult to distinguish from cropland when cultivated. Other affected categories are croplands, which were mostly confused with tree-covered areas in RaF. In these tropical forest-agriculture mosaic landscapes, trees and tree-crops on the farms and the small farm sizes made differentiating croplands from tree-covered areas difficult.
4.2. The intensity and drivers of land transformation
This study assessed and characterized persisting land cover and change across Nigeria (2000–2022). It differentiated the 23-year study period into two time-intervals (i.e. 2000–2013, 2013–2022). Land cover types such as cropland, grassland, otherland and artificial surfaces were net gaining categories as these expanded into other categories, whereas tree-covered area was a net losing category. Further, we examined the change intensity at the interval and category levels and by AEZ. Results from the interval level analysis revealed that the intensity of annual change increased from the first to the second time-interval. This implies that the speed at which land was transformed accelerated during the last decade in Nigeria. The increasing intensity of annual change in all AEZs from 2000–2013 to 2013–2022 further confirms this trend except in SS and SaS where the intensity was higher in 2000–2013. Our analysis of the transitions involving cropland reveals that the higher intensity of change in the SS and SaS during 2000–2013 was mainly due to cropland expansion into grasslands and otherlands. Cropland expansion into grasslands and otherlands in these arid AEZs in 2000–2013 was made possible by irrigation schemes, e.g. Talata Mafara on Sokoto-Rima River basins (Adelodun, Choi, and Echodu Citation2018). This trend of cultivating otherlands and grasslands was also found in Egypt, Algeria, Morocco (Bouaroudj et al., Citation2019; Molotoks et al., Citation2018).
Cropland occupied 37% of the land area in Nigeria as of 2022, mainly due to expansion into tree-covered areas and grasslands, especially in the Guinea Savannah (GS), Rainforest (RaF), Freshwater Swamp (FWS) and Mangroves during 2013–2022. Forty-six (46%) and 18% of cropland areas in 2000–2013 were derived from tree-cover and grasslands and in 2013–2022, 30% and 20% of cropland areas were in displaced tree-cover and grasslands. Confirming cropland to be the main land-use in Nigeria, our estimate of cropland extent aligns closely with the Central Intelligence Agency (Citation2023) estimates of 37.3% for arable land as of 2018, whereas FAO (Citation2020) estimate was 42% as of 2016. That majority of existing croplands persisted is confirmed by Onilude and Vaz (Citation2020), which found greater cropland compactness. Agriculture is an essential economic sector in Nigeria, accounting for 24% of the GDP in 2020, with 70% of its over 200 million population dependent on it (National Bureau of Statistics Citation2022).
As croplands expanded in Nigeria, so were they lost due mainly to settlement expansion, tree-cover and grassland through land degradation processes. The loss of tree-cover regeneration and croplands to grassland signify land degradation as these agro- and forest ecosystems become grasslands (e.g. Adenle, Boillat, and Ifejika Speranza Citation2022; Akinyemi and Ifejika Speranza Citation2022; Onilude and Vaz Citation2020). Urban built-up encroached agricultural rural landscapes, forests, and wetlands. Settlement expansion into wetlands occurred in all marine AEZs (e.g. FWS and mangrove), making urbanization a significant driver of wetland loss in Nigeria despite the limited land area. For example, the main feature of settlement expansion in the Lagos conurbation is wetland reclamation in the Lekki Peninsula and Eko Atlantic City (EAC Citation2012; Obiefuna et al. Citation2013).
In contrast, tree-covered area was a net losing category from 2000 to 2022 due to cropland and grassland expansion. In 2000–2013, 4.9% of tree-cover were displaced by grassland, whereas 4.2% of tree cover was lost to grassland in 2013–2022. The finding of a decreasing trend in tree-cover due to agriculture and grassland encroachment in 2000–2013 and 2013–2022 is corroborated by previous studies (e.g. Aruofor Citation2000; Akinyemi Citation2013; FAO Citation2020). For example, tree-cover loss to cropland in GS and RaF can be partly attributed to policies favoring export-oriented cash cropping (e.g. the 1980–1990 trade liberalization policy) (Akinyemi Citation2013). Estimated as occupying 31% of Nigeria’s land area in 2022, this study’s estimate of tree-cover exceeded the 2016 Hansen data-based forest estimate of 24% for Nigeria (FAO Citation2020). This probably is because the tree-covered area class in the UNCCD scheme is broader, comprising forest, savanna, woodland, thicket, and plantation.
Of all AEZs, the mangrove zone was the most disturbed as persisting areas reduced from 69% in 2000–2013 to 5% in 2013–2022. Mangrove forest loss is also driven by the impact of oil spills in the Niger Delta at the coast (Gundlach Citation2018; Mzaga et al. Citation2021). Charcoal-induced deforestation also drives tree-cover loss in Nigeria (Omeje Citation2021) due to charcoal production for domestic use and export (Huitink Citation2018; Salamatu et al. Citation2021; Van Wesenbeeck et al. Citation2016). Huitink (Citation2018) estimated that the 147 ktonnes of Nigerian charcoal imported into the European Union in 2016 would require about 120 km2 of forest cut with an assumption of tree harvest for producing charcoal without replanting. Results also show tree-cover gains in croplands in 2013–2022. This trend is confirmed by Azeez (Citation2018) and Arowolo and Deng (Citation2018). Azeez (Citation2018) noted vegetation regrowth in croplands and settlements in areas where civil conflict forced people to abandon land.
4.3. Human-appropriated natural cover
Differentiating between natural land cover (NLC) and human-related land use (HLU), we estimated how much humans have appropriated NLC over time. Drivers and processes underlying HANLC changes were related largely to artificialization due to settlement and infrastructure development, cropland expansion resulting in NLC decline, and natural regeneration and afforestation. HANLC changes led mostly to declining NLCs due to conversion of forests, wetlands and grasslands to cropland and settlements. The main drivers of NLC loss were agriculture-induced deforestation due to the conversion of tree-cover and grassland to cropland; wetland converted into croplands, artificial surfaces, and grassland degradation, resulting in primarily barelands. These results, revealing heightening socioeconomic and environmental pressures in Nigeria, are corroborated by previous studies (e.g. Herrmann et al. Citation2020 Salamatu et al., Citation2021;). Studies confirm forest loss due to cropland expansion in other parts of Africa (e.g. Akinyemi and Ifejika Speranza Citation2022; Turubanova et al. Citation2018).
NLC gains were limited despite expanding into croplands and some settlements during both time-intervals. NLC increase in croplands was highest in the SaS and SS during 2000–2013. This trend of NLC increase in the semi-arid AEZs is likely the result of natural regeneration, reforestation and afforestation efforts. The is confirmed by the greening trends of increasing woody species in some Sahelian countries (Mbow et al. Citation2015; West et al. Citation2017). Thus, the regeneration of NLC in croplands contributed to driving land cover changes in Nigeria. For example, NLC expansion into croplands was highest in the GS.
5. Policy implications and conclusions
Recent advances in satellite image data capture and free access to geospatial cloud computing (Xu et al. Citation2020) enabled this study to create land cover maps of 2000, 2013, and 2022 over Nigeria. Using the same methodologies and classification schemes, we made 30 m Landsat-based time-series of systematically produced land cover datasets. This study filled the gap of a current national scale evaluation of land transformation in Nigeria, which is still lacking. It provides an overview of how land cover changed, the spatial extent and annual intensity of land cover change at multi-levels during two time-intervals (i.e. 2000–2013, 2013 – 2022). Improved knowledge of the Nigerian context has been gained from this assessment of human-appropriated natural land cover. These analyses likely reflect the prevailing economic and policy contexts in which land transformation occurred. For example, the annual change intensity increased from 2000–2013 to 2013–2022, implying accelerating speed of land transformation.
As part of Nigeria’s commitment to a low-carbon development path and transition toward Land Degradation Neutrality, it targeted zero forest and wetland loss and a 20% forest cover increase by 2020 compared to 2015 estimates (Government of Nigeria Citation2018). However, Nigeria lost more natural land covers between 2000 and 2022, so more concerted scientific and policy efforts with societal support are required to reach the set targets. The Nigerian economy grew 7.4% annually between 2000 and 2013 before reducing to 1.9% during 2013–2022 due to dwindling oil revenue, financial crises and COVID-19 impacts. That cropland expanded in both time-intervals is reflected in agriculture’s contribution to GDP in Nigeria which rose from 21.4% (2000), 23.3% (2013), 22% (2020) to 23.7% in 2022 (World Bank and OECD National Accounts data Citation2023). Cropland expansion can be partly attributed to the focus of the agricultural and land policies implemented. For example, the 2012 Agricultural Transformation Agenda and Agricultural Promotion Policy (2015–2020) aimed at harnessing more arable lands for food production. Nigeria underwent a process of cropland extensification with an overall net decrease in yield per land area cultivated, like the situation in ~ 40% of African countries (Akinyemi and Ifejika Speranza Citation2022). Ensuring that cropland intensification is sustainable is essential to harness the potential of existing croplands in Nigeria. Food must be produced environmentally-friendly without necessarily expanding croplands while preventing croplands from degrading (Adenle, Azadi, and Manning Citation2017; Govers et al. Citation2017).
Much loss of croplands is related to natural regeneration such as in degraded croplands, settlement expansion and land degradation. Major implications of agricultural land loss are that more remote and marginal lands tend to be farmed, resulting in more clearing of tree-cover and loss of grasslands which is not good for biodiversity that are acclimatized to grassland ecosystems (Bär, Akinyemi, and Ifejika Speranza Citation2023). Grassland conversion to cropland implies lower productivity as grasslands are mainly in areas with lesser rainfall and lower soil fertility in the Nigerian context. To maintain or increase crop yields, an increasing need for external inputs (e.g. water and fertilizer) is likely. Since many African farmers are smallholders and resource-poor, accessing such inputs is a challenge hence the prospects for maintaining or improving food production based only on smallholders’ capacities are low. Strong institutions are needed if broad-scale support that limits the environmental burdens of inputs is to be provided to farmers (Schouten, Vink, and Vellema Citation2018) such as developing sustainable low-input agriculture (Poortinga et al. Citation2019).
The increasing urbanization trend in Nigeria during both time-intervals is confirmed by previous findings (e.g. Arowolo and Deng Citation2018; Onilude and Vaz Citation2020; Tappan et al. Citation2016). Settlement expansion in the southern part of Nigeria forms a part of the West African urbanization hotspots, extending along the coast from Monrovia (Liberia), Abidjan (Côte d’Ivoire), Accra (Ghana), Lagos, Ibadan, Benin-City, Onitsha (Nigeria) to Douala (Cameroon), a stretch of 3045 km (Akinyemi and Ifejika Speranza Citation2022). This study did not cover how human appropriated natural land cover (HANLC) changes affect ecological sustainability over time and space over Nigeria. Despite this limitation, insights revealing the dominance of land cover transitions to and from cropland, especially agriculture-induced tree-cover loss, provide a basis for future research. It is imperative to consider the effects of markets and trade in driving agricultural land change, especially impacts of telecoupled demand for land-based produce (e.g. cocoa and cassava). For example, the environmental impacts of tropical forest loss due to export-oriented agriculture illustrate the shift of the social-ecological burdens to the tropics (De Sy et al. Citation2015; Twongyirwe, Bithell, and Richards Citation2018). This situation contrasts with ongoing forest management, afforestation, and agricultural abandonment in most of the global North (Winkler et al. Citation2021; Yue et al. Citation2020).
Our findings relating to land cover changes have implications for future land cover and land use in the studied region. For instance, tree-covered area covered a considerable area of the country in 2022 at 31% compared to its former expanse in 2000 (50%). Although it was the largest land cover in 2000, it declined by 2022 due to conversion to cropland and grassland. Consequently, tree-covered area was a net-losing category during both time-intervals over the 23-year study period. However, with the speed of change accelerating over time, as evident from the analysis of annual change intensity of land cover during both time-intervals, we expect that tree-covered areas will likely continue to decline. Whereas, cropland, occupying 37% of the land area as of 2022, is expected to continue to expand as agriculture was the main direct driver of land cover change in Nigeria over the last three decades. Such foreseeable trends as tree-cover decline and cropland expansion are based on the assumption that the driving social-ecological processes of land cover change remain relatively the same in the future. That this assumption holds in the future is never guaranteed as studies have found that the trend of observed changes between land cover categories may or may not be linear (Akinyemi and Mashame Citation2018; Khwarahm Citation2021; Khwarahm et al. Citation2021). Since this assumption remains to be tested in Nigeria, there is an urgent need for research modeling future scenarios of land cover dynamics, including understanding interactions between the driving factors of land cover change.
The contributions of this study are threefold. First is the creation of the most current land cover products for Nigeria. With the use of the UNCCD classification scheme, results from this study are relevant for use in other domains requiring land cover and land cover change data over Nigeria. This reasonably accurate and timely information on the spatial distribution of seven land cover types can be used to quantify the land cover changes and their impacts when gauging Nigeria’s commitments such as the Nationally Determined Contributions and National Action Programmes relating to the various Rio Conventions. The second is applying a multi-level assessment of the intensity of change patterns and the comparative assessment of these patterns between categories and agroecological zones across two time-intervals. Third, is the examination of the extent of human appropriated natural land cover.
CRediT authorship contribution statement
Felicia Akinyemi: Conceptualization, Reference data collection, Methodology, Formal analysis, Visualization, Writing – original draft, review & editing, Funding acquisition. Chinwe Ifejika Speranza: Conceptualization, Writing – review & editing, Supervision, Funding acquisition.
Acknowledgment
We thank the fieldwork team members whose names are too numerous to mention. We appreciate the open access to Landsat image data and cloud computing tools in Google Earth Engine. This study contributes to the Global Land Programme (https://glp.earth) and the Programme on Ecosystem Change and Society (https://www.pecs-science.org). We thank the anonymous reviewers for providing constructive feedback that improved the paper’s quality. The article’s content reflects the authors’ views, not those of the EU, Horizon 2020, or any other body.
Disclosure statement
No potential conflict of interest was reported by the author(s).
Supplementary material
Supplemental data for this article can be accessed online at https://zenodo.org/doi/10.5281/zenodo.8205098.
Additional information
Funding
Notes on contributors
Felicia O. Akinyemi
Felicia O. Akinyemi is an Associate Professor in Geomatics at Karlstad University, Sweden. Certified as a Geographic Information System Professional (GISP), her research examines how changes to land systems relate to degrading processes in coupled human-natural systems over multi-decadal timescales. She leads efforts to develop geospatial methods for mapping annual land cover and Remote Sensing-based metrics for operationalizing the Land Degradation Neutrality target (SDG 15.3) and the corresponding SDG indicator 15.3.1 that aims to estimate the proportion of degraded land over the total land area. She is a member of the Science Policy Interface group of the United Nations Convention to Combat Desertification and the Biodiversity Task Force of the European Geosciences Union.
Chinwe Ifejika Speranza
Chinwe Ifejika Speranza is a geographer and a professor in Land Systems and Sustainable Land Management at the Institute of Geography, University of Bern, Switzerland. She applies an integrative research approach with the goal to understand land conditions and land system processes, in order to identify how to maintain or increase ecosystem functions and services.
References
- Adelodun, B., K.-S. Choi, and R. Echodu. 2018. “A Review of the Evaluation of Irrigation Practice in Nigeria: Past, Present and Future Prospects.” African Journal of Agricultural Research 13 (45): 3EAF05558713. https://doi.org/10.5897/AJAR2018.13403.
- Adenle, A. A., H. Azadi, and L. Manning. 2017. “The Era of Sustainable Agricultural Development in Africa: Understanding the Benefits and Constrains.” Food Reviews International 34 (5): 411–433. https://doi.org/10.1080/87559129.2017.1300913.
- Adenle, A. A., S. Boillat, and C. Ifejika Speranza. 2022. “Key Dimensions of Land users’ Perceptions of Land Degradation and Sustainable Land Management in Niger State, Nigeria.” Environmental Challenges 8:100544. https://doi.org/10.1016/j.envc.2022.100544.
- Akinyemi, F. O. 2013. “An Assessment of Land Use Change in the Cocoa Belt of South West Nigeria.” International Journal of Remote Sensing 34 (8): 2858–2875. https://doi.org/10.1080/01431161.2012.753167.
- Akinyemi, F. O., G. Ghazaryan, and O. Dubovyk. 2021. “Assessing UN Indicators of Land Degradation Neutrality and Proportion of Degraded Land Over Botswana Using Remote Sensing Based National Level Metrics.” Land Degradation and Development 32 (1): 158–172. https://doi.org/10.1002/ldr.3695.
- Akinyemi, F. O., and C. Ifejika Speranza. 2022. “Agricultural Landscape Change Impact on the Quality of Land: An African Continent-Wide Assessment in Gained and Displaced Agricultural Lands.” International Journal of Applied Earth Observation and Geoinformation 106:102644. https://doi.org/10.1016/j.jag.2021.102644.
- Akinyemi, F. O., and G. Mashame. 2018. “Analysis of Land Change in the Dryland Agricultural Landscapes of Eastern Botswana.” Land Use Policy 76:798–811. https://doi.org/10.1016/j.landusepol.2018.03.010.
- Akinyemi, F. O., R. G. Pontius Jr., and A. K. Braimoh. 2017. “Land Change Dynamics: Insights from Intensity Analysis Applied to an African Emerging City.” Journal of Spatial Science 62 (1): 69–83. http://dx.doi.org/10.1080/14498596.2016.1196624.
- Alademomi, A. S., C. J. Okolie, O. E. Daramola, S. A. Akinnusi, E. Adediran, H. O. Olanrewaju, A. O. Alabi, T. J. Salami, and J. Odumosu. 2022. “The Interrelationship Between LST, NDVI, NDBI, and Land Cover Change in a Section of Lagos Metropolis, Nigeria.” Applied Geomatics 14 (2): 299–314. https://doi.org/10.1007/s12518-022-00434-2.
- Aldwaik, S., and R. G. Pontius Jr. 2012. “Intensity Analysis to Unify Measurements of Size and Stationarity of Land Changes by Interval, Category, and Transition.” Landscape and Urban Planning 106 (1): 103–114. https://doi.org/10.1080/13658816.2013.787618.
- Aldwaik, S., and R. G. Pontius Jr. 2013. “Map Errors That Could Account for Deviations from a Uniform Intensity of Land Change.” International Journal of Geographical Information Science 27 (9): 1717–1739. https://doi.org/10.1080/13658816.2013.787618.
- Alexander, P., C. Brown, A. Arneth, J. Finnigan, and M. D. A. Rounsevell. 2016. “Human Appropriation of Land for Food: The Role of Diet.” Global Environmental Change 41:88–98. https://doi.org/10.1016/j.gloenvcha.2016.09.005.
- Arowolo, A. O., and X. Deng. 2018. “Land Use/Land Cover Change and Statistical Modelling of Cultivated Land Change Drivers in Nigeria.” Regional Environmental Change 18 (1): 247–259. https://doi.org/10.1007/s10113-017-1186-5.
- Aruofor, R. O. 2000. “Review and improvement of data related to wood-products in Nigeria.” EC-FAO Partnership Programme (1998-2000). Accessed May 21, 2024. https://www.fao.org/3/X6762E/X6762E00.htm.
- Azeez, O. 2018. “Once Upon a Game Reserve: Sambisa and the Tragedy of a Forested Landscape.” Arcadia Collection: National Parks in Time and Space, Spring (2). Accessed August 1, 2023. http://www.environmentandsociety.org/arcadia/once-upon-game-reserve-sambisa-and-tragedy-forested-landscape.
- Bär, V., F. O. Akinyemi, and C. Ifejika Speranza. 2023. “Land Cover Degradation in the Reference and Monitoring Periods of the SDG Land Degradation Neutrality Indicator for Switzerland.” Ecological Indicators 151:110252. https://doi.org/10.1016/j.ecolind.2023.110252.
- Barnieh, B. A., L. Jia, M. Menenti, M. Jiang, J. Zhou, Y. Lv, Y. Zeng, and A. Bennour. 2022. “Quantifying Spatial Reallocation of Land Use/Land Cover Categories in West Africa.” Ecological Indicators 135:108556. https://doi.org/10.1016/j.ecolind.2022.108556.
- Bouaroudj, S., A. Menad, A. Bounamous, H. Ali-Khodja, A. Gherib, D. E. Weigel, and H. Chenchouni. 2019. “Assessment of Water Quality at the Largest Dam in Algeria (Beni Haroun Dam) and Effects of Irrigation on Soil Characteristics of Agricultural Lands.” Chemosphere 219:76–88. https://doi.org/10.1016/j.chemosphere.2018.11.193.
- Breiman, L. 2001. “Random Forests.” Machine Learning 45 (1): 5–32. https://doi.org/10.1023/A:1010933404324.
- Canty, M. J. 2019. “Image Analysis, Classification and Change Detection in Remote Sensing: With Algorithms for Python”. 4th ed. Boca Raton, FL, USA: CRC Press, Taylor & Francis Group.
- Central Intelligence Agency. 2023. “Nigeria: The World Factbook.” [ accessed: 2023 Sept. 02]. https://www.cia.gov/the-world-factbook/countries/nigeria/.
- Cotillon, S. E., and M. L. Mathis. 2017. Mapping Land Cover Through Time with the Rapid Land Cover Mapper—Documentation and User Manual. US Geological Survey Open-File Report 1012, 23p. https://doi.org/10.3133/ofr20171012.
- Cushing, W. M., G. G. Tappan, S. Herrmann, and S. E. Cotillon. 2016. “West Africa Land Use Land Cover Time Series.” Earth Resources Observation and Science (EROS) Center. https://doi.org/10.5066/F73N21JF.
- Department of Drought and Desertification Amelioration. 2018. Nigeria Final Report of the Land Degradation Neutrality Target Setting Programme. Accessed October 23, 2023. https://knowledge.unccd.int/sites/default/files/ldn_targets/Nigeria%20LDN%20TSP%20Country%20Report.pdf.
- De Sy, V., M. Herold, F. Achard, R. Beuchle, J. G. P. W. Clevers, E. Lindquist, and L. Verchot. 2015. “Land Use Patterns and Related Carbon Losses Following Deforestation in South America.” Environmental Research Letters 10 (12): 124004. https://doi.org/10.1088/1748-9326/10/12/124004.
- EAC. 2012. “Environmental and Social Impact Assessment of the Eko Atlantic Shoreline Protection and Reclamation Project a Summary.” Royal Haskoning Enhancing Society. Accessed May 21, 2024. https://www.ekoatlantic.com/wp-content/uploads/2012/12/EkoAtlantic-EIA-Summary.pdf.
- FAO. 2020. Land Use/Land Cover and Forest Cover Mapping in Nigeria. Abuja. https://doi.org/10.4060/cb1327en.
- Findell, K. L., A. Berg, P. Gentine, J. Krasting, B. R. Lintner, S. Malyshev, J. A. Santanello Jr., and E. Shevliakova. 2017. “The Impact of Anthropogenic Land Use and Land Cover Change on Regional Climate Extremes.” Nature Communications 8 (1): 989. https://doi.org/10.1038/s41467-017-01038-w.
- Government of Nigeria. 2018. Report from Nigeria. UNCCD Performance Review and Assessment of Implementation System 7th Reporting Process. Accessed May 21, 2024. https://www.unccd.int/sites/default/files/ldn_targets/Nigeria%20LDN%20TSP%20Country%20Report.pdf.
- Govers, G., R. Merckx, B. van Wesemael, and K. van Oost. 2017. “Soil Conservation in the 21st Century: Why We Need Smart Agricultural Intensification.” Soil 3 (1): 45–59. https://doi.org/10.5194/soil-3-45-2017.
- Grigoras, G., and B. Uritescu. 2019. “Land Use/Land Cover Changes Dynamics and Their Effects on Surface Urban Heat Island in Bucharest, Romania.” International Journal of Applied Earth Observation and Geoinformation 80:115–126. https://doi.org/10.1016/j.jag.2019.03.009.
- Gundlach, E. R. 2018. “Oil-Related Mangrove Loss East of Bonny River, Nigeria.” In: Makowski, C. Finkl, C. (eds.) Threats to Mangrove Forests Coastal Research Library 25.Springer, Cham. https://doi.org/10.1007/978-3-319-73016-5_13.
- Herrmann, S. M., M. Brandt, K. Rasmussen, and R. Fensholt. 2020. “Accelerating Land Cover Change in West Africa Over Four Decades as Population Pressure Increased.” Communications Earth and Environment 1 (1): 1–10. https://doi.org/10.1038/s43247-020-00053-y.
- Huitink, C. L. 2018. Master thesis, Faculty of Geosciences, Utrecht University. Accessed May 21, 2024. “Burning Nigerian Forests on European Barbecues: A Carbon Footprint and Cost Comparison Between Imported Nigerian Charcoal and Sustainably Produced Charcoal in the European Union.” https://studenttheses.uu.nl/handle/20.500.12932/29543.
- Ifejika Speranza, C., F. O. Akinyemi, D. Baratoux, J. Benveniste, N. Ceperley, F. Driouech, and J. Helmschrot. 2023. “Enhancing the Uptake of Earth Observation Products and Services in Africa Through a Multi-Level Transdisciplinary Approach.” Survey in Geophysics 44 (1): 7–41. https://doi.org/10.1007/s10712-022-09724-1.
- Iloeje, N. P. 2001. A New Geography of Nigeria, 200. new revised ed. Lagos, Nigeria: Longman Nig. Ltd.
- Jimoh, S. O., T. O. Muraina, S. K. Bello, and N. NourEldeen. 2020. “Emerging Issues in Grassland Ecology Research: Perspectives for Advancing Grassland Studies in Nigeria.” Acta Oecologica 106:103548. https://doi.org/10.1016/j.actao.2020.103548.
- Khwarahm, N. R. 2021. “Spatial Modeling of Land Use and Land Cover Change in Sulaimani, Iraq, Using Multitemporal Satellite Data.” Environmental Monitoring and Assessment 193 (3): 148. https://doi.org/10.1007/s10661-021-08959-6.
- Khwarahm, N. R., S. Qader, K. Ararat, and A. M. Fadhil Al-Quraishi. 2021. “Predicting and Mapping Land Cover/Land Use Changes in Erbil/Iraq Using CA-Markov Synergy Model.” Earth Science Informatics 14 (1): 393–406. https://doi.org/10.1007/s12145-020-00541-x.
- Löw, F., C. Conrad, and U. Michel. 2015. “Decision Fusion and Non-Parametric Classifiers for Land Use Mapping Using Multi-Temporal RapidEye Data.” ISPRS Journal of Photogrammetry and Remote Sensing 108:191–204. https://doi.org/10.1016/j.isprsjprs.2015.07.001.
- Mack, B., P. Leinenkugel, C. Kuenzer, and S. Dech. 2017. “A Semi-Automated Approach for the Generation of a New Land Use and Land Cover Product for Germany Based on Landsat Time-Series and Lucas in-Situ Data.” Remote Sensing Letters 8 (3): 244–253. https://doi.org/10.1080/2150704X.2016.1249299.
- Main-Knorn, M., B. Pflug, J. Louis, V. Debaecker, U. Müller-Wilm, and F. Gascon. 2017. “Sen2Cor for Sentinel-2.” Paper presented at the Proceedings of the Image and Signal Processing for Remote Sensing XXIII, 1042704. https://doi.org/10.1117/12.2278218.
- Mbow, C., M. S. Brandt, I. Ouedraogo, J. de Leeuw, and M. Marshall. 2015. “What Four Decades of Earth Observation Tell us About Land Degradation in the Sahel?” Remote Sensing 7 (4): 4048–4067. https://doi.org/10.3390/rs70404048.
- McRoberts, R. E., S. V. Stehman, G. C. Liknes, E. Næsset, C. Sannier, and B. F. Walters. 2018. “The Effects of Imperfect Reference Data on Remote Sensing Assisted Estimators of Land Cover Class Proportions.” ISPRS Journal of Photogrammetry and Remote Sensing 142:292–300. https://doi.org/10.1016/j.isprsjprs.2018.06.002.
- Molotoks, A., E. Stehfest, J. Doelman, F. Albanito, N. Fitton, T. P. Dawson, and P. Smith. 2018. “Global Projections of Future Cropland Expansion to 2050 and Direct Impacts on Biodiversity and Carbon Storage.” Global Change Biology 24 (12): 5895–5908. https://doi.org/10.1111/gcb.14459.
- Mzaga, T. M., A. C. Tse, H. O. Nwankwoala, and G. J. Udom. 2021. “Evaluating the Impact of Artisanal Crude Oil Refining on Soil Properties at a Mangrove Wetland, Eastern Bonny River, Rivers State.” International Journal of Research in Engineering and Science 9 (12): 6–14.
- National Bureau of Statistics. 2022. “Nigerian Gross Domestic Product Report Q4 2021.” Accessed June 7, 2024. https://nigerianstat.gov.ng/download/1241137.
- Obiefuna, J. N., P. Nwilo, A. O. Atagbaza, and C. J. Okolie. 2013. “Land Cover Dynamics Associated with the Spatial Changes in the Wetlands of Lagos/Lekki Lagoon System of Lagos, Nigeria.” Journal of Coastal Research 29 (3): 671–679. https://doi.org/10.2112/JCOASTRES-D-12-00038.1.
- Omeje, C. 2021. “Do You Know Where Your Grilling Charcoal Comes From? Nigeria’s Forests Are Being Decimated to Make Charcoal for Cookouts in Europe and the United States.” Accessed May 21, 2024. https://newrepublic.com/article/161947/nigeria-where-does-grill-charcoal-come-from.
- Onilude, O. O., and E. Vaz. 2020. “Data Analysis of Land Use Change and Urban and Rural Impacts in Lagos State, Nigeria.” Data 5 (3): 72. https://doi.org/10.3390/data5030072.
- Pelletier, C., S. Valero, J. Inglada, N. Champion, and G. Dedieu. 2016. “Assessing the Robustness of Random Forests to Map Land Cover with High Resolution Satellite Image Time Series Over Large Areas.” Remote Sensing of Environment 187:156–168. https://doi.org/10.1016/j.rse.2016.10.010.
- Pesaresi, M., and P. Politis. 2023. GHS-BUILT-C R2023A - GHS Settlement Characteristics, Derived from Sentinel2 Composite (2018) and Other GHS R2023A Data. European Commission, Joint Research Centre (JRC). https://doi.org/10.2905/3C60DDF6-0586-4190-854B-F6AA0EDC2A30.
- Pons, X., L. Pesquer, J. Cristobal, and O. Gonzalez-Guerrero. 2014. “Automatic and Improved Radiometric Correction of Landsat Imagery Using Reference Values from MODIS Surface Reflectance Images.” International Journal of Applied Earth Observation and Geoinformation 33:243e254. https://doi.org/10.1016/j.jag.2014.06.002.
- Poortinga, A., Q. Nguyen, K. Tenneson, A. Troy, D. Saah, B. Bhandari, W. L. Ellenburg, et al. 2019. “Linking Earth Observations for Assessing the Food Security Situation in Vietnam: A Landscape Approach.” Frontiers in Environmental Science 7. https://doi.org/10.3389/fenvs.2019.00186.
- Salamatu, E. A., H. K. Ayuba, D. N. Marcus, and A. T. Ogah. 2021. “Analysis of Tree Species Preference and Reasons Among Commercial Charcoal Producers in Nasarawa State, Nigeria.” European Journal of Environment and Earth Sciences 2 (2): 24–29. https://doi.org/10.24018/ejgeo.2021.2.2.124.
- Schonlau, M., and R. Y. Zou. 2020. “The Random Forest Algorithm for Statistical Learning.” The Stata Journal: Promoting Communications on Statistics and Stata 20 (1): 3–29. https://doi.org/10.1177/1536867X20909688.
- Schouten, G., M. Vink, and S. Vellema. 2018. “Institutional Diagnostics for African Food Security: Approaches, Methods and Implications.” NJAS: Wageningen Journal of Life Sciences 84 (1): 1–5. https://doi.org/10.1016/j.njas.2017.11.002.
- Sims, N. C., G. J. Newnham, J. R. England, J. Guerschman, S. J. D. Cox, S. H. Roxburgh, R. A. Viscarra Rossel, S. Fritz, and I. Wheeler. 2021. “Good Practice Guidance. SDG Indicator 15.3.1, Proportion of Land That Is Degraded Over Total Land Area.” v2.0, Bonn, Germany: United Nations Convention to Combat Desertification. Accessed May 21, 2024. https://www.unccd.int/resources/manuals-and-guides/good-practice-guidance-sdg-indicator-1531-proportion-land-degraded.
- Tappan, G. G., W. M. Cushing, S. E. Cotillon, M. L. Mathis, J. A. Hutchinson, and K. J. Dalsted. 2016. “West Africa Land Use Land Cover Time Series: US Geological Survey Data Release.” Accessed May 21, 2024. https://pubs.usgs.gov/fs/2017/3004/fs20173004.pdf.
- Turubanova, S., P. V. Potapov, A. Tyukavina, and M. C. Hansen. 2018. “Ongoing Primary Forest Loss in Brazil, Democratic Republic of the Congo, and Indonesia.” Environmental Research Letters 13 (7): 074028. https://doi.org/10.1088/1748-9326/aacd1c.
- Twongyirwe, R., M. Bithell, and K. S. Richards. 2018. “Revisiting the Drivers of Deforestation in the Tropics: Insights from Local and Key Informant Perceptions in Western Uganda.” Journal of Rural Studies 63:105–119. https://doi.org/10.1016/j.jrurstud.2018.08.013.
- UNCCD. 2019. “Land Degradation Neutrality Transformative Projects and Programmes: Operational Guidance for Country Support.” Global Mechanism of the UNCCD, Bonn, Germany. Accessed May 21, 2024. https://catalogue.unccd.int/1224_UNCCD_LDN_TPP_technical_guide_GM.pdf.
- UNFPA. 2023. “Nigerian Population.” access: 2023 October 23. https://www.unfpa.org/data/world-population/NG.
- Van Wesenbeeck, S., L. Wang, F. Ronsse, W. Prins, Ø. Skreiberg, and M. J. Antal Jr. 2016. “Charcoal Mines in the Norwegian Woods.” Energy and Fuels 30 (10): 7959–7970. https://doi.org/10.1021/acs.energyfuels.6b00919.
- Wang, L., F. Wei, and J.-C. Svenning. 2023. “Accelerated Cropland Expansion into High Integrity Forests and Protected Area.” iScience 26 (4): 106450. https://doi.org/10.1016/j.isci.2023.106450.
- West, C. T., A. J. Moody, E. K. Nébié, and O. Sanon. 2017. “Ground-Truthing Sahelian Greening: Ethnographic and Spatial Evidence from Burkina Faso.” Human Ecology 45 (1): 89–101. https://doi.org/10.1007/s10745-016-9888-8.
- Winkler, K., R. Fuchs, M. Rounsevell, and M. Herold. 2021. “Global Land Use Changes are Four Times Greater Than Previously Estimated.” Nature Communications 12 (1): 1–10. https://doi.org/10.1038/s41467-021-22702-2.
- World Bank and OECD National Accounts data. 2023. “Agriculture % of GDP in Nigeria.” Accessed May 21, 2024. https://data.worldbank.org/indicator/NV.AGR.TOTL.ZS?view=chart&locations=NG.
- Xu, C., X. Du, Z. Yan, and X. Fan. 2020. “„ScienceEarth: A Big Data Platform for Remote Sensing Data processing”.” Remote Sensing 12:607. https://doi.org/10.3390/rs12040607.
- Young, N. E., R. S. Anderson, S. M. Chignell, A. G. Vorster, R. Lawrence, and P. H. Evangelista. 2017. “A Survival Guide to Landsat Preprocessing.” Ecology 98 (4): 920e932. https://doi.org/10.1002/ecy.1730.
- Yue, C., P. Ciais, R. A. Houghton, and A. A. Nassikas. 2020. “Contribution of Land Use to the Interannual Variability of the Land Carbon Cycle.” Nature Communications 11 (1): 3170. https://doi.org/10.1038/s41467-020-16953-8.