
ABSTRACT
Current nautical chart generalization methods are notably labor intensive, requiring significant levels of human intervention to compile, update, and maintain chart products. The ideal situation would be a fully automated solution for generating nautical charts seamlessly from a comprehensive database, on demand, at the appropriate scale, at the point of use, and respecting the product constraints. However, regardless of the various research efforts and advancements in technology, including those involving AI, nautical chart generalization tasks are still performed manually, or semi-manually, where a likelihood of human error is expected. This manuscript presents a research effort toward automated chart compilation through scales. Nautical chart generalization guidelines are extracted, categorized, and translated into machine readable rules, utilized by a multi-agent model to perform the generalization of the source data to the target scale with no topological violations. This is illustrated in three testbeds for the most important ENC feature classes. While topology is maintained, the model utilizes readily available algorithms that, generally, compromise safety. Therefore, a custom validation tool detects safety violations for user intervention. The model has been made flexible to incorporate algorithms that align with application constraints, especially safety, as they become available.
1. Introduction
The Electronic Navigational Chart (ENC) contains essential information about the marine and coastal environment, specifically designed to meet the requirements of marine navigation, and is used by mariners to plot and safely execute their voyages. ENCs are displayed on shipborne Electronic Chart Display and Information Systems (ECDIS) that combine data from multiple sources (e.g. ENCs, GPS, RADAR, ARPA, and AIS) (Kastrisios and Pilikou Citation2017). With ECDIS, mariners have a complete picture of the instantaneous situation of the vessel and charted dangers in the area (Alexander Citation2003). From the mariner’s point of view, the dynamic and seamless ECDIS display represents the “chart”, regardless if the current view is composed of one or multiple ENCs (Hippmann Citation2012).
Following the International Hydrographic Organization’s (IHO) standards (S-57/101), ENCs are categorized into six bands tied to navigational purpose (i.e. overview, general, coastal, approach, harbor, and berthing) (IHO Citation2020). Hydrographic Offices (HOs) face challenges in balancing ENCs’ compilation due to time, expertise, and cost. The consistent encoding of the different scales ENCs in the same geographic area, intra and inter layer, is one of the most prominent issues. Modern acquisition systems yield vast amounts of information, pushing HOs to explore effective ways to automate chart compilation (Calder and Mayer Citation2003).
Jonas and Melles (Citation2003) suggest that if a fully automated solution that honors the application’s constraint existed, an ECDIS could display generalized ENC data at the display scale derived directly from the highest resolution source material in the ECDIS database. Thus, when the mariner zoomed out, the ECDIS would perform automatic generalization for the ENC features to avoid cluttering and display only the needed features for the target scale. However, such a real time and safe automated generalization solution is not yet available, therefore, to ensure that cartographers are making the final cartographic judgments for the safety of navigation, ECDIS systems do not perform on-the fly cartographic generalization and strictly display the ENCs content (Dyer, Kastrisios, and De Floriani Citation2022). Hence, it remains mandatory for Hydrographic Offices (HOs) to produce several ENCs to cover the same sea areas at different scales through an amalgamation of, manual and semi-manual, individual generalization processes.
The ENC is a database that consists of a set of point (e.g. soundings, navigational aids), line (e.g. depth contours, coastlines) and polygonal features (e.g. depth areas, land areas) which are encoded using the chain-node topology (IHO Citation2020). There are 170 geo-features defined for ENCs (IHO Citation2018) and divided into two main groups: Group 1 features of type area (i.e. depth area, land area, dredged area, unsurveyed area, floating dock, hulk, and pontoon), known as the “skin-of-the-earth” (SOE), which must totally cover the extent of the chart without overlaps or gaps, and Group 2 for all other geo-feature objects.
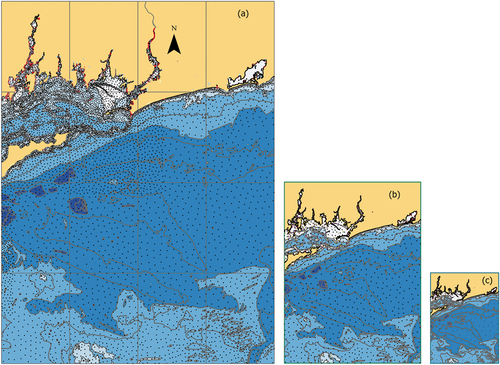
For years, ENCs were compiled by digitizing them from paper charts. These ENCs were maintained within separate databases based on the paper charts footprints (Kastrisios et al. Citation2019b). This paper-chart-first approach, as seen in , contributed to inconsistencies in adjacent cells. These inconsistencies can impact the performance of ECDIS, or pose a risk by triggering false alarms that contribute to the situation known as “mariner’s deafness” (Kastrisios, Calder, and Bartlett Citation2020). Correct topology of the ENC data becomes essential for the unobstructed and seamless operation of ECDIS.
Figure 1. US/Canadian Border-West Coast (a) current chart scheme (IC-ENC Citation2022) and (b) planned gridded scheme (NOAA Citation2023).
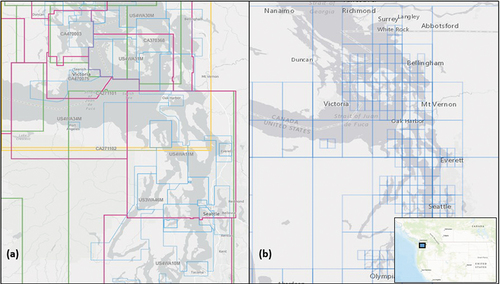
According to the IHO S-65 ENCs Production, Maintenance and Distribution Guidance standards (IHO Citation2017), ENC borders should be rectangular, while the data coverage can assume any shape. Consequently, HOs are encouraged to update their coverage schema to a rectangular gridded system (e.g. ). In addition, HOs should preferably migrate their ENC production environments to enterprise GIS solutions, with a unified database for all ENC (NOAA Citation2019b).
In accordance with IHO recommendations, in 2019, the National Oceanic and Atmospheric Administration/Office of Coast Survey (NOAA/OCS) started rescheming their suite of ENCs by creating a gridded system with standardized scales and cell sizes (), where cell boundaries follow lines of longitude and latitude and appear as rectangular on a Mercator projection (). The new gridded NOAA ENC coverage approach aims, among others, to facilitate depth contour metrification for NOAA charts and resolve discontinuities and edge matching issues. The recompilation of bathymetry from the imperial (fathoms and/or feet) to the metric system is one of the challenging aspects of the NOAA’s rescheming plan. The new NOAA scales follow a dyadic system in which each successively smaller scale is half of the preceding scale (). Accordingly, 16 cells of any scale will fit perfectly into the extent of the next smaller scale (NOAA Citation2019b).
Table 1. ENC usage bands and navigational purpose and the respective IHO recommended OCS compilation scales.
Chart compilation is the result of many tedious generalization tasks where cartographers put effort to adhere to the product-specific constraints throughout the process. Automating these labor-intensive generalization tasks, while respecting the nautical generalization constraints, could expedite charts while improving precision, uniformity, and reducing cost. This advancement marks a significant step toward efficient and flexible chart production, including projects like NOAA’s rescheming initiative. The absence of existing automated solutions for chart generalization creates a critical gap in the field, where most charting tasks rely heavily on manual processes. This limitation prolongs chart update times, as manual methods struggle to adapt to dynamic maritime changes, requiring extensive human intervention and expertise. Addressing this bottleneck necessitates innovative automation and technology to boost chart production efficiency and accuracy.
Motivated by the necessity to automate and streamline the compilation of ENCs from the latest data, this paper introduces a research effort that aims to translate cartographic practice and theory into algorithmic building blocks for modeling chart compilation processes. The proposed model builds upon a set of constraints extracted from available nautical cartographic specifications, categorized, and translated into rules to be defined in a template as conditions to be respected during the generalization process. The Automated Nautical-chart Generalization model (ANG) employs this template and the source data within the areas of interest to perform generalization to a target scale. The ANG model, a stepping stone toward automated chart compilation, is evaluated in three real-world scenarios as presented in Section 4.
The paper is organized as follows: Section 2 presents previous related work for generalizing topographic and nautical charts. Section 3 introduces the ANG model, including the generalization constraint template, the generalization rules spreadsheet and the multi-agent generalization sub-models and databases. Section 4 illustrates the implementation of the ANG model in three study cases from the NOAA rescheme effort. Section 5 covers the topology and validation for the model output. Section 6 addresses future work, and lastly, the conclusions are discussed in Section 7.
2. Related work
In the land domain, various research efforts of automating topographic map production exist, such as those by France (Lecordix et al. Citation2007), Great Britain (Regnauld Citation2011), Denmark (Foerster, Stoter, and Kraak Citation2013), and Germany (Burghardt, Duchene, and Mackaness Citation2014). For example, at Swisstopo, their automated generalization methodology played an important role in modernizing Switzerland’s map series with automatically deriving Digital Cartographic Models (DCM) from the Digital Landscape Model (DLM) (Käuferle and Wigley Citation2021). Likewise, Kadaster, the Netherlands national organization for topographic map production, developed a fully automated workflow for compiling a 1:50k map from 1:10k map with no human interaction (Stoter et al. Citation2016). In the USA, Esri developed a Topographic Generalization Model that provides a standard set of generalization procedures for automating the creation of smaller scale data from a set of base data (Esri Citation2023). Moreover, other recent research focused on Open generalization platforms (e.g. CartAGen) where all researchers in the field can share codes and contribute to the algorithms (Touya, Lokhat, and Duchene Citation2019). In addition, deep-learning-based generative adversarial networks (GAN) algorithms were introduced which signify the incorporation of machine learning approaches in map generalization (Cicek, Koc, and Korukcu Citation2022).
In the marine domain, research focus has been on the automation of individual chart compilation tasks, particularly those of soundings (e.g. Dyer, Kastrisios, and De Floriani Citation2022; Lovrinčević Citation2019; Owens and Brennan Citation2012; Skopeliti et al. Citation2020; Sui, Zhu, and Zhang Citation2005; Yu Citation2018) and depth contours (e.g. Guilbert and Zhang Citation2012; Miao and Calder Citation2013; Peters, Ledoux, and Meijers Citation2014; Skopeliti, Tsoulos, and Pe’eri Citation2021; Yan, Guilbert, and Saux Citation2016). Effort has also been put on automating quality control tasks, and particularly those of validating safety (e.g. Dias et al. Citation2022; Kastrisios and Calder Citation2018; Kastrisios et al. Citation2019a, Citation2019b; Wilson, Masetti, and Calder Citation2017), and topology of depth information on charts (e.g. Huo et al. Citation2022; Kastrisios, Calder, and Bartlett Citation2020). It is only recently that Socha and Stoter (Citation2013) investigated the automation of chart production in the greater context. The goal of the research was to define computer translatable rules that allow the creation of small-scale ENCs from larger scale database with minimal human intervention. The study focused on approach and coastal ENC bands and nine feature classes (Socha and Stoter Citation2013). Lastly, Kastrisios et al. (Citation2023), demonstrated a semi-automated (“hybrid”) approach, where automated routines performed the generalization of selected chart features and cartographers validated and fixed the output per compilation requirements.
Three modeling approaches have been developed by the research community for map generalization, i.e. the Condition-action, Human-interaction, and Constraints-based modeling (Mackaness, Ruas, and Sarjakoski Citation2007). The main difference between condition-action and constraint-based modeling lies in the way the rules (“conditions” and “constraints”) are used to perform the generalization: conditions state what is to be done in a process, while constraints stress what results should be obtained. The use of cartographic constraints was first presented by Beard (Citation1991), the advantage of which is that an action is not chosen according to a single condition, but to a synthesis of conditions (Ruas and Plazanet Citation1997). There are four types of constraints defined for the generalization of a nautical chart (Peters, Ledoux, and Meijers Citation2014):
Safety (i.e. at every location, the indicated depth must not be deeper than the depth that was originally measured at that location). In other words, depth contours can only be moved toward greater depth during generalization, and sounding selection should be shallow biased. This is to guarantee that a ship never runs aground because of misrepresentation (Zhang and Guilbert Citation2011; Peters, Ledoux, and Meijers Citation2014).
Topology (e.g. no gaps or overlaps between SOE features or self-crossing of contours exist).
Legibility (i.e. information should be shown in a clear and efficient way to ensure map readability).
Morphology (i.e. slope and roughness of the seafloor must be maintained as much as possible).
Those constraints are considered translations of the required conditions considering the objects and the desired final state of the data (Stoter et al. Citation2009). Ruas and Plazanet (Citation1997) suggested that the process of generalization should not stop even if some of the constraints are partially violated, according to its hierarchy. For ENCs, correct topology is essential as it could cause ECDIS to crash, while failure to meet safety can lead to maritime accidents. Any situation is described by the geo-objects involved, the relationships between those objects, and the violated constraint.
Yan, Guilbert, and Saux (Citation2016) refined the Multi Agent System (MAS) for nautical chart that was introduced by them in 2011. The past several years of research in cartographic generalization showed several successful automation attempts using MAS (e.g. Duchêne et al. Citation2018; Gaffuri Citation2007; Galanda and Weibel Citation2002; Lamy et al. Citation1999; Maudet et al. Citation2014; Ruas Citation1999; Sabo et al. Citation2008; Zhang and Guilbert Citation2011). In MAS, each feature of the chart is an agent that decides its action during the generalization process independently, or according to its relation to the other agents, which are all classified in a hierarchical tree structure.
In deriving the next smaller scale chart data, two main generalization approaches exist: ladder and star. The ladder approach, where each chart scale is derived from the previous one with generalization, and the star approach where all scales are derived from the same base highest level of detail dataset. Ross (Citation2009) conducted a comparison between the two and concluded that the variation between the results depends on the algorithm used. For example, no difference was found with the Douglas and Peucker (Citation1973) while some variations were seen when using the Wang and Muller (Citation2013) line simplification algorithm. In nautical charting, the ladder approach has been traditionally used to ensure vertical consistency, i.e. that features portrayed on the smaller scale chart will also be portrayed on the larger scale chart.
In conclusion, previous research has predominantly concentrated on automating specific tasks related to chart compilation, as evidenced by various illustrative examples. Recently, a study extended its coverage to encompass certain nautical chart features and received proper acknowledgment. Yet, this expansion merely touches the tip of the iceberg. Guided by this approach, this research focuses on bridging the existing gaps by building upon prior efforts and introducing additional features with adaptable flexibility, ultimately to comprehensively encompass the entire spectrum of ENC features.
3. The automated nautical-chart generalization model (ANG)
This section presents the proposed ANG model framework in three sub-sections as follows: the generalization constraint template (Section 3.1), which defines the properties of the nautical constraint as conditions to be respected; the generalization rules spreadsheet (Section 3.2), which contains information, relationship, tools and hierarchy levels of the selected features; and the multi-agent generalization sub-models and databases, which conducts the generalization process (Section 3.3).
3.1. The generalization constraint template
The four nautical chart constraints can be divided into the hard, that must be totally respected (i.e. topology and safety), and the more flexible, soft, constraints (i.e. legibility and morphology). A map is considered correct when the hard constraints are satisfied (Mackaness, Ruas, and Sarjakoski Citation2007). However, most of the available information sources need to be interpreted first by humans before being translated into constraints (Burghardt, Schmid, and Stoter Citation2007). Following a similar approach to Stoter et al. (Citation2009), for this work we utilize a template to categorize and define the properties of the nautical constraints as conditions to be respected, in addition to the geometry type and feature class to which each applies. These conditions were derived from available publications (e.g. S-4 Regulations of the IHO for International Charts and Chart Specifications (IHO Citation2021)), and NOAA Nautical Chart Manual, Policies and Procedures (NOAA Citation2019a), and are representative of the nautical charting practice. The developed template is divided into three sections: conditions on one object, on two objects, and on group of objects (e.g. ). A pseudocode for each condition facilitates their translation into formal, machine readable, rules. In addition, a hierarchy value for each condition represents the degree of importance of each condition. For example, all skin-of-the-earth related conditions are assigned the highest degree of importance (i.e. Theme Hierarchy level 0 in our implementation), whereas, e.g. shoreline construction points (SLCONS_P) are assigned the lowest degree of importance (i.e. Theme Hierarchy level 9). This is because topological integrity of SOE features is mandatory for the chart to pass the respective validation tests before publication, whereas the shoreline is of lesser concern in this context. A violation occurs when an object or a group of objects does not respect a constraint. For instance, two overlapping polygons violate the topology constraint, whereas the removal of an entire group of obstruction points violates the safety constraint. Within each theme, a Feature Hierarchy level is also defined for each feature class, which signifies the importance of features in a record relative to other features within the same theme.
Table 2. Nautical chart constraints template example.
3.2. generalization rules spreadsheet GRS
A Generalization Rules Spreadsheet (GRS) was developed from the nautical constraint template and the input database schema. The latter is based on NOAA’s enterprise chart production geo-database, known as the Nautical Information System (NIS). The NIS is an attributed multi-scale geospatial database repository for all current NOAA nautical charts, utilizing Esri ArcGIS software, which is primarily used for ENC maintenance and publication (Ence Citation2018). The GRS matches the input database schema and is used to configure the ANG model. The GRS contains the required information about the selected feature classes, the relationship between those features, the tolerances at the target scale, hierarchy levels, and operations that need to be applied on each feature. It comprises multiple tabs that each contains information for the various individual procedures of the generalization process. The GRS essentially controls the “when” (i.e. the criterion that triggers the generalization) and the “how” of generalization (i.e. the generalization operator that will be used) (Shea and McMaster Citation1989).
3.3. Multi-agent generalization sub-models and geo-databases
A multi-agent generalization system is a set of interacting agents that can be used to solve complex problems by controlling the evolution of these agents to reach their goal (Mackaness, Ruas, and Sarjakoski Citation2007). In the Multi Agent System (MAS) for nautical charts, introduced by Yan, Guilbert, and Saux (Citation2016), each chart feature acts as an independent agent that decides its action during the generalization process in a hierarchical tree structure. In this MAS, three levels of agents were defined (i.e. macro, meso and micro), where macro agents control meso agents, and meso agents contain micro agents.
In this work, we are using a modified/hybrid system, where “macro” agents are the Group 1 (SOE polygon) features that control all edged Group-2 line features (“meso”), while the position of the contained point features (“micro”) act as barriers, thus restrict the level of generalization of macro and meso. More precisely:
Group-1 SOE polygon features are assigned the highest theme hierarchy level and control the generalization of features they share edges with. For example, when a depth area or a land area is generalized, the edged depth contour or coastline must follow the process.
Group-2 line features are controlled by the higher hierarchy Group 1 agents (e.g. depth contour, coastline).
Group-2 points are generalized to the target scale while they also act as barriers during the generalization process of higher agents (i.e. Polygons – Lines), e.g. a depth contour will not cross an Aid-to-Navigation while being processed.
Based on the above concept, an Automated Nautical-chart Generalization Model (ANG) has been developed that consists of five phases, namely Prepare, Phase1 Generalization (P1G), P2G, P3G and Finalization. Each phase contains a series of sub-models that run sequentially as defined in the GRS. The ANG is flexible, as it is not hardcoded to a specific data schema or output scale, which enables it to be used with any database schema. The model is developed in ArcGIS Pro and organized in a series of sub-models using Eris’s Model-builder (Esri Citation2023) and custom Python scripts. In the current implementation, a new GRS is required for each target scale, with minor changes to the generalization sub-models, to create generalized data for the various target scales (Nada et al. Citation2023a).
Beginning with preparing the input geo-database, an empty database is created with a preconfigured ENC schema that contains the necessary feature classes and tables to capture ENC information (Esri Citation2023). Based on this configured schema, the Generalization Rules template is created to begin building the GRS rule file. Finally, the selected feature classes (see ) are imported to the input database from the available highest level of detail ENCs for the area of interest (AOI).
Subsequently, the GRS is validated using the Generalization Rule Validation tools in ArcGIS Pro (see Esri Citation2021) to confirm that it includes the necessary tolerances and rules for the target scale. This ensures that all the feature classes in the input schema match the GRS. Subsequently, the model runs in a series of five phases () as follows:
Figure 2. An abstract schematic description of the automated nautical generalization model (Nada et al. Citation2022).
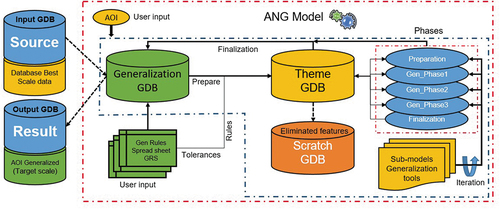
Preparation phase; a series of temporary databases are created that will be used throughout the generalization process (). The Generalization database is similar to the source database but optimized for generalization by being simplified (e.g. with deleting unnecessary attributes). The Theme database extracts the required features from the generalization database into a set of pre-defined feature classes, then the generalization sub-models operate against it. The Scratch database is for storing temporary and eliminated features. After all generalization sub-models have run, the Finalization sub-model takes the results from the Generalization database and copies them into the Result database with the same input schema. In addition to creating the required databases, the Prepare sub-model merges the input features that belong to the same feature class type from the source database (e.g. all land areas). Then, extracts the data from the source database within a buffered AOI (which aims to ensure edge matching between adjacent cells) and copies it to the Generalization database. Finally, the Prepare sub-models calculate the Feature Hierarchy and Theme Hierarchy fields utilizing the GRS, and create feature count logs to report the statistics of before and after generalization. As illustrated in , the model utilizes readily available algorithms, allowing for the replication of the described work following the described workflow with necessary adjustments.
Phase 1 Generalization (P1G); based on those defined in the GRS, P1G is mainly responsible for collapsing and eliminating SOE polygons and maintaining topological relationships. The first step is creating the theme layers by converting the SOE features from the source data into the theme-based schema used by the model. Second, the generalization and geometric relationships between features are extracted (see ), as defined in the GRS, and assigned to the selected features. Each feature is assigned a geometric (e.g. edge) and a generalization relation (e.g. shared).
Figure 3. The generalization phases and sub-models in ArcGIS Pro.
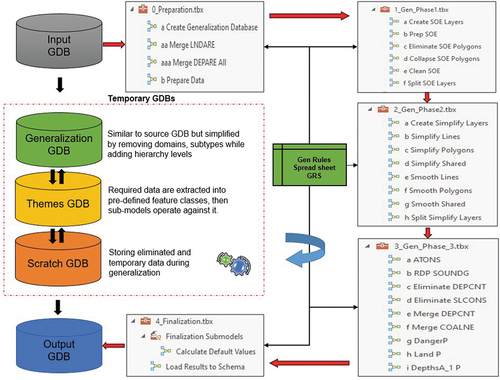
Table 3. The geometric and generalization relationship (defined in the GRS).
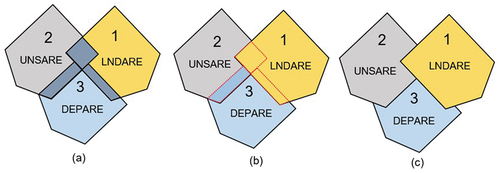
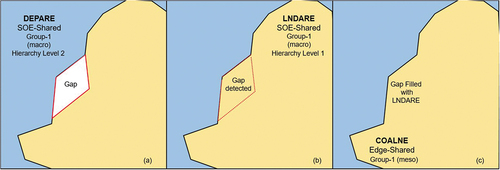
The final sub-model in the P1G phase is the Clean and Split SOE polygons, which performs the final processing of the generalized SOE features. This includes dissolving and filling gaps, as well as removing any SOE edge lines where polygons were dissolved (as their interior boundaries no longer exist). The main task of the P1G sub-models is to ensure topology of the exported features (e.g. no overlaps, gaps, or self-crossing). For example, illustrates the approach to remove overlaps between SOE polygons land area (LNDARE), unsurveyed area (UNSARE), and depth area (DEPARE). In detail, the P1G sub-model detects the overlap geometry (), creates a new polygon feature from the error shape (), removes the portion of the overlap from each of the overlapping features, and merges the common overlapping geometry to the overlapping feature of the higher Feature Hierarchy level ().
Figure 4. Removing overlaps between Polygons as per the GRS Hierarchy levels.
To fill gaps between SOE polygons resulting from the generalization operations, the P1G sub-models detect the gap (), creates a new polygon feature from the closed ring that forms the gap (), and merges the gap polygon to the adjoining polygon of the higher feature hierarchy ().
Figure 5. Filling gaps between polygons as per the GRS hierarchy levels.
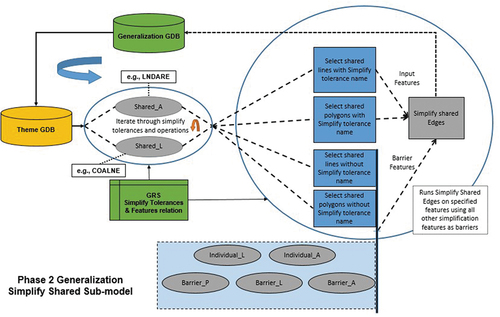
(3) Phase 2 Generalization (P2G); responsible for the smoothing and simplification of the selected shared (line) features. First, the SOE-related features, based on their rules in the GRS, are loaded into the Theme database. Subsequently, the Simplify Shared tool (), iterates through the shared simplification tolerances in the GRS and simplifies the specified features, using selected point features as barriers. The Simplify shared sub-model utilizes the available ArcPro Bend Simplify algorithm (Wang and Muller Citation2013), which identifies and eliminates relatively insignificant bends. The Retain critical points algorithm (Douglas and Peucker Citation1973) was also tested, but as Ross (Citation2009) and Esri (Citation2023) explain, the Wang and Muller (Citation2013) preserves the overall shape of the generalized line closer to that of input line than the Douglas and Peucker (Citation1973), however it takes slightly more time to process. It is noted that no effort to identify “optimal” values for the tool was made as this was beyond the scope of this work. (for the reasons explained in Section 5.2)
Figure 6. The simplify shared sub-model flow chart.
illustrates an example of the ANG Model workflow on some of the selected features (see ) in the three different primitive types, i.e. polygons (e.g. land area), lines (e.g. coastline) and points (e.g. soundings). The geometric – generalization relation between them and the way they interact during the generalization process is defined in the GRS (). In this example, land areas are defined as Geometric: SOE and Generalization: Shared features, while coastline as Geometric: Edge and Generalization: Shared. Thus, when the land area is simplified, the coastline must follow the generalization operation and maintain their topological relationship (due to coastline being Shared). Artificial coastline (SLCONS) are utilized as barriers (i.e. Geometric: Edge and Generalization: Barriers), thus they maintain their geometric characteristics (e.g. shape, orientation) during generalization. Aids-to-navigation ( “*ATONS”) are also used as barriers (i.e. Geometric: Interior and Generalization: Barrier), which means that they also maintain their position while forcing other higher hierarchy features to respect them during the latter’s generalization process (e.g. land area cannot be eliminated if it contains an Aid-to-Navigation, and a coastline cannot cross an Aid-to-navigation location). The same concept applies to depth areas, depth contours, and soundings. Subsequently, the Collapse SOE polygons sub-model iterates through the SOE polygons and collapses small polygons to points, based on the tolerances defined in the GRS, while the surrounding feature takes over the empty space and copies them into the output database. For example, a small land area (e.g. island) can be collapsed to a point (land area_P) only if there is no aid-to-navigation on top of it, while the surrounding depth area will fill the gap resulting from this change.
Figure 7. The generalization model – example on land area and the related features.
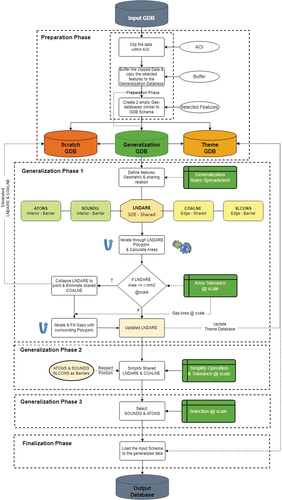
(4) Phase 3 Generalization (P3G), this phase is mainly responsible for generalizing point features (e.g. soundings, aids-to-navigation). Also, a final stage of merging, dissolving, and eliminating selected linear features also occurs in this phase. For example, line features that do not meet the minimum length requirement (e.g. 2 mm @ scale) and do not intersect or connect to other features are eliminated using the Remove Small Line tool.
(5) Finalization phase: creates the result database (that matches the input database schema) and loads the generalized features from the Generalization database. This includes subtypes, domains, and field default values. Furthermore, it generates feature count logs (see e.g. ) for the output database to provide quantitative information about the level of generalization that occurred.
Appendix A () illustrates a flow chart of the ANG model, highlights the main phases/sub-model steps, and the major generalization operations they contain.
4. Implementation
The current workflow for the creation and updating ENCs across diverse scales remains time-intensive, introducing the risk of human errors and data inconsistencies. Following the acquisition and validation of high-density Hydrographic data that meet international standards, the high-resolution raster data are generalized to vector depth contours and soundings appropriate for each nautical chart scale. Automating these associated labor-intensive generalization tasks would lead to accomplishing chart compilation more swiftly, precisely at a significantly reduced cost.
The model is tested in three study cases in the greater New York/Long Island area () that aim to evaluate performance in different real-world scenarios. However, it is to be noted that the NOAA planned band 4 cells for this area are still in the planned phase (see ), so the model output cannot be compared to the manually derived cells. Using the available largest scale chart in the areas as the source data, following NOAA’s new ENC coverage scheme, a star approach is utilized to reach the target smaller scales. In detail:
Figure 8. The study areas in NY Long Island Sound-USA and completed, in-work, and planned new cells as of March 2023 (NOAA Citation2023).
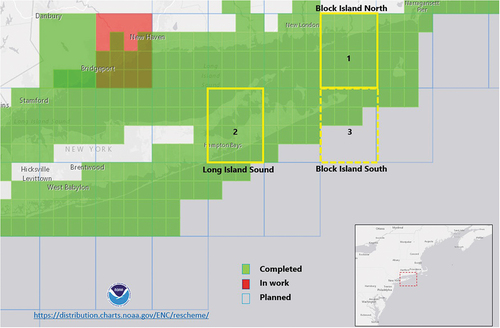
Block Island North: full band 5 cells coverage (i.e. 16 cells at 1:20k) with consistent edge-matching are generalized to a band 4 (1:40k and 1:80k) cell.
Long Island Sound: full band 5 cells coverage (i.e. 16 cells at 1:20k) with inconsistent edge-matching are generalized to a band 4 (1:80k) cell.
Block Island South: mixed band 5 and band 4 cells coverage (i.e. seven 1:20k and one 1:80k cells) generalized to a band 4 (1:80k) cell.
In , the green cells represent the produced Band 5 ENCs by NOAA, the red those in work, and those in gray are planned cells. Yellow boxes mark the three research study areas with the dashed one for the study case (3) where a mix of bands 5 and 4 is used. illustrates the NOAA reschemed ENC status, where 13% produced and 84% are still planned.
Table 4. Current NOAA ENC status as of March 2023 (NOAA Citation2023).
For this research work, 13 Group1 and Group2 feature classes (FCs) have been selected for the proof of concept. shows the selected feature groups, their possible geometry type, i.e. Point, Line, Area (underlined are those used in this research), along with their associated NOAA database table subtype values, which are used to extract the selected features. It is noted that *AtoNs and *DtoNs are used in to represent the selected feature classes that encode information about Aids-to-Navigation and Dangers-to-Navigation.
Table 5. ENC selected S-57/101 features and associated NIS feature classes.
Lastly, since the goal of this effort is a methodology that respects topology, the output is subsequently validated (Section 5) based on rules such as those described in Section 3.1.
4.1. Case study −1 (NY Block Island North – Consistent edge matching)
The first case study is the New York, Block Island North area (see ) that consists of 16 band 5 ENCs at scale 1:20k (see ), with perfect edge matching between the input features (i.e. Polygons and lines are properly connected at the cells’ borders). illustrates the output of the model that generalized band 5 to band 4 data.
Figure 9. Research case-1, Block Island North, NY-USA (a) Model input 1:20k (b) Model output 1:40k (c) Model output 1:80k.
After running the automated generalization sub-models, the Load Results to Schema tool in the Finalization sub-model is used to return the Generalization database to the input database schema and calculate the number of features after generalization. The Bar Chart in Appendix A illustrates the number of features before and after generalization for the Study Case 1 while feature specific details are provided in .
More precisely, the number of processed features for the selected 13 feature types in the output is 23% of the input data. This number serves as an indication of the level of generalization; however, this is subject to the user-selected parameters (e.g. radius thinning for the sounding selection). Also, the result is affected by area and line features (e.g. a landmass or depth area) that consist of parts of the overall feature in the large-scale charts (which are merged and become one for the smaller scale product) and the features that are not among the 13 selected feature classes for the proof of concept (and, thus, totally removed from the output). For instance, the output percentage for FC group NaturalFeaturesA was 16%, because only the land area polygons of the 16 ENCs in this group were amalgamated and subsequently generalized, whereas the rest of the FC group features contained in land area polygons, e.g. lake area, land region, and Rivers were totally removed as they are not among the 13 selected feature classes. Also, collapsed land area Polygons were converted to land area Points under the NaturalFeaturesP FC group and presented in the output database, while the collapsed depth area polygons were converted to points under SeabedP (seabed points), since S-57 standards do not include depth area point features.
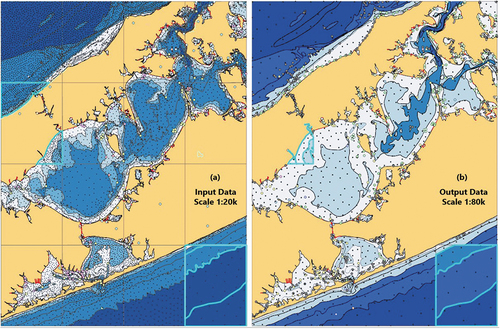
4.2. Case study −2 (NY Long Island Sound – inconsistent edge matching)
The second case study is in the New York, Long Island Sound area (see ). The research 13 feature classes from 16 band 5 ENCs (scale 1:20k) were used for the input database (see ). Although two of the 16 cells have edge matching inconsistency with neighboring cells (), the model runs successfully producing one Band 4 cell at 1:80k scale. While the model was able to merge and generalize features with minor inconsistencies (e.g. the north-westernmost area highlighted in but not in ), this was not the case for polygons and line features with considerable inconsistencies (highlighted in ). These should be addressed manually by cartographers. Our testing has shown that “minor inconsistencies” is case specific and in the range of a few millimeters at the chart scale.
Figure 10. Result Case-2, Long Island Sound, NY-USA (a) Before generalization (b) After generalization.
In terms of the level of generalization occurred in Study Case-2, the total generalized output features are 23% that of the input database (See ). The bar chart in illustrates Case-2 and the number of features before and after generalization. As expected, all feature classes demonstrate reduced counts in the smaller scale output with the exception of two groups (i.e. NaturalFeatureP, SeabedP). This is due to polygon features from the respective feature classes (i.e. NIS NaturalFeatureA and DepthsA) collapsed into points (a more detailed table is presented in Appendix A ).
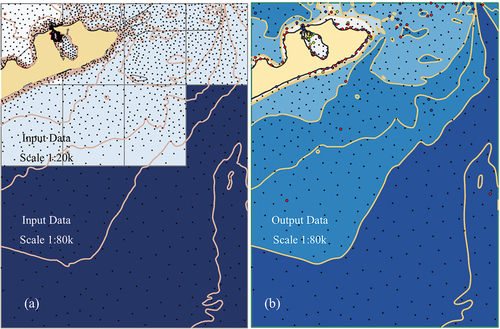
4.3. Case study −3 (NY Block Island South – mix bands 5, 4 data)
The third study case is the NY Block Island South area (see ), which represents the case where an area is not fully covered by the same large-scale ENCs. As illustrated in , only seven band 5 ENCs were planned and available for this area from NOAA. Therefore, in order to have complete coverage within the required smaller scale band 4 cell border, the available band 4 ENC (i.e. US4CN22M; scale 1:80k) is used (). It is noted that Band 4 cell of the re-scheming effort is not available (i.e. still “planned”), therefore the data are extracted within the cell limits from the available, paper-chart first based, NOAA coverage scheme. The ANG model was also able to run on this varying resolution database and to produce a Band 4 cell at 1:80k scale. shows the case before and after generalization, and illustrates the number of features before and after generalization. In Case-3; the number of features in the output database is 33% of the input database features. The higher percentage of features in the resulting ENC, compared to case studies 1 and 2, is due to the band 4 data was used “as-is”, i.e. without further generalization as they match the target scale in the band 5 gap area.
Figure 11. Result Case-3, Block Island South, NY-USA (a) Before generalization (b) After generalization.
5. Validation
According to the International hydrographic Organization’s S-58 standard “Recommended ENC Validation Checks” (IHO Citation2018), a number of mandatory validation checks are required to ensure that the ENC data are in conformance with the IHO S-57 ENC product specification. Violations are categorized as “warnings” or “errors”. Warnings are less serious violations or suspicious data (e.g. apparent location of a building in the sea). Errors are more serious discrepancies or violations, for example, data not conforming to one of the mandatory requirements of the ENC product specification for Topology (IHO Citation2018).
As mentioned in Section 3, topology and safety constraints are the hard application constraints and should be respected for an electronic navigational chart to be correct and safe. The main goal of this work was a workflow that generalizes source chart data to the target scale chart with no topology errors; however, due to the above, both topology and safety are assessed.
5.1. Topology validation
Topology validation checks (IHO Citation2018) were applied on the ANG model results to ensure no topological errors exist in the output database in the three study cases. This includes checks for crossing line geometries, polygons that overlap, gaps among SOE features, and coincident nodes, to name a few. After successfully running the ANG model, the topology checks are performed on the result database using the Validate Topology tool in ArcGIS Pro. The tool conducts a set of integrity checks to validate that the schema of the output database matches that of the input database (i.e. ENC schema) and identifies any violations of the topology rules (see the example of IHO S-58 (Citation2018) topology rules in ).
Table 6. Topology validation checks (IHO Citation2018.).
The validation of the output databases for the three study cases showed no topological errors as shown in Appendix A , thus confirming that the main goal of this research has been achieved.
5.2. Safety validation
In this research effort, for the generalization tasks, readily available tools with ArcGIS were utilized, however, the available tools do not, generally, respect safety. For the sounding selection, the Maritime ArcGIS Pro “Reduce Point Density” tool is utilized. This tool generates a thinned output set of points, to a user-specified start/end thinning radius, in a shallow biased manner. For the validation of the shoal-biased pattern of selection, the works on sounding validation mentioned in Section 2 were used. As expected, and as Dyer et al. (Citation2022) have shown, radius and grid-based approaches do not guarantee safety (and legibility). It is pointed out, though, that the ANG model is designed in a flexible way so that new and in development algorithms can be tested and incorporated in the model as they become available (e.g. that by Dyer et al. (Citation2023) for a more sophisticated cartographic sounding selection).
For line depth contours generalization, none of the previous research efforts mentioned in Section 2 are readily available to be utilized. Based on the work by Peters et al. (Citation2014), a new tool was recently made available with the ArcPro Maritime Extension (Smooth Bathymetric TIN), which performs a shoal-bias generalization of the bathymetric surface. Smoothed safe contours can then be derived from the smoothed TIN. However, this tool operates on digital models of the seabed surface and, as such, is not applicable to the effort of generalizing vector polylines of the largest scale chart to smaller scales. Therefore, as explained in previous sections, the Bend Simplify tool (Wang and Muller Citation2013) was utilized which, again, does not guarantee safety. Until one of the previous or a new research effort on vector contours simplification becomes readily available, depth contours safety violations must be highlighted in the product for user fixing. Accordingly, in the context of this research effort, a validation tool was developed in ArcGIS Pro that detects the safety violations in the output database, categorizes and sorts it by area and perimeter ().
Figure 12. Safety validation tool results (a) Input database (b) Output database with generalization difference (c) Output database with Safety violations (d) Output Database.
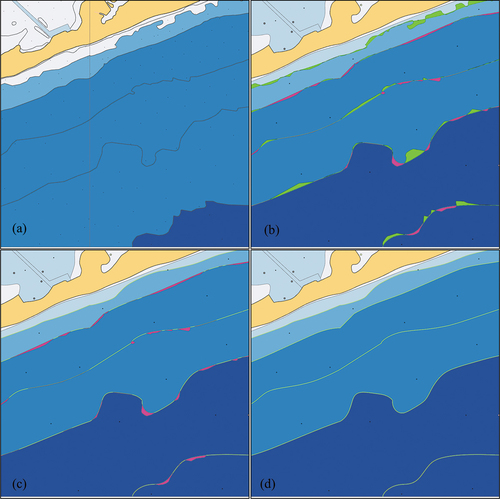
As illustrated in the example of , the tool compares both databases (pre- and post-generalization) and generates difference polygons. is an example of the input database before generalization (1:20k), while illustrates the ANG output database (e.g. 1:80k) overlaid with the difference between the input and the output databases. Green polygons represent safe generalization process (i.e. contour moved to the deep side), and the polygons in magenta represent safety violation spots (i.e. contour moved to the shallow side). illustrates the tool output with only the safety violation polygons. These violations are sorted by area/perimeter and compiled in a geo-table to support the user in taking the proper action to solve this safety violation (where necessary). Lastly, illustrates the Output database. However, it should be noted that other parameters, in addition to the area and/or the perimeter of the safety violation spot, might be valuable to the cartographer in order to take the right decision regarding a safety violation spot (e.g. location relative to a navigation channel). Detailed information on the contours validation tool is provided in Nada et al. (Citation2023b).
6. Discussion and future work
As explained in Section 2, the ladder approach is a conventional technique. Its purpose is to ensure consistent features portrayed on both smaller and larger scale charts. This prevents confusion for mariners who transfer routes from overview charts (smaller scale) to larger scale charts for safety assessment and passage execution. However, the task of changing between charts is not required with ENCs. Additionally, discrepancies can be addressed by zooming in and out the area of interest. Crucially, ECDIS safety checks are conducted based on the highest level of detail information in the database, not the displayed chart. Therefore, a star approach may be worth investigating if it was to expedite the chart updating workflow. In this study, the star approach was implemented for simplicity. However, future work could include comparing the approaches, as recommended by Ross (Citation2009), to fully understand the implications of choosing either one for generalization. This comparison should be performed based on the application constraints, thus, if the comparison can demonstrate specific benefits from the use of the star approach, it can be adopted.
For the current implementation, distinct GRSs were developed for each desired scale. However, future work should investigate crafting a single GRS for all output scales, where only the target scale can be adjusted.
As explained in Section 2, topology and safety are rigorous nautical cartographic constraints. They introduce significant complexity to the generalization process, rendering algorithms designed for topo mapping are inapplicable for nautical charting. As demonstrated in this manuscript, the ANG output is free of topology violations, yet safety violations persist. Nevertheless, ANG retains flexibility and can utilize new generalization tools once available. Hence, testing and incorporating new algorithms constitute future work, contributing to the ongoing efforts for enhancing the model toward a fully automated solution.
Traditionally, on smaller scale charts, small shallow depth areas were amalgamated and exaggerated for safety of navigation due to the limitation in displaying larger scale data. Since July 2018, the International Maritime Organization (IMO) mandated ECDIS loaded with official ENCs aboard SOLAS regulated vessels. Furthermore, declining paper charts demand, and challenges associated with maintaining both paper and electronic products, have initiated an international debate on the future of paper charts, while some HOs have already decided to cease production (Kastrisios, Calder, and Bartlett Citation2020). Therefore, it is expected that soon all vessels will have access to the full ENC catalog, particularly the largest scales available for the designated voyage. In pursuing a fully automated solution, converting small shallow depth areas into points is worth investigating. This would streamline the automation of the generalization of depth areas, contours, land areas and coastlines. These points can be portrayed in small scales (possibly with a new custom symbol) to draw the mariner’s attention. Upon zooming in, the larger scale ENC would display the highest level of detail.
In the current implementation, the ANG model does not automatically eliminate collapsed land areas. Instead, it is collapsed to points and left to cartographer’s choice. This is mainly for safety of navigation, as the current model is not yet fully capable of picking dominant land area that affects safety. Future efforts will focus on refining the small land area generalization challenge encompassing aspects such as island selection, exaggeration, and the decision-making process concerning the elimination of specific land area points.
Moreover, selected features like aids-to-navigation are employed as barriers to restrict the generalization of respective polygon and linear features (e.g. depth areas and contours). Future work will investigate the optimization of this approach to prevent under generalizing of affected features while maintaining the barrier positions.
Lastly, it is to be noted that the focus of the ANG model is primarily on addressing the complexities of the ENC database features and the processes involved in automated nautical generalization. This manuscript does not extensively explore the subject of ENC portrayal. Instead, its primary objective is to propose a structured generalization template system for handling ENC features within the context of the database.
7. Conclusions
This paper presented the development of an automated nautical-chart generalization (ANG) model. The model aims to describe and implement generalization steps in going from the largest scale chart data to the target smaller scale with no topological errors. Organized into five main phases, each phase consists of various sub-models that employ generalization operations following a pre-determined sequence to automate the process. The model utilizes a Generalization Rules Spreadsheet (GRS), which is developed from the database schema and the nautical constraint template. The constraint template consists of a formal description of nautical charting rules/guidelines derived from relevant publications. The GRS is the input that drives the data generalization for the desired output scale, using the available generalization algorithms and tools. It contains the required information about the selected feature classes for the target scale, their hierarchy, generalization tolerances, and operations that need to be applied.
The model was tested in three representative real-world scenarios with data from the new reschemed NOAA ENCs portfolio for a selection of 13 feature classes that represent the skin-of-the-earth and other important ENC feature classes, in the three geometric primitives (polygons, lines, and points). The results showed that the model output is topologically correct. However, since the current implementation utilizes existing tools available in ArcGIS Pro which are not specifically tailored to the needs of nautical cartography, the output does not guarantee safety. Therefore, a custom safety validation tool detects depth contours’ safety violations and highlights them for user fixing.
Towards the end goal for a fully automated solution, the developed model is flexible, thus it can be modified to leverage future, more sophisticated, generalization algorithms that meet the application constraints, including safety, as they become available. Future developments shall focus on integrating state-of-the-art technologies for end-to-end automation, along with the inclusion of advanced machine learning techniques. By leveraging the latest advanced technologies, charts production can be accelerated, providing mariners with the most up-to-date and reliable information for safe navigation.
Disclosure statement
No potential conflict of interest was reported by the author(s).
Data availability statement
The data that support the findings of this study are available in figshare at:
https://figshare.com/s/7343dc119ddf6eba00f1.
These data were derived from the following resources available in the public domain: Office of Coast Survey, National Oceanic and Atmospheric Administration https://charts.noaa.gov/InteractiveCatalog/nrnc.shtml#mapTabs-2.
Additional information
Funding
Notes on contributors
Tamer Nada
Tamer Nada is a PhD. researcher and a Cat A Hydrographer Surveyor. He holds a master’s degree in science from the University of Southern Mississippi and is on the cusp of defending his PhD. in Oceanography at the Center for Coastal and Ocean Mapping, University of New Hampshire. His research work focuses on the automated generalization of nautical charts.
Christos Kastrisios
Christos Kastrisios is an associate research professor in the department of Earth, Ocean, and Space/Center for Coastal and Ocean Mapping in the University of New Hampshire. His research work focuses on data generalization, visualization, and topology on nautical charts.
Brian Calder
Brian Calder is a research professor in the Center for Coastal and Ocean Mapping at the University of New Hampshire. He completed a PhD in Electrical and Electronic Engineering focusing on Bayesian statistical in sidescan data and has since focused primarily on bathymetric processing in ocean mapping at scale, and the associated technologies and supporting functionality, such as uncertainty estimation and management. His current research includes systems for volunteer bathymetry collection and processing, and cloud-based bathymetric data processing.
Christie Ence
Christie Ence is the chief of the Chart Standards Group in NOAA Office of Coast Survey’s Marine Chart Division. She holds a Master of Science in Geospatial Information Sciences from the University of Maryland. She is considered a subject matter expert in nautical cartography and geographic information systems (GIS).
Craig Greene
Craig Greene is a product manager in ArcGIS Bathymetry, Maritime and Aviation. He holds a Bachelor of Science with Honors from the University of Oregon in Geography with a focus on GIS and Cartography. His work is focused on applying Agile philosophy to advance software development for the Maritime community, in addition to the modernization of nautical charting technology using web-based charting applications and automating electronic chart production with python.
Amber Bethell
Amber Bethell is a production mapping product specialist in Esri. Her work is focused on manual and automated software testing on platform products including the Defense and Mapping Agency solution.
References
- Alexander, L. 2003. In the American Practical Navigator: Electronic Charts, 199–215. Bethesda, MD: National Imaging and Mapping Agency.
- Beard, M. K. 1991. “Constraints on Rule Formation.” In Map Generalization: Making Rules for Knowledge Representation, edited by B. P. Buttenfield and R. B. McMaster, 121–135. London: Longman Group.
- Burghardt, D., C. Duchene, and W. Mackaness. 2014. “Abstracting Geographic Information in a Data Rich World. Methodologies and Applications of Map Generalization.” Lecture Notes in Geo-Information and Cartography Subseries, Publications of the International Cartographic Association (ICA).
- Burghardt, D., S. Schmid, and J. E. Stoter. 2007. “Investigation on Cartographic Constraint Formalization.” Workshop of the ICA Commission on Generalization and Multiple Representation, Moscow.
- Calder, B., and L. Mayer. 2003. “Automatic Processing of High-Rate, High-Density Multibeam Echosounder Data.” Geochemistry, Geophysics, Geosystems 4 (6): 1048. https://doi.org/10.1029/2002GC000486.
- Cicek, S., M. Koc, and B. Korukcu. 2022. “Urban Generation in Artist’s Style Using Generative Adversarial Networks (GAN).” The 10th International Conference of the Arab Society for Computation in Architecture, Art and Design (ASCAAD), Debbieh, Lebanon. 12–14 October 2022.
- Dias, T., C. Monteiro, A. Moura, J. David, P. Cabral, and F. S. Campos. 2022. “Detection of Discrepancies Between Nautical Charts and New Survey Data Using GIS Techniques.” Cartography and Geographic Information Science 50 (2): 130–142. https://doi.org/10.1080/15230406.2022.2130823.
- Douglas, D. H., and T. K. Peucker. 1973. “Algorithms for the Reduction of the Number of Points Required to Represent a Digitized Line or Its Caricature.” Cartographica: The International Journal for Geographic Information and Geovisualization 10 (2): 112–122. https://doi.org/10.3138/FM57-6770-U75U-7727.
- Duchêne, C., G. Touya, P. Taillandier, J. Gaffuri, A. Ruas, and J. Renard. 2018. “Multi-Agents Systems for Cartographic Generalization: Feedback from Past and On-Going Research.” [Research Report]. IGN (Institut National de l’Information Géographique et Forestière); LaSTIG, équipe COGIT.
- Dyer, N., C. Kastrisios, and L. De Floriani. 2022. “Label-Based Generalization of Bathymetry Data for Hydrographic Sounding Selection.” Cartography and Geographic Information Science 49 (4): 338–353. https://doi.org/10.1080/15230406.2021.2014974.
- Dyer, N., C. Kastrisios, and L. De Floriani. 2023. “Chart Features, Data Quality, and Scale in Cartographic Sounding Selection from Composite Bathymetric Data.” Geo-Spatial Information Science 1–26. https://doi.org/10.1080/10095020.2023.2266222.
- Ence, C. 2018. “Developing Rasterization Procedure for Vector Chart Data.” University of Maryland – GEOG 797, Spring 2018.
- Esri. 2021. ArcGIS Pro (version 3.1.0). “Getting Started with Topographic Production Generalization.” Topographic Generalization Model Documentation by Esri.
- Esri. 2023. ArcGIS Pro (version 3.1.0). ”Production Mapping - Automated Generalization.” Accessed August, 2023. https://www.esri.com/en-us/arcgis/products/arcgis-production-mapping/overview#automated-generalization.
- Foerster, T., J. Stoter, and M. J. Kraak. 2013. “Challenges for Automated Generalization at European Mapping Agencies: A Qualitative and Quantitative Analysis.” The Cartographic Journal 47 (1): 41–54. July 2013. https://doi.org/10.1179/000870409X12525737905123.
- Gaffuri, J. 2007. “Field Deformation in an Agent-Based Generalization Model: The GAEL Model.” GI Days 30: 1–24.
- Galanda, M., and R. Weibel. 2002. “An Agent-Based Framework for Polygonal Subdivision Generalization.” In Advances in Spatial Data Handling, edited by D. E. Richardson and P. van Oosterom. Berlin, Heidelberg: Springer. https://doi.org/10.1007/978-3-642-56094-1_10.
- Guilbert, E., and X. Zhang. 2012. Generalization of Submarine Features on Nautical Charts. XXII ISPRS Congress, 25 August–01 September 2012, Melbourne, Australia.
- Hippmann, F. 2012. “Production and Validation Solutions for Improving ENC Consistency.” L-3, Nautronix. TSMAD 23 – January 2012.
- Huo, X., C. Zhou, Y. Xu, and M. Li. 2022. “A Methodology for Balancing the Preservation of Area, Shape, and Topological Properties in Polygon-To-Raster Conversion.” Cartography and Geographic Information Science 49 (2): 115–133. https://doi.org/10.1080/15230406.2021.1991478.
- IC-ENC. 2022. “IC-ENC S-57 Catalogue.” Accessed September 30, 2023. https://www.ic-enc.org/our-coverage.
- IHO. 2017. ENC Production, Maintenance and Distributing Guidance (S-65). Ed 2.1.0. Monaco: International Hydrographic Organization.
- IHO. 2018. ENC Validation Checks (S-58). Ed 6.1.0. Monaco: International Hydrographic Organization.
- IHO. 2020. ENC Product Specification (S-57 Appendix B.1-Annex A: Use of Object Catalogue for ENC). Ed 4.2.0. Monaco: International Hydrographic Organization.
- IHO. 2021. Regulations of the IHO for International (INT) Charts and Chart Specifications of the IHO. (S-4). Ed 4.9.0. Monaco: International Hydrographic Organization.
- Jonas, M., and J. Melles. 2003. “Study on ENC Loading Strategy in Relation to SCAMIN Effects and Over-Scale Indications.” International Hydrographic Review 4 (2): 41–56.
- Kastrisios, C., and B. Calder. 2018. “Algorithmic Implementation of the Triangle Test for the Validation of Charted Soundings.” Proceedings of the 7th International Conference on Cartography and GIS, 569–576. Sozopol, Bulgaria. 18–23 June 2018.
- Kastrisios, C., B. Calder, and M. Bartlett. 2020. “Inspection and Error Remediation of Bathymetric Relationship of Adjoining Geo-Objects in Electronic Navigation Charts.” 8th International Conference on Cartography and GIS.” Vol.1 Nessebar, Bulgaria.
- Kastrisios, C., B. Calder, G. Masetti, and P. Holmberg. 2019a. “On the Effective Validation of Charted Soundings and Depth Curves.” 2019 US Hydro Conference, Biloxi, MS, USA. 19–21 March 2019. https://doi.org/10.13140/RG.2.2.18705.89440.
- Kastrisios, C., B. Calder, G. Masetti, and P. Holmberg. 2019b. “Towards Automated Validation of Charted Soundings: Existing Tests and Limitations.” Geo-Spatial Information Science 22 (4): 290–303. https://doi.org/10.1080/10095020.2019.1618636.
- Kastrisios, C., N. Dyer, T. Nada, S. Contarinis, and J. Cordero. 2023. “Increasing Efficiency of Nautical Chart Production and Accessibility to Marine Environment Data Through an Open-Science Compilation Workflow.” ISPRS International Journal of Geo-Information 2023:12. https://doi.org/10.3390/ijgi12030116.
- Kastrisios, C., and M. Pilikou. 2017. “Nautical Cartography Competences and Their Effect to the Realization of a Worldwide Official ENC Database, the Performance of ECDIS and the Fulfilment of IMO Chart Carriage Requirement.” Marine Policy 75:29–40. https://doi.org/10.1016/j.marpol.2016.10.007.
- Käuferle, D., and M. Wigley. 2021. “Change Only Updating the 1: 25 000 Swiss National Map.” 30th International Cartographic Conference (ICC 2021), Florence, Italy. 14–18 December 2021. https://doi.org/10.5194/ica-abs-3-141-2021.
- Lamy, S., A. Ruas, Y. Demazeau, M. Jackson, and W. A. Mackaness. 1999. “The Application of Agents in Automated Map Generalizations.”The 19th International Cartographic Conference, Ottawa, Aug 14–21.
- Lecordix, F., J. Gallic, L. Gondol, and A. Braun. 2007. “Development of a New Generalization Flowline for Topographic Maps.” 10th ICA workshop on Generalization and Multiple Representation, Moscow, August 2–3.
- Lovrinčević, D. 2019. “The Development of a New Methodology for Automated Sounding Selection on Nautical Charts.” Nase More 66 (2): 70–77. https://doi.org/10.17818/NM/2019/2.4.
- Mackaness, W. A., A. Ruas, and L. Sarjakoski. 2007. Generalization of Geographic Information; Cartographic Modeling and Applications. Amsterdam; Boston: International Cartographic Association by Elsevier. https://doi.org/10.1016/B978-0-08-045374-3.X5000-5
- Maudet, A., G. Touya, C. Duchêne, and S. Picault. 2014. “Representation of Interactions in a Multi-Level Multi-Agent Model for Cartography Constraint Solving.” In Advances in Practical Applications of Heterogeneous Multi-Agent Systems. The PAAMS Collection. PAAMS 2014. Lecture Notes in Computer Science, edited by Y. Demazeau, F. Zambonelli, J. M. Corchado, and J. Bajo, Vol. 8473. Cham: Springer. https://doi.org/10.1007/978-3-319-07551-8_16.
- Miao, D., and B. Calder. 2013. “Gradual Generalization of Nautical Chart Contours with a Cubic B-Spline Snake Model.” IEEE OCEANS - San Diego (2013), 1–7. https://doi.org/10.23919/OCEANS.2013.6741201.
- Nada, T., C. Kastrisios, B. Calder, E. Christie, C. Greene, and A. Bethell. 2023a. “An Automated Nautical Chart Generalization Model.” US Hydro: Mobile, AL, USA, March 13–16, 2023.
- Nada, T., C. Kastrisios, B. Calder, E. Christie, C. Greene, and A. Bethell. 2023b. “Automated Chart Compilation and Verification of Output Topology and Safety.” 31stInternational Cartographic Conference. International Cartographic Association (ICA), Cape Town, South Africa, August 13–18. https://doi.org/10.5194/ica-proc-5-14-2023.
- Nada, T., C. Kastrisios, B. Calder, E. Christie, C. Greene, A. Bethell, and H. Madhu. 2022. “The Nautical Cartographic Constraints and an Automated Generalization Model.” Canadian Hydrographic Conference, Ottawa, Canada, June 6–9.
- NOAA. 2019a. “Nautical Chart Manual, Volume One, Policies and Procedures.” (Version 2019.1), Office of Coast Survey. https://repository.library.noaa.gov/view/noaa/49956/noaa_49956_DS1.pdf.
- NOAA. 2019b. “Transforming the NOAA ENC - Implementing the National Charting Plan.” November 7, 2019. https://www.nauticalcharts.noaa.gov/publications/docs/nautical-charting-plan.pdf.
- NOAA. 2023. “Status of New NOAA ENCs.” Accessed March 20, 2023. https://distribution.charts.noaa.gov/ENC/rescheme/.
- Owens, E., and R. Brennan. 2012. “Methods to Influence Precise Automated Sounding Selection via Sounding Attribution and Depth Areas.” Canadian Hydrographic Conference, Niagara Falls, ON, Canada, May 15–17.
- Peters, R., H. Ledoux, and M. Meijers. 2014. “A Voronoi-Based Approach to Generating Depth-Contours for Hydrographic Charts.” Marine Geodesy 37 (2): 145–166. https://doi.org/10.1080/01490419.2014.902882.
- Regnauld, N. 2011. “OS Vectormap District: Automated Generalization, Text Placement and Conflation in Support of Making Public Data Public.” 25th International Cartographic Conference, Paris, France, July 3–8.
- Ross, K. 2009. “Ladder versus Star: Comparing Two Approaches for Generalizing Hydrologic Flowline Data Across Multiple Scales.” Paper for Seminar in Cartography, Multiscale Hydrography GEOG 512: USA: Department of Geography, Pennsylvania State University.
- Ruas, A. 1999. “Modèle de généralisation de données géographiques à base de contraintes et d’autonomie.” PhD thesis, Université Marne La Vallée.
- Ruas, A., and C. Plazanet. 1997. “Strategies for Automated Generalization, Advances in GIS Research II.” Proceedings of the 7th International Symposium on Spatial Data Handling, London, UK.
- Sabo, M. N., Y. Bédard, B. Moulin, and E. Bernier. 2008. “Toward Self-Generalizing Objects and On-The-Fly Map Generalization.” Cartographica: The International Journal for Geographic Information and Geovisualization 43 (3): 155–173. https://doi.org/10.3138/carto.43.3.155.
- Shea, K., and B. McMaster. 1989. “Cartographic Generalization in a Digital Environment: When and How to Generalize.” Computer Science, Geography: 56–67.
- Skopeliti, A., L. Stamou, L. Tsoulos, and S. Pe’eri. 2020. “Generalization of Soundings Across Scales: From DTM to Harbour and Approach Nautical Charts.”ISPRS International Journal of Geo-Information 9 (11): 9–11. https://doi.org/10.3390/ijgi9110693.
- Skopeliti, A., L. Tsoulos, and S. Pe’eri. 2021. “Depth Contours and Coastline Generalization for Harbour and Approach Nautical Charts.” ISPRS International Journal of Geo-Information 10 (4): 197. https://doi.org/10.3390/ijgi10040197.
- Socha, W., and J. E. Stoter. 2013. “First Attempts to Automatize Generalization of Electronic Navigational Charts – Specifying Requirements and Methods.” 16th ICA Workshop on Generalization and Map Production, Dresden, Germany, August 23–24.
- Stoter, J. E., V. Altenaa, M. Posta, M. Burghardt, and C. Duchêned. 2016. “Automated Generalization within NMAs in 2016.” In The International Archives of the Photogrammetry, Remote Sensing and Spatial Information Sciences, XLI-B4, 647–652. Prague, Czech Republic. July 12–19. https://doi.org/10.5194/isprs-archives-XLI-B4-647-2016.
- Stoter, J. E., J. Van Smaalen, N. Bakker, and P. Hardy. 2009. “Specifying Map Requirements for Automated Generalization of Topographic Data.” The Cartographic Journal 46 (3): 214–227. https://doi.org/10.1179/174327709X446637.
- Sui, H., X. Zhu, and A. Zhang. 2005. “A System for Fast Cartographic Sounding Selection.” Marine Geodesy 28 (2): 159–165. https://doi.org/10.1080/01490410590953695.
- Touya, G., I. Lokhat, and C. Duchene. 2019. “CartAgen: An Open Source Research Platform for Map Generalization.” International Cartographic Conference, 1–9. Tokyo, Japan. July 2019. https://doi.org/10.5194/ica-proc-2-134-2019.
- Wang, Z., and J. C. Muller. 2013. “Line Generalization Based on Analysis of Shape Characteristics.” Cartography and Geographic Information Systems 25 (1): 3–15. https://doi.org/10.1559/152304098782441750.
- Wilson, M., G. Masetti, and B. Calder. 2017. “Automated Tools to Improve the Ping-To-Chart Workflow.” International Hydrographic Review 17:21–30.
- Yan, J., E. Guilbert, and E. Saux. 2016. “An Ontology-Driven Multi-Agent System for Nautical Chart Generalization.” Cartography and Geographic Information Science 44 (3): 201–215. https://doi.org/10.1080/15230406.2015.1129648.
- Yu, W. 2018. “Automatic Sounding Generalization in Nautical Chart Considering Bathymetry Complexity Variations.” Marine Geodesy 41 (1): 68–85. https://doi.org/10.1080/01490419.2017.1393476.
- Zhang, X., and E. Guilbert. 2011. “A Multi-Agent System Approach for Feature-Driven Generalization of Isobathymetric Line.” In Advances in Cartography and GIScience, 477–495. Vol. 1. Springer. https://doi.org/10.1007/978-3-642-19143-5_27.
Appendix A
Figure A1. The Automated Generalization Model General Flow Chart.
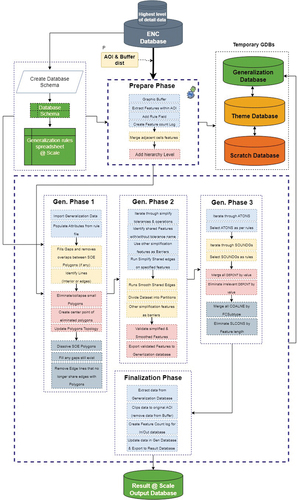
Figure A2. Research Cases (1, 2 and 3) Bar Charts for features before and after generalization.
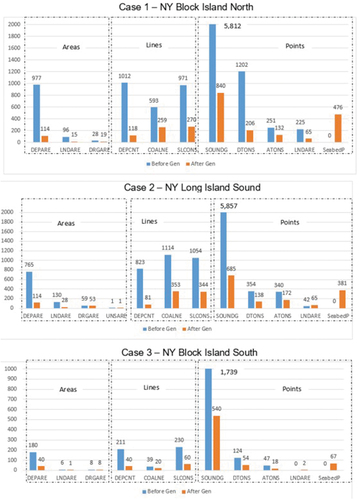
Figure A3. Topology validation tool results for the three research cases.
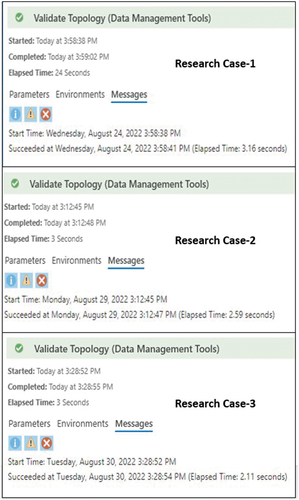
Table A1. Case-1 feature counts before and after generalization (only those in bold are used from before generalization for the calculations).
Table A2. Case-2 feature counts before and after generalization.
Table A3. Case-3 feature counts before and after generalization.
Table A4. Study area ENC (title, name, edition and scale).