
 ?Mathematical formulae have been encoded as MathML and are displayed in this HTML version using MathJax in order to improve their display. Uncheck the box to turn MathJax off. This feature requires Javascript. Click on a formula to zoom.
Abstract
Wildland fires result in a unique signal detectable by multispectral remote sensing and synthetic aperture radar (SAR). However, in many regions, such as Southeast Asia, persistent cloud cover and aerosols temporarily obstruct multispectral satellite observations of burned area, including the MODIS MCD64A1 Burned Area Product (BAP). Multiple days between cloud free pre- and post-burn MODIS observations result in burn date uncertainty. We incorporate cloud-penetrating, C-band SAR-with the MODIS MCD64A1 BAP in Southeast Asia, to exploit the strengths of each dataset to better estimate the burn date and reduce the potential burn date uncertainty range. We incorporate built-in quality control using MCD64A1 to reduce erroneous pixel updating. We test the method over part of Laos and Thailand during April 2016 and found average uncertainty reduction of 4.5 d, improving 15% of MCD64A1 pixels. A new BAP could improve monitoring temporal trends of wildland fires, air quality studies and monitoring post-fire vegetation dynamics.
Introduction
Wildland fires are an important ecological process affecting ecosystems at multiple spatial scales (Roberts Citation2000; Saha Citation2002; Vadrevu and Justice Citation2011). Fires can lead to the destruction of vegetation cover with impacts on plant composition, hydrological processes and soil erosion (Vogl Citation1974). Moreover, wildland fires can release not only a large amount of greenhouse gasses such as carbon dioxide (CO2), and carbon monoxide (CO), but more importantly they release pollutants critical to air quality and public health, such as coarse (PM10) and fine-particulate matter (PM2.5), black carbon (BC) and other absorbing aerosols (Crutzen and Andreae Citation1990; Andreae and Merlet Citation2001; Akagi et al. Citation2011). The impacts of biomass burning events can be far reaching with long-range transport demonstrated in multiple regions of the world (Ramanathan and Carmichael Citation2008; Badarinath et al. Citation2009; Ikeda and Tanimoto Citation2015; Sonkaew and Macatangay Citation2015; Kusumaningtyas and Aldrian Citation2016; Saikawa et al. Citation2017). The effects of wildland fires can persist for weeks to months impacting atmospheric chemistry, weather and biogeochemical cycles, in addition to human health (Yan et al. Citation2006; Badarinath et al. Citation2009; Vadrevu et al. Citation2012; Cristofanelli et al., Citation2014). For example, clearing of tropical savannas and forests has been found to lead to a warmer and drier climate, further accelerating fire occurrence in a positive feedback loop (Hoffmann et al. Citation2002).
One of the prevalent satellite-based global burned area products available today is the MODIS MCD64A1 burned area product, which is based on daily surface reflectance imagery from the sun-synchronous, polar-orbiting MODIS Aqua and Terra multispectral satellite constellation with several daily observations (Giglio et al. Citation2009). A recent study found that nearly half of burned area pixels are detected within one day of a coincident MODIS active fire, and 75% within 4 d for the MCD45 algorithm (Boschetti et al. Citation2010). Although the newer MCD64A1 collection 6 algorithm found about 68% of burned areas occur within 2 d of an active fire (Giglio et al. Citation2018). Unfortunately, much of the remaining data have a wider disparity. It is not unforeseen for the date uncertainty of a burned area pixel to exceed 20 d due to cloud cover and aerosols, among other factors impacting clear surface reflectance observations needed to detect a burned area (Giglio et al. Citation2013). Similar to the active fire products, the optical-based burned area algorithm is also susceptible to cloud cover and aerosol effects, as pixels contaminated by cloud cannot be used to determine if a burn has occurred on a particular day (Schroeder et al. Citation2008; Giglio et al. Citation2009). Therefore, imagery from another day must be used in its place. This aerosol and cloud cover leads to uncertainty in the date of burning. For a variety of applications, it is important to have the most accurately estimated date of burning, and a reduced date uncertainty range. For example, many biomass burning emissions and air quality studies rely on the burned area products as input into atmospheric models (van der Werf et al. Citation2006; Randerson et al. Citation2012; Kukavskaya et al. Citation2013; Marlier et al. Citation2013; Gaveau et al. Citation2014; Karambelas et al. Citation2018). Inputs into atmospheric chemistry and transport models include wind speed and direction, planetary boundary layer heights, temperature and precipitation (Atwood et al. Citation2013). All of these mentioned factors can fluctuate significantly over the course of a very short time period. Thus, refining the date of burning and the associated burn date uncertainty, as undertaken in this research, could lead to improvements and significant changes to results in regional air quality assessments important for estimating impacts on transport or human health, among other ecological or environmental applications. Moreover, accurate burn dates are also important for assessing changes in fire regimes over time, as well as for establishing a baseline in assessing post-fire regrowth rates (Lentile et al. Citation2006; Palandjian et al. Citation2009).
Of the different regions in the world, Southeast Asia is one of the most heavily impacted by biomass burning aerosols and cloud cover, which can delay multispectral satellite-based burned area detection (Justice et al. Citation2002; Roy and Boschetti Citation2009; Wilson and Jetz Citation2016). Moreover, along with boreal areas, the Southeast Asia region experiences some of the highest burn date uncertainty (often 20+ days) in the world (Boschetti et al. Citation2010; Giglio et al. Citation2013; Li et al. Citation2018), making this region an important focus for developing methods to reduce the burn date uncertainty. Southeast Asia is also subject to large amounts of toxic air pollution emissions resulting from agriculture, forest biomass burning and other anthropogenic sources (Streets et al. Citation2003; Ohara et al. Citation2007; Vadrevu et al. Citation2015; Lasko et al. Citation2018; Oanh et al. Citation2018).
C-band synthetic aperture radar (SAR) with its cloud-penetrating ability has the potential to improve upon burned area date uncertainty. While not addressing burn date improvement specifically, previous studies have mapped burned areas using SAR data in different landscapes and using various sensors including ERS-1, ERS-2, ALOS PALSAR, Sentinel-1, Radarsat-2 and TerraSAR-X often based on a decrease in backscattered energy after the fire event (Kasischke et al. Citation1994; Liew et al. Citation1999; Siegart and Hoffmann 2000; Bourgeau-Chavez et al. Citation2002; Gimeno et al. Citation2004; Goodenough et al. Citation2012; Polychronaki et al. Citation2013; Jenkins et al. Citation2014; Engelbrecht et al. Citation2017; Lohberger et al. Citation2018). Moreover, some studies have also integrated both SAR and multispectral imagery for burned area estimation (Siegert and Hoffmann Citation2000; Stroppiana et al. Citation2015a, Citation2015b; Ahmed et al. Citation2016; Verhegghen et al. Citation2016; Peve et al. Citation2018). SAR has also been implemented for burn severity mapping, with C and L-band SAR found to be most sensitive to post-fire forest regrowth monitoring (Bourgeau-Chavez et al. Citation1994; Tanase et al. Citation2010; Tanase et al. Citation2011). However, the C-band SAR backscatter can also be influenced by soil moisture and forest stand age (Kalogirou et al. Citation2014), but the decrease in backscatter from precipitation is generally low at about 1 dB (El Hajj et al. Citation2016). Research has also suggested that within shrubland and open forest landscapes, C-band SAR has relatively strong performance for burned area mapping (Menges et al. Citation2004). A decrease in cross-polarized SAR backscatter has been documented after a fire damages or degrades the vegetation; the resulting signal is dependent on the SAR wavelength with C-band generally most sensitive to smaller woody branches and leaves and also potentially influenced by local topography, some of which can be accounted for in the calibration process (Stroppiana et al. Citation2015a, Citation2015b; Imperatore et al. Citation2017). Mapping of burned areas using only SAR can be difficult or limited in some landscapes as the burned area signal could be confused with other processes associated with a major change in backscatter, such as a forest clearing or flooding. Moreover, the burned area signal persistence time can be a limiting factor when monitoring with satellites with low temporal resolution (Melchiorre and Boschetti Citation2018). However, multispectral optical imagery with shortwave infrared and other bands have been proven to globally detect burned area accurately due to mapping the unique spectral signature of burn scars in most landscapes (Roy et al. Citation2008; Giglio et al. Citation2009; Roy and Boschetti Citation2009; Padilla et al. Citation2014), but with limitations in croplands (Giglio et al. Citation2013; Hall et al. Citation2016; Zhang et al. Citation2016; Lasko et al. Citation2017; Zhang et al. Citation2018; Liu et al. Citation2019). The median burned area signal persistence time exceeds 29 d, however, for some areas it is much lower, which could lead to undetected burns or higher uncertainty (Melchiorre and Boschetti Citation2018). Therefore, combining the strengths of SAR (e.g. ability to detect vegetation change under cloud cover) and the strengths of multispectral imagery (e.g. ability to discriminate vegetation change from burned area) could prove to be an effective strategy for improvement to burned area mapping algorithms and applications, as mentioned in previous studies (San-Miguel-Ayanz et al. Citation2009; Chuvieco et al. Citation2019).
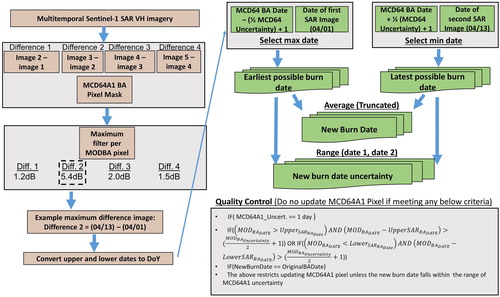
In this study, to demonstrate the need for improvements to existing burn date estimates and associated uncertainty range, we assess the current status of MODIS burned area date uncertainty range for selected countries in the Southeast Asia region on a country-level scale. Within a mosaic landscape of Northern Laos and Thailand consisting of mostly evergreen forest and shrubland, we prototype the potential for SAR imagery to improve upon the date of burning, and associated date range of uncertainty. We use a timeseries of Sentinel-1 C-band SAR masked based on MODIS burned area 500 m burn pixels in order to improve upon burn date and associated burn date uncertainty range based on a robust, straightforward algorithm calculating a simple difference between dates and applying a maximum filter within each MODIS burn pixel (). The resulting combined SAR and optical algorithm exploits the benefits of multispectral remote sensing (i.e. unique spectral signature of burns, validated dataset) with C-band SAR (weather-penetrating ability, sensitivity to vegetation structure).
Figure 1. Overview flowchart of the combined SAR-optical burn date improvement and burn date uncertainty range reduction. It uses Sentinel-1 VH imagery difference images in conjunction with the MCD64A1 burn pixels and associated ancillary data, a maximum filter, and then a date improvement and uncertainty reduction algorithm shown on the right side.
Data and study area
Sentinel-1 C-band SAR
The Sentinel-1 satellite from the European Space Agency (ESA) provides C-band SAR imagery (5.4GHz) near-globally with at least a 12-d revisit time (6 d for areas with Sentinel-1B data). The Sentinel-1 imagery is acquired as dual-polarized, interferometric wide swath (IW) with Vertical transmit – vertical receive (VV), and vertical transmit – horizontal receive (VH) polarizations. The ground-range detected data are originally at a nominal spatial resolution of 5 m × 20 m prior to pre-processing. We acquired level-1 ground-range detected imagery in descending mode from the Alaska Satellite Facility (https://vertex.daac.asf.alaska.edu/#), which holds a complete mirror of ESA’s Sci-hub. The imagery was processed using the latest available version of the free and open source Sentinel-1 SNAP toolbox (Zuhlke et al. Citation2015). The data were processed following guidelines including applying restituted orbit files for accurate orbit and geolocation information and thermal noise reduction. The data are then calibrated into gamma nought backscatter which accounts for possible incidence angle variation effects on backscatter (Small et al. Citation2009), then it is terrain-corrected and geolocated using the latest SRTM DEM at 30 m resolution resampled with cubic convolution. A refined lee speckle filter is applied in order to reduce effects from constructive and destructive interference and noise. Lastly, the data are converted into log scale with final units in decibels (dB). Given our processing techniques and the relatively small study area with consistent orbit acquisition, incidence angle effects were expected to be minimal. We acquired 5 SAR images () from the ASF over Northern Laos and Northern Thailand with dates ranging from 20 March 2016 to 7 May 2016 acquired every 12 d with the same orbit, acquisition mode and sensor incidence angle. A decrease in C-band SAR VH backscatter is generally associated with vegetation fire events due to destruction of vegetation (Kurum Citation2015; Verhegghen et al. Citation2016; Imperatore et al. Citation2017).
Table 1. Sentinel-1 VH SAR imagery acquired over Northern Laos and Thailand to demonstrate the algorithm for the local peak burning month of April.
MODIS burned area (MCD64A1)
The MODIS burned area product (collection 6) generally identifies fire-affected land areas by detecting a change from vegetated surface into char, ash or soil (Roy Citation1999). The MCD64A1 burned area product uses daily MODIS (Aqua and Terra) surface reflectance imagery trained with the MODIS active fire product. The nominal 500 m resolution product is based on a dynamic threshold of the surface reflectance data created from a burn-sensitive spectral band index derived from MODIS 1240 and 2130 nm bands and incorporating temporal variability and guided by the MODIS active fire hotspot locations (Roy et al. Citation2008; Giglio et al. Citation2009, Citation2013; Humber et al. Citation2018). The burned area product is provided in hierarchical data format (HDF) and includes layers used in this study: (1) ‘Burn date’ the approximate day of burning (1–366), ‘burn date uncertainty’ estimated uncertainty in the date of burn measured in days. The burn date uncertainty is often associated with lack of a clear signal in the MODIS surface reflectance imagery (e.g. from clouds, but also other phenomena). A minimum of 1 day uncertainty is applied for all burn pixels, as described in the latest MODIS collection 6 user’s guide (Giglio et al. Citation2016). The MODIS burned area product and MODIS active fire product have been extensively validated in several regions of the world and are regularly subject to algorithm refinements (Boschetti et al. Citation2008; Roy et al. Citation2008; Schroeder et al. Citation2008; Roy and Boschetti Citation2009). We acquired the freely available monthly HDF product for the previous 10 years (January 2008 – December 2017) from the University of Maryland FTP (http://modis-fire.umd.edu/pages/BurnedArea.php?target=Download). For ease of data visualization purposes, we display all resulting figures in geographic coordinates.
MODIS active fire product
The latest collection 6 MODIS active fire product was downloaded from University of Maryland. The product is derived from the Aqua and Terra satellites which are sun-synchronous, polar-orbiting satellites with local overpass of approximately 10:30am/pm and 1:30am/pm and daily revisit time. The MODIS Advanced Processing System (MODAPS) processes the resulting data using the enhanced contextual fire detection algorithm processed into the collection six active fire product (Giglio et al. Citation2003, Citation2016). We acquired the active fire product for 2016 for visualization and comparison purposes with the SAR and burned area products.
Study area
We first analyze the MCD64A1 product date uncertainty within a large portion of the Southeast Asia countries including: Laos, Vietnam, Cambodia, Indonesia, Philippines, Thailand, Myanmar and Malaysia. Of the different countries, the continental countries of Myanmar, Laos and Thailand experience some of the most vegetation fire activity from a variety of land cover types including deciduous and evergreen forest, croplands, shrublands during February–April (Vadrevu et al. Citation2014, Citation2015). Whereas, peak fire season in the southern portion of the study area is during August–October, such as Indonesia and Malaysia due to the monsoonal differences. The Southeast Asia region experiences some of the highest cloud coverage in the world with implications on applications such as cropland phenology mapping (Whitcraft et al. Citation2015; Wilson and Jetz Citation2016). The region is also undergoing some of the most rapid land cover and land use changes combined with strong population growth, often subjecting the populace to harmful air pollution emissions from biomass burning and other anthropogenic sources (Ohara et al. Citation2007; Vadrevu et al. Citation2017). After assessing the MCD64A1 burned area product, we focus on one SAR scene (path 62, frame 528) within Northern Laos and the border of Thailand. During April of 2016, a major fire event was observed in the MCD64A1 burned area and selected for further analysis. This area is covered by a mosaic of land cover with mostly evergreen forest and shrublands, mixed in with some agricultural lands. Adjacent areas to the east closer to Luang Prabang have also been subjected to extensive slash and burn practices (Inoue Citation2018). The study area is visualized more in depth in the methods section.
Methods and algorithm development
In this article, we prototype a combined SAR-multispectral algorithm using multitemporal Sentinel-1 SAR imagery in conjunction with the multispectral-based MODIS burned area dataset (MCD64A1) to better estimate the MCD64A1 date of burning and also reduce the uncertainty (in days) in the date of burning for pixels afflicted by lack of clear observations or other mitigating surface conditions. C-band SAR with its cloud-penetrating ability is effective at detecting vegetation disturbance events associated with fires, phenology, vegetation structural changes and moisture content variability useful for a variety of applications (Palmann et al. Citation2008; Imperatore et al. Citation2017; Lievens et al. Citation2017; Torbick et al. Citation2017; Reiche et al. Citation2018; Whelen and Siqueira Citation2018) and has also been used for burned area mapping as mentioned in the introduction. We use the MODIS burned area product at its nominal 500 m resolution to mask the extent of the SAR data to the burned area pixels. Thus, only SAR pixels within detected burned areas are used in order to limit potential for erroneous burned area detections.
Burn date uncertainty
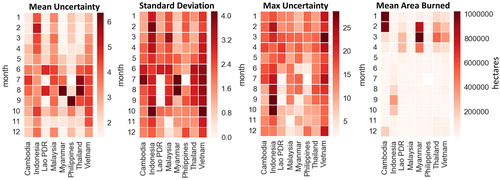
First we process the MCD64A1 data to highlight spatial patterns of burn date uncertainty across much of Southeast Asia during the peak fire season. We derive monthly averages over the previous 10 years (2008–2017) for: burn date uncertainty, standard deviation, and maximum uncertainty, as well as the burned area in hectares, all based on a zonal statistics algorithm.
SAR-multispectral burn date and uncertainty improvement algorithm
Subsequently, we prototype the combined SAR-multispectral burn date algorithm within 1 SAR scene over an area of moderately high MCD64A1 burn date uncertainty in Northern Laos and Thailand during a wildland fire event in April 2016 (). The flowchart of the algorithm is shown in and an example calculation for a pixel is shown in . We start with a collection of processed VH-polarized IW SAR imagery, found to be generally more sensitive to burned area and vegetation disturbance (e.g. biomass change) than VV-polarization (Huuva et al. Citation2017; Imperatore et al. Citation2017). The acquired SAR imagery ranges from late-March through early-May as shown in . The earlier and later dates of SAR imagery were selected as described in EquationEquation 1(a(1)
(1) ,b) to correspond with the April 2016 MODIS burned area. Each SAR image was resampled from native resolution into nominal 100 m pixels for the purpose of noise reduction, and so that only relatively larger vegetation disturbance events corresponding to the larger MODIS BA pixel are detected. Simple difference images were then generated from the SAR gamma nought backscatter imagery between each sequentially dated image (e.g. 1 April–20 March, 13 April–1 April, etc.). Then within each MCD64A1 burned area pixel, a maximum filter is applied to the SAR difference images to obtain the pixel with the biggest decrease in backscatter between the two SAR acquisition dates. Therefore, within each BA pixel, the SAR difference image with the greatest decrease in backscatter is used to refine the burn date range (EquationEquation 2
(2)
(2) ), as supported by previous studies which found C-band VH backscatter decreases significantly after a fire (Kurum Citation2015; Verhegghen et al. 2016; Mathieu et al. Citation2018) and as discussed in the introduction section. The two SAR dates (earlier than MCD64A1 and later than MCD64A1) from the difference image are extracted and used in conjunction with the MCD64A1 burn date and burn date uncertainty range as described in the subsequent section.
Figure 2. April BA uncertainty with VH multitemporal SAR composite and burned area overlaid. Signal from burned pixels is evident.
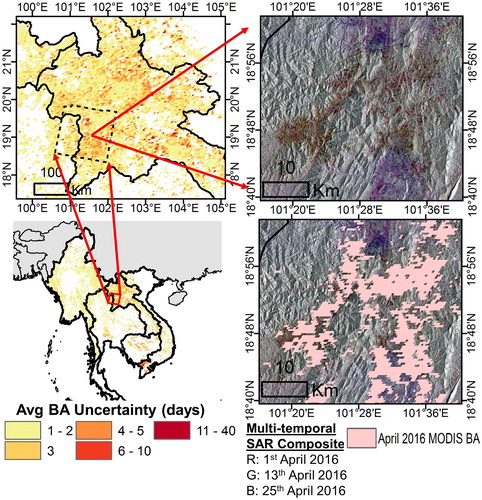
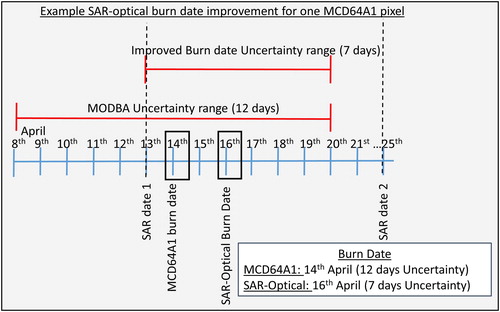
Figure 3. Example SAR-assisted burn date implementation for a MODIS Burned area Pixel during April. It demonstrates that at the lower date level the SAR data (Max Backscatter decrease detected at VH difference image for 13 April and 25 April) provides the lowest possible burn date, while at the upper date level the MCD64A1 uncertainty upper limit at 23rd April is the limiting factor. The new burn date is the average date between the upper and lower date limits. Therefore, using an effective combination of SAR and optical-based data can improve estimated burn date and reduce date uncertainty.
The next step is to estimate the range of dates when burning could have occurred for each pixel (green section of ; ). We use both the earlier and later dates from the maximum SAR difference image (e.g. 13 April and 25 April), as well as the MCD64A1 date of burning and uncertainty range in days. The earlier limit of the range of dates for possible burning is determined from whichever is later in date between the first date of the selected SAR difference image, or the earlier bounding date from the MCD64A1 burn date uncertainty range as shown in and . The latest possible burn date is the earlier of the second date of the SAR difference image and the later of the MCD64A1 burn date uncertainty range (same as EquationEquation 3(3)
(3) but with addition instead of subtraction). Thus, the new SAR-multispectral burn date is the average DoY between the later and earlier bounding dates, and the new uncertainty is the range between these dates as shown in . For clarity, we show the procedure for this in an example burned area pixel in . We emphasize that in this combined algorithm, either the MCD64A1 burn date uncertainty range or the SAR imagery acquisition dates are used for refining the date of burning and associated date uncertainty. The novelty of this combined SAR-multispectral algorithm is that pixels with fewer than 12 d of burn date uncertainty (Sentinel-1A’s overpass frequency) can be improved, providing temporal utility even without Sentinel-1B observations. However, increased precision could be obtained with the full Sentinel-1A/1B constellation.
(1)
(1)
(2)
(2)
(3)
(3)
Quality control and algorithm refinement
To improve upon the accuracy of the algorithm and to reduce possible errors from non-fire disturbance events which SAR is sensitive to such as a forest clearing or flooding, we use logical statements and ancillary data to prevent erroneously updating MCD64A1 burned area pixels. We include candidate MCD64A1 burned area pixels for updating by the SAR-optical algorithm only if the date uncertainty exceeds 1 day, and the MCD64A1 burn date does not equal the SAR-optical burn date (), as this would not offer any added benefit from using the SAR. In addition, the following logical statement is also used (EquationEquation 4):
In this logical statement, a MODIS burned area pixel is left unchanged unless the date of maximum SAR backscatter decrease is within the range of known uncertainty from the MCD64A1 product – otherwise the estimated date may be incorrect due to potential confusion with non-fire disturbance events which are also known to impact SAR backscatter. It is assumed that if the SAR maximum decrease of backscatter occurs in this range, that it is attributed to the fire event due to coinciding with MCD64A1. Because the algorithm only updates the burn date and associated date uncertainty if at least one of the SAR acquisitions falls within the MODIS uncertainty range, we are able to exclude erroneous pixels (e.g. non-fire disturbance events) from updating in the MCD64A1 product as a form of quality control (). We then compare our SAR-multispectral dates with the original burned area data and the MODIS active fire product for a preliminary measure of accuracy of the algorithm. We also demonstrate how the SAR-multispectral algorithm would perform if we did not use the aforementioned quality control.
Results
MCD64A1 date uncertainty
We visualize the spatial pattern of monthly averaged MCD64A1 burn date uncertainty during the peak fire months of January – April and September – October determined from the trends in burned area (). Clusters of high uncertainty are seen across parts of Indonesia in September – October, as well as Laos, Cambodia and Southern Vietnam during February – April with particularly high uncertainty observed over the agricultural region of the Mekong River Delta in Vietnam corresponding to the rice straw burning season (Van et al. 2014; Lasko and Vadrevu Citation2018). A country-level analysis based on zonal statistics is shown in . The monthly averaged (2008–2017) average uncertainty (in days), standard deviation of uncertainty, and maximum of uncertainty, as well as burned area in hectares are all consistently high in Indonesia, Vietnam, Thailand and Laos. Indonesia experiences average maximum uncertainty exceeding 25 d during July – October which is coinciding with the peak burning months of August – October. Laos experiences the highest burned area during April and thus, we selected that month for further analysis with the SAR-optical algorithm.
Figure 4. MCD64A1 burn date uncertainty in days for the 500 m BA product. For visualization purposes, product rescaled to approximately 5 km. Very high uncertainty can be seen in the Mekong Delta, Borneo and Sumatra, as well as Northern Laos. Uncertainty is shown for peak burning months.
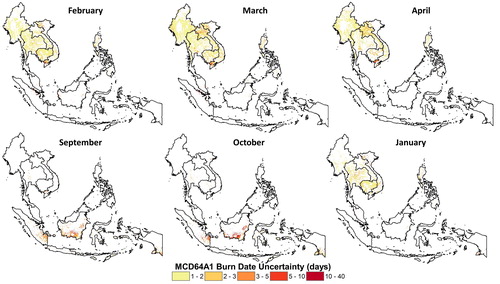
Figure 5. Country-level burn date uncertainty statistics for all Southeast Asia averaged per month (2008–2017) with (a) average uncertainty (days), (b) average standard deviation of uncertainty (days), (c) average maximum uncertainty (days) and (d) average burned area (in hectares) shown only for the study area countries.
SAR-optical burn date and reduction in uncertainty
illustrates the simple difference images over a portion of the study area over Northern Laos and Thailand for (1) 25 April – 13 April, and (2) 7 May – 25 April. The April burned areas and MODIS active fires are overlaid and illustrate that large decreases in backscatter are evident throughout the pixels of the first image when much of the burning occurred (as indicated in the MODIS products). Whereas, during the subsequent date a very slight increase backscatter is observed. In , based on the histogram plot we show the maximum backscatter decrease within MCD64A1 pixels is most commonly in the range of 3–4 dB VH gamma nought backscatter – in line with results from previous studies mapping SAR burned areas (Jenkins et al. Citation2014; Imperatore et al. Citation2017), and also higher than the estimated 1 dB VH backscatter decrease on forested areas due to precipitation (El Hajj et al. Citation2016). Some pixels decrease as much as 10 or 11 dB, likely attributed to severely burned areas. The average backscatter decrease is 3.9 dB with a standard deviation of 1.4 dB. We highlight an example of the SAR VH backscatter and SAR image selection process within an example MCD64A1 pixel in .
Figure 6. MODIS collection six active fires and burned areas for April 2016 overlaid on a difference image of 100 m Sentinel-1 VH gamma-nought dB backscatter (25 April – 13 April). This example area was mostly subject to burning between this date range. The high decrease in backscatter between the two dates is evident in most of the burn pixels. It also appears that some BA’s may have been missed (area circled). Imagery after the fires, shows an increase in backscatter following fire recovery and management practices.
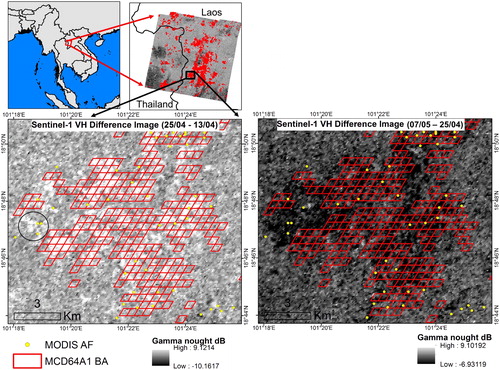
Figure 7. Distribution plot binned into 1 dB intervals showing the maximum decrease in VH backscatter within each MCD64A1 pixel.
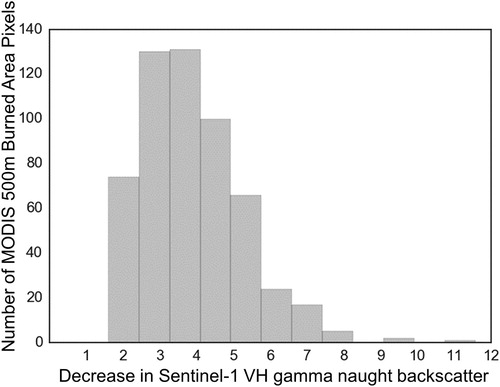
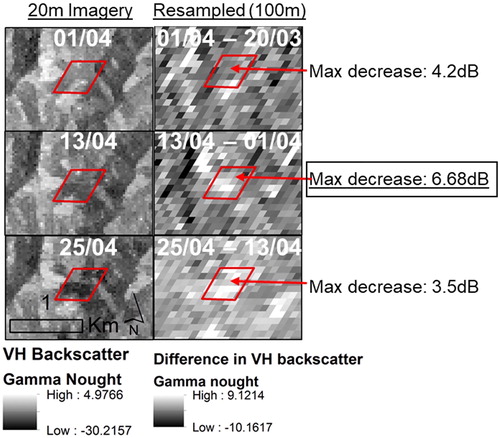
Figure 8. Illustrates the processed Sentinel-1 VH imagery on the left column over a selected MCD64A1 burn pixel for the month of April at native resolution. The right column shows the difference image (i.e. 1 April minus 20 March) for the 100 m resampled data. The maximum decrease in backscatter occurred between 1 April and 13 April, suggesting the burn date falls within this range. For quality control, the date of burn is further refined based on MODIS DoY burn and associated DoY uncertainty (in days).
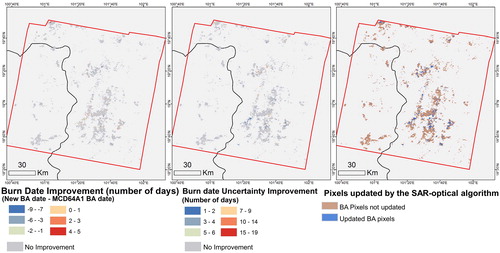
We apply the SAR-assisted burn date improvement and burn date uncertainty reduction algorithm as described in the methods section. We illustrate the resulting spatial patterns in . In the first panel of the figure, the number of days of burn date improvement are shown, whereas the second panel illustrates the reduction in date uncertainty. Much of this improvement tends to be clustered on the Laos side of the SAR scene in this particular case. The far right panel highlights the MCD64A1 pixels which were not updated based on our quality control proceedure which removed pixels based on a number of criteria described in the methods section. We show the value distribution binned on 1-d intervals for number of days of improvement in burn date and number of days of reduction in date uncertainty (). On average, the burn date decreased by 1.5 d with the most common change being a decrease of 4 d. Relatively fewer SAR-optical burn dates indicated a later burn date as compared to the MCD64A1 burn date. The average reduction in burn date uncertainty was much larger at about 4.5 d with some pixels reduced by as much as 19 d. Most commonly, the uncertainty reduction was modest at about 2 d.
Figure 9. Spatial variation of MCD64A1 pixels which were updated by the SAR-optical algorithm for (a) improved burn dates, and (b) reduction in burn date uncertainty. Pixels were only updated if they matched the criteria described in the quality assurance algorithm.
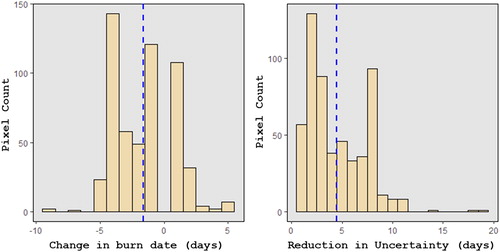
Figure 10. Pixel counts shown for the SAR-optical burned area product with: (a) change in burn date from the original MCD64A1, and (b) reduction in burn date uncertainty as compared to the original MCD64A1. The dotted line is drawn at the mean value.
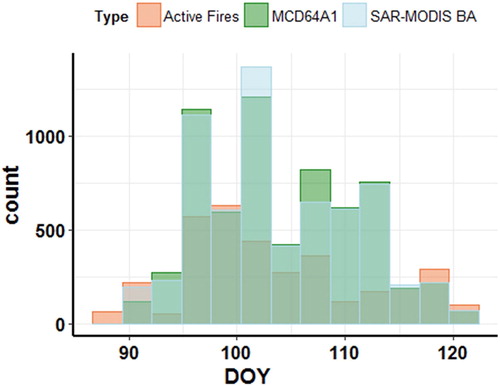
Robust and remote accuracy assessment is difficult because fire scars are most likely obscured by cloud cover or aerosols. In-situ data are needed to indicate the exact date of burn. However, as a basic measure of performance we found that approximately 56% of MODIS burned area pixels would be updated with SAR-optical burn dates that fall within the MODIS burn date’s associated uncertainty. However, because of our algorithm quality control which prevents updating of erroneous cells, this issue is assuaged, and about 15% of MCD64A1 pixels in the SAR scene are updated with improved burn dates and burn date uncertainty (out of all pixels with uncertainty > 1 day). We also visualize the distribution of burn dates (DoYs) for the original MCD64A1, the SAR-optical burned area, and the MODIS active fire product binned into approximately 3-d intervals (). The results show that around DoY 91 and 102 the SAR-optical algorithm indicated more pixels burned than captured in the MCD64A1 data. Whereas, around DoY 107 the biggest difference was observed between the two algorithms with MCD64A1 detecting about 100 more burn pixels.
Figure 11. Histogram plot binned into approximately 3-d intervals showing the distribution of the day of year (DoY) of burning shown for the MODIS active fire points, original MCD64A1 pixels, and combined SARoptical burned area pixels.
Discussion
This algorithm integrates the strengths of SAR (e.g. weather-penetrating capability and vegetation structure sensitivity) with the strengths of multispectral remote sensing (e.g. spectral resolution). One major novelty of this research is that the extensively-validated MODIS MCD64A1 burned area product, exclusively, is used to detect burned areas. Then SAR, with its well-proven ability to detect vegetation destruction, is exploited to better estimate the date of burning in pixels with burn date uncertainty – often attributed to cloud cover or aerosols obstructing MODIS observations. This study relies upon several underlying assumptions. We assume the maximum decrease in backscatter is associated with a fire event, thereby assuming the decrease to be attributed to a vegetation disturbance event is a burn (instead of noise or precipitation) – which is supported by the literature in land covers other than wetlands or croplands (Tanase et al. Citation2010; Karila et al. Citation2014; Kurum Citation2015; Verhegghen et al. Citation2016), especially considering the pixel is already marked as burned by the MCD64A1 algorithm. Further, if the maximum backscatter decrease occurs outside the range of MODIS burn date uncertainty, then it is excluded from the update – thereby mitigating this issue. Moreover, this algorithm would need tuning in order to perform well in some temporally-dynamic landscapes, especially croplands, with their naturally wide dynamic ranges of backscatter over short periods of time (Torbick et al. Citation2017) which could be confused with a burn event unless a more refined algorithm is developed. While this algorithm does not directly account for impact of moisture on backscatter, rainfall events (aside from flooding) have been found over forests to impact SAR VH backscatter at similar incidence angles by about 1 dB (El Hajj et al. Citation2016), which is generally lower than a fire event which alter vegetation structure (Mathieu et al. Citation2018). Though this was not an issue in this research, there is also a need to develop the algorithm so that it could account for variation in acquisition mode (descending vs ascending), and different polarizations so that more consistent imagery through time can be obtained. Inclusion of co-polarized bands (VV) may also reduce burned area commission errors (Belenguer-Plomer et al. Citation2018). Lastly, we acknowledge that a robust accuracy assessment would be beneficial, but might demand an extensive ground survey. In this article we demonstrate a method using C-band SAR combined with optical-based MODIS burned area and built-in quality control for reducing the burn date uncertainty in a cloudy region of Southeast Asia.
The improvement in burn date and reduction in associated uncertainty resulting from this study could prove useful for a variety of applications including those related to multi-sensor biomass burning inventories, associated air quality impact studies, temporally-consistent emissions comparisons, fire early-warning systems, post-impact fire assessments, timing of drought impacts on fire, changes to fire regime patterns over time, and others (Prasad et al. Citation2002; Palandjian et al. Citation2009; Singh et al. Citation2009; Kanabkaew and Oanh Citation2011; Reid et al. Citation2013; Hayasaka et al. Citation2014; Gibe and Cayetano Citation2017; Shi and Matsunaga Citation2017; van der Werf et al. Citation2017; Zúñiga-Vásquez et al. Citation2017; Hayasaka and Sepriando Citation2018; Itahashi et al. Citation2018; Koplitz et al. Citation2018; Nguyen et al. Citation2018). Some of these example studies rely upon dynamic atmospheric conditions which change from day-to-day such as wind speed and direction. Thus, improvement in date of burning and reduction in associated uncertainty range in days are important factors in studies using multispectral burned area products. Moreover, improvements are critical for studies analyzing fire regimes (trends, start/end of season, etc.). We demonstrated the combined SAR-multispectral algorithm using the MODIS MCD64A1 burned area product, however, C-band SAR could be incorporated into other existing multispectral burned area products (Roy et al. Citation2008; Tansey et al. Citation2008; Alonso-Canas and Chuvieco Citation2015; Hall et al. Citation2016; Huang et al. Citation2016; Hawbaker et al. Citation2017). There is potential to incorporate SAR with the higher spatial resolution Suomi NPP VIIRS burned area product once it is fully developed and freely available (Oliva and Schroeder Citation2015; Urbanski et al. Citation2018).
Conclusion
We develop a combined SAR and multispectral algorithm to better estimate dates of burning and reduce associated burn date uncertainty in the MODIS MCD64A1 burned area product, and test it within a region of moderately-high burn date uncertainty in Northern Laos and Thailand during April 2016. This algorithm uses temporal information (burn date, burn date uncertainty range) from MCD64A1 combined with resampled Sentinel-1 VH cross-polarized imagery pairs based upon a combination of image differencing between sequential dates, and a maximum filter for backscatter decrease within each MCD64A1 burn pixel, combined with inherent quality control to minimize incorrectly estimated SAR-optical burn dates. Within MCD64A1 fire pixels we found an average VH backscatter decrease of 3.9dB (σ = 1.4dB) between pre- and post-fire images, which is significantly higher than observed backscatter decreases due to precipitation. Overall, we found 15% of MCD64A1 burn pixels containing uncertainty were updated with improved dates and reduced date uncertainties. We found an average reduction in date uncertainty by about 4.5 d and average change in estimated burn date of ˗1.5 d. Incorporating C-band SAR imagery to better estimate dates of burning is promising for burned area mapping applications and will benefit fire regime monitoring, biomass burning and associated air quality studies, and other applications which require better estimates of burn dates at regional to global scales. In the future, we plan to further refine the algorithm and incorporate co-polarized bands, robustly assess the performance and accuracy, and implement it across multiple land cover types at larger scales.
Acknowledgments
The author thanks Michael Humber, Louis Giglio and Joanne Hall (University of Maryland) for their thoughtful discussions related to burned area mapping, and Garik Gutman (NASA HQ), Chris Justice (University of Maryland), Krishna Vadrevu (NASA MSFC) and Varaprasad Bandaru (University of Maryland) for the support and mentorship. The author also thanks Michael Campbell, Rob Fischer, Jean Nelson and Andmorgan Fisher (Geospatial Research Lab) for the publication support and leadership.
Disclosure statement
No potential conflict of interest was reported by the authors.
Additional information
Funding
References
- Ahmed T, Singh D, Gupta S, Raman B. 2016. An efficient application of fusion approach for hot spot detection with MODIS and PALSAR-1 data. Geocarto Int. 31(7):715–738.
- Akagi SK, Yokelson RJ, Wiedinmyer C, Alvarado MJ, Reid JS, Karl T, Crounse JD, Wennberg PO. 2011. Emission factors for open and domestic biomass burning for use in atmospheric models. Atmos Chem Phys. 11(9):4039–4072.
- Alonso-Canas I, Chuvieco E. 2015. Global burned area mapping from ENVISAT-MERIS and MODIS active fire data. Remote Sens Environ. 163:140–152.
- Andreae MO, Merlet P. 2001. Emission of trace gases and aerosols from biomass burning. Global Biogeochem Cycle. 15(4):955–966.
- Atwood SA, Reid JS, Kreidenweis SM, Yu LE, Salinas SV, Chew BN, Balasubramanian R. 2013. Analysis of source regions for smoke events in Singapore for the 2009 El Nino burning season. Atmos Environ. 78:219–230.
- Badarinath KVS, Kharol SK, Sharma AR. 2009. Long-range transport of aerosols from agriculture crop residue burning in Indo-Gangetic Plains—a study using LIDAR, ground measurements and satellite data. J Atmos Solar-Terrestr Phys. 71(1):112–120.
- Belenguer-Plomer MA, Tanase MA, Fernandez-Carrillo A, Chuvieco E. 2018. Insights into burned areas detection from Sentinel-1 data and locally adaptive algorithms. Active and passive microwave remote sensing for environmental monitoring II. Vol. 10788. Berlin, Germany: International Society for Optics and Photonics; p. 107880G.
- Boschetti L, Roy D, Barbosa P, Boca R, Justice C. 2008. A MODIS assessment of the summer 2007 extent burned in Greece. Int J Remote Sens. 29(8):2433–2436.
- Boschetti L, Roy DP, Justice CO, Giglio L. 2010. Global assessment of the temporal reporting accuracy and precision of the MODIS burned area product. Int J Wildland Fire. 19(6):705–709.
- Bourgeau-Chavez LL, Kasischke ES, French NHF, Szeto LH, Kherkher CM. 1994. Using ERS-1 SAR imagery to monitor variations in burn severity in an Alaskan fire-disturbed boreal forest ecosystem. Proceedings of IGARSS'94-1994 IEEE International Geoscience and Remote Sensing Symposium; Aug 8-12, Vol. 1. Pasadena, CA: IEEE. p. 243–245.
- Bourgeau-Chavez LL, Kasischke ES, Brunzell S, Mudd JP, Tukman M. 2002. Mapping fire scars in global boreal forests using imaging radar data. Int J Remote Sens. 23(20):4211–4234.
- Chuvieco E, Mouillot F, van der Werf GR, San Miguel J, Tanase M, Koutsias N, García M, Yebra M, Padilla M, Gitas I, et al. 2019. Historical background and current developments for mapping burned area from satellite earth observation. Remote Sens Environ. 225:45–64.
- Cristofanelli P, Putero D, Adhikary B, Landi TC, Marinoni A, Duchi R, Calzolari F, Laj P, Stocchi P, Verza G, et al. 2014. Transport of short-lived climate forcers/pollutants (SLCF/P) to the Himalayas during the South Asian summer monsoon onset. Environ Res Lett. 9(8):084005.
- Crutzen PJ, Andreae MO. 1990. Biomass burning in the tropics: impact on atmospheric chemistry and biogeochemical cycles. Science. 250(4988):1669–1678.
- El Hajj M, Baghdadi N, Zribi M, Angelliaume S. 2016. Analysis of Sentinel-1 radiometric stability and quality for land surface applications. Remote Sens. 8(5):406.
- Engelbrecht J, Theron A, Vhengani L, Kemp J. 2017. A simple normalized difference approach to burnt area mapping using multi-polarisation C-Band SAR. Remote Sens. 9(8):764.
- Gaveau DL, Salim MA, Hergoualc'h K, Locatelli B, Sloan S, Wooster M, Marlier ME, Molidena E, Yaen H, DeFries R, et al. 2014. Major atmospheric emissions from peat fires in Southeast Asia during non-drought years: evidence from the 2013 Sumatran fires. Sci Rep. 4:6112.
- Gibe HP, Cayetano MG. 2017. Spatial estimation of air PM 2.5 emissions using activity data, local emission factors and land cover derived from satellite imagery. Atmos Meas Tech. 10(9):3313.
- Giglio L, Boschetti L, Roy DP, Humber ML, Justice CO. 2018. The collection 6 MODIS burned area mapping algorithm and product. Remote Sens Environ. 217:72–85.
- Giglio L, Descloitres J, Justice CO, Kaufman YJ. 2003. An enhanced contextual fire detection algorithm for MODIS. Remote Sens Environ. 87(2–3):273–282.
- Giglio L, Loboda T, Roy DP, Quayle B, Justice CO. 2009. An active-fire based burned area mapping algorithm for the MODIS sensor. Remote Sens Environ. 113(2):408–420.
- Giglio L, Randerson JT, Werf GR. 2013. Analysis of daily, monthly, and annual burned area using the fourth‐generation global fire emissions database (GFED4). J Geophys Res Biogeosci. 118(1):317–328.
- Giglio L, Schroeder W, Justice CO. 2016. The collection 6 MODIS active fire detection algorithm and fire products. Remote Sens Environ. 178:31–41.
- Gimeno M, San-Miguel-Ayanz J, Schmuck G. 2004. Identification of burnt areas in Mediterranean forest environments from ERS-2 SAR time series. Int J Remote Sens. 25(22):4873–4888.
- Goodenough DG, Chen H, Richardson A, Cloude S, Hong W, Li Y. 2012. Mapping fire scars using Radarsat-2 polarimetric SAR data. Can J Remote Sens. 37(5):500–509.
- Hall JV, Loboda TV, Giglio L, McCarty GW. 2016. A MODIS-based burned area assessment for Russian croplands: mapping requirements and challenges. Remote Sens Environ. 184:506–521.
- Hawbaker TJ, Vanderhoof MK, Beal Y-J, Takacs JD, Schmidt GL, Falgout JT, Williams B, Fairaux NM, Caldwell MK, Picotte JJ, et al. 2017. Mapping burned areas using dense time-series of Landsat data. Remote Sens Environ. 198:504–522.
- Hayasaka H, Noguchi I, Putra EI, Yulianti N, Vadrevu K. 2014. Peat-fire-related air pollution in Central Kalimantan, Indonesia. Environ Pollut. 195:257–266.
- Hayasaka H, Sepriando A. 2018. Severe air pollution due to peat fires during 2015 Super El Niño in Central Kalimantan, Indonesia. Land-atmospheric research applications in South and Southeast Asia. Cham (Switzerland): Springer; p. 129–142.
- Hoffmann WA, Schroeder W, Jackson RB. 2002. Positive feedbacks of fire, climate, and vegetation and the conversion of tropical savanna. Geophys Res Lett. 29(22):159-177.
- Huang H, Roy D, Boschetti L, Zhang H, Yan L, Kumar S, Gomez-Dans J, Li J. 2016. Separability analysis of sentinel-2A multi-spectral instrument (MSI) data for burned area discrimination. Remote Sens. 8(10):873.
- Humber ML, Boschetti L, Giglio L, Justice CO. 2018. Spatial and temporal intercomparison of four global burned area products. Int J Digital Earth. 12(4):1–25.
- Huuva I, Fransson JE, Persson HJ, Wallerman J, Ulander LM, Blomberg E, Soja MJ. 2017. Measurements of forest biomass change using L-and P-band sar backscatter. Geoscience and remote sensing symposium (IGARSS), 2017 IEEE International; Jul 23-28; Fort Worth,Texas, USA: IEEE; p. 5818–5821.
- Ikeda K, Tanimoto H. 2015. Exceedances of air quality standard level of PM2. 5 in Japan caused by Siberian wildfires. Environ Res Lett. 10(10):105001.
- Imperatore P, Azar R, Calo F, Stroppiana D, Brivio PA, Lanari R, Pepe A. 2017. Effect of the vegetation fire on backscattering: an investigation based on Sentinel-1 observations. IEEE J Sel Top Appl Earth Observ Remote Sens. 10(10):4478–4492.
- Inoue Y. 2018. Ecosystem carbon stock, atmosphere, and food security in slash-and-burn land use: a geospatial study in mountainous region of Laos. Land-atmospheric research applications in south and Southeast Asia. Cham (Switzerland): Springer; p. 641–665.
- Itahashi S, Uno I, Irie H, Kurokawa JI, Ohara T, 2018. Impacts of biomass burning emissions on tropospheric NO 2 vertical column density over continental Southeast Asia. In Land-atmospheric research applications in South and Southeast Asia. Cham: Springer; p. 67–81.
- Jenkins LK, Bourgeau-Chavez LL, French NH, Loboda TV, Thelen BJ. 2014. Development of methods for detection and monitoring of fire disturbance in the Alaskan tundra using a two-decade long record of synthetic aperture radar satellite images. Remote Sens. 6(7):6347–6364.
- Justice C., Giglio L, Korontzi S, Owens J, Morisette JT, Roy D, Descloitres J, Alleaume S, Petitcolin F, Kaufman Y. 2002. The MODIS fire products. Remote Sens Environ. 83(1-2):244–262.
- Kalogirou V, Ferrazzoli P, Della Vecchia A, Foumelis M. 2014. On the SAR backscatter of burned forests: a model-based study in C-band, over burned pine canopies. IEEE Trans Geosci Remote Sens. 52(10):6205–6215.
- Kanabkaew T, Oanh NTK. 2011. Development of spatial and temporal emission inventory for crop residue field burning. Environ Model Assess. 16(5):453–464.
- Karambelas A, Holloway T, Kiesewetter G, Heyes C, 2018. Constraining the uncertainty in emissions over India with a regional air quality model evaluation. Atmos Environ. 174:194–203.
- Karila K, Nevalainen O, Krooks A, Karjalainen M, Kaasalainen S. 2014. Monitoring changes in rice cultivated area from SAR and optical satellite images in Ben Tre and Tra Vinh Provinces in Mekong Delta, Vietnam. Remote Sens. 6(5):4090–4108.
- Kasischke ES, Bourgeau-Chavez LL, French NH. 1994. Observations of variations in ERS-1 SAR image intensity associated with forest fires in Alaska. IEEE Trans Geosci Remote Sens. 32(1):206–210.
- Koplitz SN, Nolte CG, Pouliot GA, Vukovich JM, Beidler J. 2018. Influence of uncertainties in burned area estimates on modeled wildland fire PM2. 5 and ozone pollution in the contiguous US. Atmos Environ. 191:328–339.
- Kukavskaya EA, Soja AJ, Petkov AP, Ponomarev EI, Ivanova GA, Conard SG. 2013. Fire emissions estimates in Siberia: evaluation of uncertainties in area burned, land cover, and fuel consumption. Can J for Res. 43(5):493–506.
- Kurum M. 2015. C-band SAR backscatter evaluation of 2008 Gallipoli forest fire. IEEE Geosci Remote Sens Lett. 12(5):1091–1095.
- Kusumaningtyas SDA, Aldrian E. 2016. Impact of the June 2013 Riau province Sumatera smoke haze event on regional air pollution. Environ Res Lett. 11(7):075007.
- Lasko K, Vadrevu K. 2018. Improved rice residue burning emissions estimates: accounting for practice-specific emission factors in air pollution assessments of Vietnam. Environ Pollut. 236:795–806.
- Lasko K, Vadrevu KP, Nguyen TTN. 2018. Analysis of air pollution over Hanoi, Vietnam using multi-satellite and MERRA reanalysis datasets. PLoS One. 13(5):e0196629.
- Lasko K, Vadrevu KP, Tran VT, Ellicott E, Nguyen TT, Bui HQ, Justice C. 2017. Satellites may underestimate rice residue and associated burning emissions in Vietnam. Environ Res Lett. 12(8):085006.
- Lentile LB, Holden ZA, Smith AM, Falkowski MJ, Hudak AT, Morgan P, Lewis SA, Gessler PE, Benson NC. 2006. Remote sensing techniques to assess active fire characteristics and post-fire effects. Int J Wildland Fire. 15(3):319–345.
- Li P, Feng Z, Xiao C. 2018. Acquisition probability differences in cloud coverage of the available Landsat observations over mainland Southeast Asia from 1986 to 2015. Int J Digital Earth. 11(5):437–450.
- Lievens H, Reichle RH, Liu Q, De Lannoy GJM, Dunbar RS, Kim SB, Das NN, Cosh M, Walker JP, Wagner W. 2017. Joint Sentinel‐1 and SMAP data assimilation to improve soil moisture estimates. Geophys Res Lett. 189:194-210
- Liew SC, Kwoh LK, Padmanabhan K, Lim OK, Lim H. 1999. Delineating land/forest fire burnt scars with ERS interferometric synthetic aperture radar. Geophys Res Lett. 26(16):2409–2412.
- Liu T, Marlier ME, Karambelas A, Jain M, Singh S, Singh MK, Gautam R, DeFries RS. 2019. Missing emissions from post-monsoon agricultural fires in northwestern India: regional limitations of MODIS burned area and active fire products. Environ Res Commun. 1(1):011007.
- Lohberger S, Stängel M, Atwood EC, Siegert F. 2018. Spatial evaluation of Indonesia's 2015 fire‐affected area and estimated carbon emissions using Sentinel‐1. Glob Change Biol. 24(2):644–654.
- Marlier ME, DeFries RS, Voulgarakis A, Kinney PL, Randerson JT, Shindell DT, Chen Y, Faluvegi G. 2013. El Niño and health risks from landscape fire emissions in Southeast Asia. Nat Clim Change. 3(2):131.
- Mathieu R, Main R, Roy D, Naidoo L, Yang H. 2018. Detection of burned areas in Southern African Savannahs using time series of C-band sentinel-1 data. IGARSS 2018-2018 IEEE International Geoscience and Remote Sensing Symposium; Jul 22-27; Valencia, Spain: IEEE. p. 5337–5339.
- Melchiorre A, Boschetti L. 2018. Global analysis of burned area persistence time with MODIS data. Remote Sens. 10(5):750.
- Menges CH, Bartolo RE, Bell D, Hill GE. 2004. The effect of savanna fires on SAR backscatter in northern Australia. Int J Remote Sens. 25(22):4857–4871.
- Nguyen BT, Do KP, L, Tran N, Bui QH, Nguyen TNT, Vuong VQ, Le TH. 2018. Enhancement of fire early warning system in Vietnam using spatial data and assimilation. Land-atmospheric research applications in south and Southeast Asia. Cham (Switzerland): Springer; p. 203–222.
- Oanh NTK, Permadi DA, Dong NP, Nguyet DA. 2018. Emission of toxic air pollutants and greenhouse gases from crop residue open burning in Southeast Asia. Land-atmospheric research applications in South and Southeast Asia. Cham (Switzerland): Springer; p. 47–66.
- Ohara TAHK, Akimoto H, Kurokawa JI, Horii N, Yamaji K, Yan X, Hayasaka T. 2007. An Asian emission inventory of anthropogenic emission sources for the period 1980–2020. Atmos Chem Phys. 7(16):4419–4444.
- Oliva P, Schroeder W. 2015. Assessment of VIIRS 375 m active fire detection product for direct burned area mapping. Remote Sens Environ. 160:144–155.
- Padilla M, Stehman SV, Chuvieco E. 2014. Validation of the 2008 MODIS-MCD45 global burned area product using stratified random sampling. Remote Sens Environ. 144:187–196.
- Palandjian D, Gitas IZ, Wright R. 2009. Burned area mapping and post-fire impact assessment in the Kassandra peninsula (Greece) using Landsat TM and Quickbird data. Geocarto Int. 24(3):193–205.
- Palmann C, Mavromatis S, Hernández M, Sequeira J, Brisco B. 2008. Earth observation using radar data: an overview of applications and challenges. Int J Digital Earth. 1(2):171–195.
- Peve A, Stroppiana D, Calo F, Imperatore P, Boschetti L, Bignami C, Brivio PA, Lanari R. 2018. Exploitation of Copernicus sentinels data for sensing fire-disturbed vegetated areas. IGARSS 2018-2018 IEEE International Geoscience and Remote Sensing Symposium; Jul 22-27; Valencia,Spain: IEEE. p. 7589–7592.
- Polychronaki A, Gitas I, Veraverbeke S, Debien A. 2013. Evaluation of ALOS PALSAR imagery for burned area mapping in Greece using object-based classification. Remote Sens. 5(11):5680–5701.
- Prasad VK, Badarinath KVS, Gupta PK. 2002. Biomass burning emission inventory from remote sensing, GIS and ground based measurements ‐ a case study from secondary mixed deciduous forests, India. Geocarto Int. 17(2):13–20.
- Ramanathan V, Carmichael G. 2008. Global and regional climate changes due to black carbon. Nat Geosci. 1(4):221.
- Randerson JT, Chen Y, Werf GR, Rogers BM, Morton DC. 2012. Global burned area and biomass burning emissions from small fires. J Geophys Res: Biogeosci. 117(G4):1-23.
- Reiche J, Hamunyela E, Verbesselt J, Hoekman D, Herold M. 2018. Improving near-real time deforestation monitoring in tropical dry forests by combining dense Sentinel-1 time series with Landsat and ALOS-2 PALSAR-2. Remote Sens Environ. 204:147–161.
- Reid JS, Hyer EJ, Johnson RS, Holben BN, Yokelson RJ, Zhang J, Campbell JR, Christopher SA, Di Girolamo L, Giglio L, et al. 2013. Observing and understanding the Southeast Asian aerosol system by remote sensing: an initial review and analysis for the seven Southeast Asian studies (7SEAS) program. Atmos Res. 122:403–468.
- Roberts SJ. 2000. Tropical fire ecology. Progr Phys Geogr. 24(2):281–288.
- Roy DP. 1999. Multi-temporal active-fire based burn scar detection algorithm. Int J Remote Sen. 20(5):1031–1038.
- Roy DP, Boschetti L. 2009. Southern Africa validation of the MODIS, L3JRC, and GlobCarbon burned-area products. IEEE Trans Geosci Remote Sens. 47(4):1032–1044.
- Roy DP, Boschetti L, Justice CO, Ju J. 2008. The collection 5 MODIS burned area product—global evaluation by comparison with the MODIS active fire product. Remote Sens Environ. 112(9):3690–3707.
- Saha S. 2002. Anthropogenic fire regime in a deciduous forest of central India. Curr Sci. 82(9):1144–1147.
- Saikawa E, Trail M, Zhong M, Wu Q, Young CL, Janssens-Maenhout G, Klimont Z, Wagner F, Kurokawa JI, Nagpure AS, Gurjar BR. 2017. Uncertainties in emissions estimates of greenhouse gases and air pollutants in India and their impacts on regional air quality. Environ Res Lett. 12(6):065002.
- San-Miguel-Ayanz J, Pereira JM, Boca R, Strobl P, Kucera J, Pekkarinen A. 2009. Forest fires in the European Mediterranean region: mapping and analysis of burned areas. Earth observation of wildland fires in Mediterranean ecosystems. Berlin: Springer; p. 189–203.
- Schroeder W, Csiszar I, Morisette J. 2008. Quantifying the impact of cloud obscuration on remote sensing of active fires in the Brazilian Amazon. Remote Sens Environ. 112(2):456–470.
- Shi Y, Matsunaga T. 2017. Temporal comparison of global inventories of CO2 emissions from biomass burning during 2002–2011 derived from remotely sensed data. Environ Sci Pollut Res. 24(20):16905–16916.
- Siegert F, Hoffmann AA. 2000. The 1998 forest fires in East Kalimantan (Indonesia): a quantitative evaluation using high resolution, multitemporal ERS-2 SAR images and NOAA-AVHRR hotspot data. Remote Sens Environ. 72(1):7264–7277.
- Singh G, Kant Y, Dadhwal VK. 2009. Remote sensing of crop residue burning in Punjab (India): a study on burned area estimation using multi-sensor approach. Geocarto Int. 24(4):273–292.
- Small D, Miranda N, Meier E. 2009. A revised radiometric normalisation standard for SAR. Geoscience and Remote Sensing Symposium, 2009 IEEE International, IGARSS 2009; Jul 12-17; Vol. 4. Capetown, South Africa: IEEE. p. IV–566.
- Sonkaew T, Macatangay R. 2015. Determining relationships and mechanisms between tropospheric ozone column concentrations and tropical biomass burning in Thailand and its surrounding regions. Environ Res Lett. 10(6):065009.
- Streets DG, Bond TC, Carmichael GR, Fernandes SD, Fu Q, He D, Klimont Z, Nelson SM, Tsai NY, Wang MQ, et al. 2003. An inventory of gaseous and primary aerosol emissions in Asia in the year 2000. J Geophys Res: Atmos. 108(D21).
- Stroppiana D, Azar R, Calò F, Pepe A, Imperatore P, Boschetti M, Silva J, Brivio PA, Lanari R. 2015a. Integration of optical and SAR data for burned area mapping in Mediterranean Regions. Remote Sensi. 7(2):1320–1345.
- Stroppiana D, Azar R, Calò F, Pepe A, Imperatore P, Boschetti M, Silva JM, Brivio PA, Lanari R. 2015b. Remote sensing of burned area: a fuzzy-based framework for joint processing of optical and microwave data. 2015 IEEE International Geoscience and Remote Sensing Symposium (IGARSS); July 26-31. Milan, Italy: IEEE. p. 1409–1412.
- Tanase M, de la Riva J, Santoro M, Pérez-Cabello F, Kasischke E. 2011. Sensitivity of SAR data to post-fire forest regrowth in Mediterranean and boreal forests. Remote Sens Environ. 115(8):2075–2085.
- Tanase MA, Santoro M, de la Riva J, Prez-Cabello F, Le Toan T. 2010. Sensitivity of X-, C-, and L-band SAR backscatter to burn severity in Mediterranean pine forests. IEEE Trans Geosci Remote Sens. 48(10):3663–3675.
- Tansey K, Grégoire JM, Defourny P, Leigh R, Pekel JF, Van Bogaert E, Bartholomé E. 2008. A new, global, multi‐annual (2000–2007) burnt area product at 1 km resolution. Geophys Res Letter. 35(1):1-8.
- Torbick N, Salas W, Chowdhury D, Ingraham P, Trinh M. 2017. Mapping rice greenhouse gas emissions in the Red River Delta, Vietnam. Carbon Manage. 8(1):99–108.
- Urbanski S, Nordgren B, Albury C, Schwert B, Peterson D, Quayle B, Hao WM. 2018. A VIIRS direct broadcast algorithm for rapid response mapping of wildfire burned area in the western United States. Remote Sens Environ. 219:271–283.
- Vadrevu KP, Ellicott E, Giglio L, Badarinath KVS, Vermote E, Justice C, Lau WK. 2012. Vegetation fires in the himalayan region–aerosol load, black carbon emissions and smoke plume heights. Atmos Environ. 47:241–251.
- Vadrevu KP, Justice CO. 2011. Vegetation fires in the Asian region: satellite observational needs and priorities. Global Environ Res. 15(1):65–76.
- Vadrevu KP, Lasko K, Giglio L, Justice C. 2015. Vegetation fires, absorbing aerosols and smoke plume characteristics in diverse biomass burning regions of Asia. Environ Res Lett. 10(10):105003.
- Vadrevu KP, Lasko K, Justice C. 2014. Spatial variations in vegetation fires and carbon monoxide concentrations in south Asia. Remote sensing applications in environmental research. Cham (Switzerland): Springer; p. 131–149.
- Vadrevu K, Ohara T, Justice C. 2017. Land cover, land use changes and air pollution in Asia: a synthesis. Environ Res Lett. 12(12):120201.
- van der Werf GR, Randerson JT, Giglio L, Collatz GJ, Kasibhatla PS, Arellano AF Jr. 2006. Interannual variability in global biomass burning emissions from 1997 to 2004. Atmos Chem Phys. 6(11):3423–3441.
- van der Werf GR, Randerson JT, Giglio L, van Leeuwen TT, Chen Y, Rogers BM, Mu M, van Marle MJE, Morton DC, Collatz GJ, et al. 2017. Global fire emissions estimates during 1997–2016. Earth Syst Sci Data. 9(2):697.
- Verhegghen A, Eva H, Ceccherini G, Achard F, Gond V, Gourlet-Fleury S, Cerutti P. 2016. The potential of Sentinel satellites for burnt area mapping and monitoring in the Congo Basin forests. Remote Sens. 8(12):986.
- Vogl RJ. 1974. Effects of fire on grasslands. In: Kozlowski TT, Ahlgren CE, editors. Fire and ecosystems.
- Whelen T, Siqueira P. 2018. Time-series classification of Sentinel-1 agricultural data over North Dakota. Remote Sens Lett. 9(5):411–420.
- Whitcraft AK, Vermote EF, Becker-Reshef I, Justice CO. 2015. Cloud cover throughout the agricultural growing season: impacts on passive optical earth observations. Remote Sens Environ. 156:438–447.
- Wilson AM, Jetz W. 2016. Remotely sensed high-resolution global cloud dynamics for predicting ecosystem and biodiversity distributions. PLoS Biol. 14(3):e1002415.
- Yan X, Ohara T, Akimoto H. 2006. Bottom-up estimate of biomass burning in mainland China. Atmos Environ. 40(27):5262–5273.
- Zhang L, Liu Y, Hao L. 2016. Contributions of open crop straw burning emissions to PM2.5 concentrations in China. Environ Res Lett. 11(1):014014.
- Zhang T, Wooster M, de Jong M, Xu W. 2018. How well does the ‘small fire boost’ methodology used within the GFED4. Is fire emissions database represent the timing, location and magnitude of agricultural burning? Remote Sens. 10(6):823.
- Zuhlke M, Fomferra N, Brockmann C, Peters M, Veci L, Malik J, Regner P. 2015. SNAP (Sentinel application platform) and the ESA Sentinel 3 toolbox. Sentinel-3 for Science Workshop; Dec; Vol. 734; June 2-5; Venice, Italy; p. 21.
- Zúñiga-Vásquez JM, Cisneros-González D, Pompa-García M. 2017. Drought regulates the burned forest areas in Mexico: the case of 2011, a record year. Geocarto Int. 1–14.