
 ?Mathematical formulae have been encoded as MathML and are displayed in this HTML version using MathJax in order to improve their display. Uncheck the box to turn MathJax off. This feature requires Javascript. Click on a formula to zoom.
Abstract
Forests and wetlands played a crucial role in minimizing the increasing trends of land surface temperature (LST). This study aimed to analyze the contribution of forests and wetlands on LST in Yayo district using multi-spectral and multi-temporal satellite. Landsat images of 1986, 2003 and 2021 were downloaded from United State Geological Survey website with 30 m spatial resolution. Results show that the mean LST was increased from 22.8 °C in 1986 to 27 °C in 2003 over cultivated land. As the results of forest conservation and wetland protection, the LST in Yayo district is experencing a declining trend in the recent year. Result reveal that the normalized difference vegetation index and Normalized Difference Water Index show a strong negative relationship with LST. Over the last two decades, the LST was declined by 1.5 °C due to the protection of forest and wetland ecosystem. Thus, governmental and non-governmental organization should encourage the conservation and protection of forest and wetland ecosystems.
Introduction
The role of forests and wetland in adapting climate change is very high. Studies clearly documented the role of forest and wetland ecosystems in climate change mitigation and biodiversity conservation worldwide (Erwin Citation2009; Junk et al. Citation2013; Seddon et al. Citation2020; Huang et al. Citation2021; Yan et al. Citation2022). Both forest and wetland have huge potential in carbon sequestration, balancing ecosystem, restoring ground water, purifying toxins, stabilize microclimates and minimize the potential occurrence of climate extremes such as drought and floods (Gebre and Gebremedhin Citation2019; He et al. Citation2021; Kattel Citation2022; Zhou et al. Citation2022). However, deforestation and forest degradation were the main cause for climate change (Van Khuc et al. Citation2018; Moisa, Dejene and Gemeda Citation2022; Yang et al. Citation2023). Previous studies confirmed that there is an inverse relationship between land surface temperature (LST) and forest and wetland ecosystems (Singh et al. Citation2017; Muro et al. Citation2018; Kayumba et al. Citation2021; Li, Wang, et al. Citation2022; Pei et al. Citation2023). To understand the role of vegetation cover and wetland ecosystem Merga et al. (Citation2022) analyzed the relationship between normalized difference vegetation index (NDVI), and normalized difference water index (NDWI) with LST and confirm a negative correlation in Didessa River sub-basin of Western Ethiopia. In addition, assessment of land use land cover (LULC) impact on LST is very decisive for monitoring spatial distribution of surface temperature (Moisa, Dejene, Hinkosa, et al. Citation2022; Moisa et al. Citation2022b).
Several studies have been conducted on the impacts of LULC change on LST in different parts of Ethiopia (Moisa, Dejene and Gemeda Citation2022; Moisa, Dejene, Hinkosa, et al. 2022). According to Tafesse and Suryabhagavan (Citation2019), LST in Adama has been increased due to uncontrolled LULC changes which accelerate loss of vegetation covers. Balew and Korme (Citation2020), recognize that LULC change brought higher accumulation of LST in and around Bahir Dar city. Merga et al. (Citation2022) also reported that over expansion of agriculture and illegal settlement causes dramatically decline of vegetation which increase LST in Didessa River Sub-basin in Western Ethiopia. Although substantial studies have been conducted in different parts of the country, no studies reported the role of safeguarding forests and wetlands in mitigating LST, they were dealing with LULC changes, attitudes on some economical plants like coffee Arabica and woody plants (Moat et al. Citation2017; Getahun and Keno Citation2019; Oostdijk Citation2021). Forest conservation is one of the key techniques to minimize the increasing trends of LST. The southwestern part of Ethiopia is relatively better in terms of forest cover as compared to other parts of Ethiopia. Study by Tadese et al. (Citation2021) reported that four biosphere reserves, including Yayo, Majang, Sheka, and Kafa were established between 2010 and 2017 in southwestern part of Ethiopia. Forest and wetland have been a crucial role in minimizing LST, but little research attention has been given until to date in the study area. Geospatial technology was used to analyze the relationship betwwn forest, wetland and LST to offer evidence based information for decision makers and natural resource manager for sustainable use of forest and wetland to mitigate climate change. Therefore, the present study aimed to fill the existing research gap by analyzing the correlation between forest and wetland with LST using geospatial technology in Yayo district, southwestern Ethiopia.
Materials and methods
Description of the study area
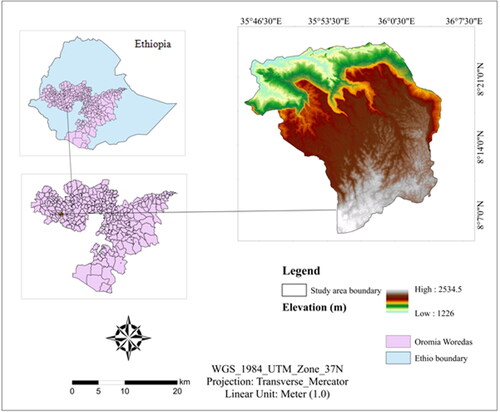
This study was conducted in Yayo district which located in the Ilu Ababor Zone, of Oromia National Regional State, SW Ethiopia (). Geographically, the Yayo district lies between 807′00″ and 8021′00″ N and 35046′30″ and 3607″E and the topography of the study area varies between 1,226 and 2,534.5 above sea level. It covers an area of 807.7 km2. The mean annual temperature is about 23.74°C, and the district is known by its rainy condition with precipitation of about 1,625 mm/year (Tadese et al. Citation2021). Yayo is located within the Eastern Afromontane Biodiversity Hotspot, and montane rainforest fragments with wild Coffee arabica. Three management zones namely; core, buffer and transition zones were established next to its designation as a United Nations Educational, Scientific and Cultural Organization (UNESCO) biosphere reserve. Yayo Biosphere Reserve has a surface are of 167,021 ha, of which 27,733 ha core area, 21,552 ha buffer zone, and 117,736 ha transition zone. The core zone is free from human intervention and is fully protected; the buffer zone is an important ecological corridors, connecting the core zone to the transitional zones, while the transition zone is free for wise use of natural resources (Tadese et al. Citation2021). The transitional zone is found adjacent to the buffer zone and includes agricultural lands, wetlands, grasslands, settlements, and forest fragments. These collectively made a conducive battle for conservation of the forest in present study area (Abera et al. Citation2021).
Figure 1. Location map of the study area.
Data sources and descriptions
Landsat images of Thematic Mapper (TM) in 1986, Enhanced Thematic Mapper Plus (ETM+) of 2003 and Operational Land Imager (OLI) of 2021 were downloaded from United States Geological Survey (USGS) website (http://eathexplorer.usgs.gov/) with 30 m spatial resolution by using path 170 and row 54 which are cloud free images during the dry season (January and February) (). Earth Resources Data Analysis System (ERDAS) Imagine 2015 software was used for LULC classification. ArcGIS 10.3 was performed for analyzing and visualizing spatial data. Landsat images of 1986, 2003 and 2021 were used in the present study due to free from strip and cloud cover. From the downloaded Landsat images, multispectral bands were used for classification of LULC and calculation of NDVI and NDWI from 1986 to 2021 in the Yayo district.
Table 1. Data sources and its descriptions.
Methods of data analysis
Analysis of LULC classes
The LULC in Yayo district was classified from Landsat images of TM of 1986, ETM + of 2003 and OLI/TIRS of 2021. The LULC of the study area were classified into five classes: i.e. bare land, cultivated land, forest land, grassland and wetland by using supervised classification method with maximum likelihood algorithm.
Accuracy assessment
For accuracy assessment of LULC classes, 100 ground control points were collected using GPS, while Google Earth was used inaccessible areas in the study area. All LULC classes on the map were validated with reality on the ground using the collected ground points. 100 ground control points collected by randomly sampled 20 ground control points for forest land, cultivated land, bare land, grassland and wetland. The overall accuracy was calculated by dividing all the pixels properly classified by total number of pixels in the matrix EquationEquation (1)(1)
(1) . The user accuracy is calculated by multiplying the total number of correctly classified pixels in a class by the sum of the values in the rows of the same class EquationEquation (2)
(2)
(2) . The producer accuracy index is calculated by dividing the total of the values in the same class’s column by the number of correctly identified pixels in that class as shown in EquationEquation (3)
(3)
(3) .
(1)
(1)
where N is total number of accuracy sites,
is sum of diagonal values.
(2)
(2)
where
is total number of corrected pixels and
is column total.
(3)
(3)
where Xii is the total number of corrected pixels and Xk is row total.
Land use land cover change detection
Rate of LULC change
The extent of forest cover change was calculated following recent studies (Moisa and Gemeda Citation2021; Moisa, Dejene, Hinkosa, et al. 2022) by using EquationEquation (4)(4)
(4) .
(4)
(4)
where, X2 is an area of LULC in square kilometer in time 2, X1 is an area of LULC in square kilometer in time 1; Z is time interval between X2 and X1 in years.
Trends of land use land cover change
Trends of LULC used to show negative numbers in the trend indicate a decrease (losses), whereas positive values indicate an increase (gain) in that LULC as indicated EquationEquation (5(5)
(5) ) (Moisa and Gemeda Citation2021; Wang, Wang, et al. Citation2022).
(5)
(5)
where: Y2 is the current year, Y1 is the previous year
Normalized difference vegetation index estimation
The NDVI used to calculate the quantity of above ground green vegetation cover (Moisa, Dejene and Gemeda Citation2022; Moisa, Dejene, Hinkosa, et al. 2022) as indicated in EquationEquation (6)(6)
(6) .
(6)
(6)
where NDVI is Normalized Difference Vegetation Index,
NIR is the near infrared band and R is the red band
Landsat 8 data used Bands 5 (Infrared) and 4 (red), whereas Landsat 5 and 7 used Bands 4 and 3, to calculate the NDVI values.
Normalized difference water index (NDWI)
The NDWI is used to simulate water areas, which often have significant thermal changes (Zhou and Wang Citation2011; Siqi and Yuhong Citation2020). Green band (band 2 for Landsat 5 and 7, band 3 for Landsat 8) and near infrared (band 4 for Landsat 5 and 7, band 5 for Landsat 8) reflectance measurements were used to build the formula EquationEquation (7)(7)
(7) . The Near-Infrared (NIR) and Green (G) channels are used to calculate the NDWI (Jackson et al. Citation2004; Wang, Liu, et al. Citation2022; Fang et al. Citation2023).
(7)
(7)
Retrieval of land surface temperature
The thermal band of Landsat TM 1986, Landsat ETM+ 2003, and Landsat OLI/TIRS 2021 were used to determine the LST in the study area (Kumari et al. Citation2018; Zhang et al. Citation2021; Wolteji et al. Citation2022). Thermal bands are band 6 for Landsat 5 TM 1986 and Landsat ETM+ 2003, and band 10 for Landsat OLI/TIRS 2021. The Mono-window approach was used to calculate LST (Chibuike et al. Citation2018; Li, Charles, et al. Citation2022).
Step 1: Conversion of digital number (DN) into radiance
The digital numbers of TM and ETM + were converted to radiance using EquationEquation (8)(8)
(8) (Chander et al. Citation2009). ETM + has a digital number between 0 and 255.
(8)
(8)
where;
QCAL is the quantized calibrated pixel value in DN
LMINλ is the spectral radiance that is scaled to QCALMIN in Watts/(meter squared*ster*µm
MAXλ is the spectral radiance that is scaled to QCALMAX in Watts/(meter squared*ster*µm
QCALMIN is the minimum quantized calibrated pixel value (corresponding to LMINλ) in DN
QCALMAX is the maximum quantized calibrated pixel value (corresponding to LMAXλ) in DN = 255
The digital number of band 10 from Landsat 8 TIRS was converted into radiance values using EquationEquation (9)(9)
(9) .
(9)
(9)
where;
Lλ is the Top of Atmosphere (TOA) spectral radiance Watts/(meter squared*ster*µm)
ML is Band specific multiplicative rescaling factor from the meta data (Radiance multi band x)
AL is Band specific additive rescaling factor from the meta data (Radiance Add Band x, where x is the band number)
Qcal is quantized and calibrated standard product pixel values of DN
Step 2: Conversion to brightness temperature
LST was calculated using brightness temperature based on land surface emissivity (Yang et al. Citation2017; Xu et al. Citation2022). TM and ETM + values from band 6 were transformed from spectral radiance to brightness temperature (Yue et al. Citation2007) EquationEquation (10)(10)
(10) .
(10)
(10)
where; TB is effective at satellite temperature in Kelvin, K2 is Calibration constant 2.
K1 is Calibration constant 1, Lλ is Spectral radiance in Wm2 ster-1 µm-1
Step 3: Estimation of land surface emissivity using NDVI
The NDVI has been used to calculate the abundance of vegetation cover on the earth’s surface (Elmore et al. Citation2000; Li et al. Citation2021; Moisa, Tiye, et al. Citation2022). The NDVI value was derived using multispectral bands from Landsat images taken in 1986, 2003 and 2021. Bands 4 and 3 of Landsat 5 and 7 were utilized to measure near infrared (NIR) and red, respectively. Furthermore, in Landsat 8, bands 5 and 4 were employed to assess NIR and red, respectively.
A proportional vegetation ( calculation was done based on the NDVI measurements to calculate land surface emissivity (Neinavaz et al. Citation2020; Zhang et al. Citation2021). The vegetation proportion was calculated (Carlson and Ripley, Citation1997) using EquationEquation 11
(11)
(11) .
(11)
(11)
where; PV is proportion vegetation, NDVI is Normalized difference vegetation index,
NDVImin is minimum value of NDVI, NDVImax is maximum value of NDVI
An estimation of LST was performed (Chibuike et al. Citation2018; Liu et al. Citation2022) and calculated using EquationEquation (12)(12)
(12) .
(12)
(12)
Where;
The calculated land surface temperature was corrected for emissivity (Srivastava et al. Citation2010; Zhu et al. Citation2023) using EquationEquation (13)(13)
(13) .
(13)
(13)
where;
LST is land surface temperature (in Kelvin), TB is radiant surface temperature (in Kelvin)
To calculate LST in degree Celsius, 273.15 should be subtracted from LST in kelvin (EquationEquation (14)(14)
(14) ).
(14)
(14)
Pearson correlation coefficient
Pearson correlation coefficient (Pearson’s r) is the most widely used correlation coefficient and measures of the statistical relationship between two quantitative variables (Liu et al. Citation2022; Šverko et al. Citation2022; Zhou et al. Citation2022; Burgund et al. Citation2023). Pearson’s r values range from −1 to +1. The Pearson’s r between 0 and 3 is weak, between 3 and 5 is moderate and greater than 5 is strong. A negative Pearson’s r value indicates a negative relationship, and a positive value indicates a positive relationship between the two variables.
Results and discussions
Accuracy assessment
The accuracy of the classified LULC maps was assessed to ensure their trustworthiness. The reference data was compared to the classified LULC types. The overall accuracy results of LULC classification are 86.8, 83.4 and 85.7% for the year 1986, 2003, and 2021. As a result, for the study periods 1991, 2003, and 2021, the kappa coefficients were 0.85, 0.82, and 0.83, respectively. In addition, the result of user accuracy and producer accuracy of 1986, 2003 and 2021 were stated in ().
Table 2. Accuracy assessment of LULC for 1986, 2003 and 2021.
Analysis of LULC change
As agricultural communities, there are rapid conversions of LULC for different economic activities. As compared to other region, the southwestern parts of Ethiopia are covered by dense and open forest. For instance, Yayo is one of the few remaining area of intact Afromontane forests in southwestern part of Ethiopia. As the demand for agricultural expansion caused by rapid population growth, the forest in this particular area is under threats. To minimize the threat of forest, UNESCO gives high attention for this particular area and established the Yayo Biosphere Reserve in 2010. Southern part and northern parts of the study area was conserved in 2021 than 2003. As the result, wetland area and forest land were increased in final year of the study period. To examining the extent of change over different land cover classes, we classified into cultivated land, bare land, forest land, grass land and water body in all study period (). The results revealed that the share of cultivated land in 1986 was highest, which covers about 165 km2. In contrst, cultivated land was declined due to forest conservation and protection. Similarly, bare land decreased from 30.4 to 1.3 km2. Moreover, forest cover shows substantial increment from 319.4 km2 in 1986 to 488.6 km2 in 2021 (). The increment of forest cover and wetlands is associated with the establishment of Yayo biosphere reserve (Tadese et al. Citation2021). The result of this study was consistence’s with the previous studies (Liu et al. Citation2020; Negash et al. Citation2021; Moisa, Dejene and Gemeda Citation2022; Moisa et al. Citation2022a).
Figure 2. LULC map of the study area.
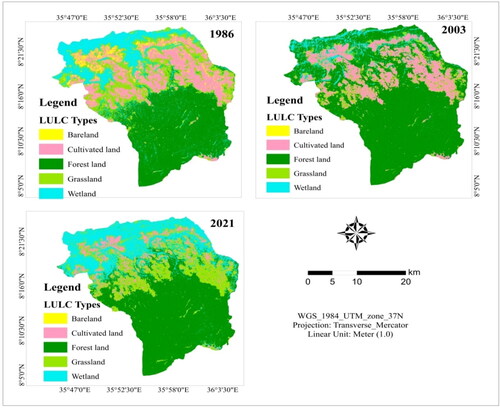
Table 3. Calculated LULC of the study area.
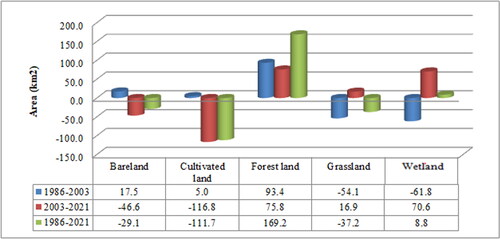
The results indicate that, forest land; grassland and wetland land cover classes experienced a positive trend with an increment by 169.2, 8.8 km2 between 1986 and 2021. This increment implies the existence of management practices for restoration and rehabilitation of degraded natural forests, grassland and wetland ecosystem. In contrast, cultivated land, grassland, and bare experienced a negative trend by an area of 111.7, 37.2, and 29.1 km2, respectively. The declining of cultivated land, grassland and bare land indicates the presence conservation actions in the study area (). Similar findings have been reported in southwestern parts of Ethiopia as the results of conservation measures (Tadese et al. Citation2021; Moisa, Dejene, Hinkosa, et al. 2022).
Figure 3. LULC trends.
Results show that cultivated land and bare land were decreased by the rate of 3.3 km2/year and 0.9 km2/year from 1986 to 2021, respectively. However, forest land, wetland and grassland were increased by the rate of 2.1, 1.7 and 0.3 km2/year over the study period, respectively (). The rate by which the cultivated land and bare land decreased due to the recovery of forest land, grassland and wetland in the study area. This decreasing rate of cultivated land doesn’t mean the total collapses of cultivation activities rather than applying improved and sustainable agricultural practices on a right place at time. Local community is planting trees on their land in the form of agro forestry for different purposes. These findings are consistent with previous study (Moisa and Gemeda Citation2021). Tadese et al. (Citation2021) also reported the increasing trend of forest cover as the results of Reducing Emissions from Deforestation and Forest Degradation (REDD+) since 2010 in similar geographical region.
Table 4. Rate of LULC types.
Post classification and Land Use Transfer Matrix (LUTM) methods were used for LULC change detection. The results revealed that about 9.7 km2 of cultivated land and 0.4 km2 of bare land converted to forest land between 1986 and 2021. Similarly, about 46 km2 of grass land area also shifted to forest land. However, about 489.5 km2 (60.6%) of the study area was remained unchanged (; ). These findings are consistency with previous studies (Moisa and Gemeda Citation2021; Moisa et al. Citation2022b).
Figure 4. LULC matrix of the study area.
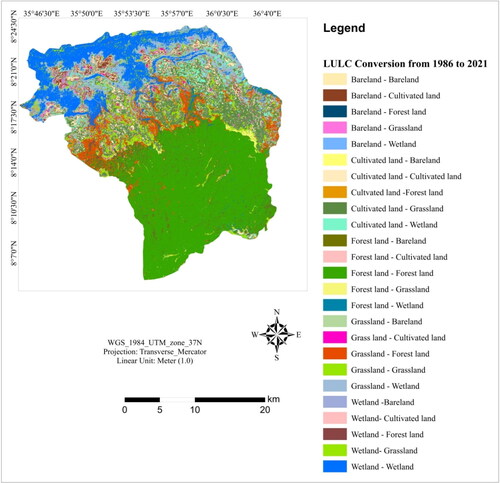
Table 5. LULC matrix from 1986 to 2021.
Spatiotemporal distributions of NDVI and NDWI
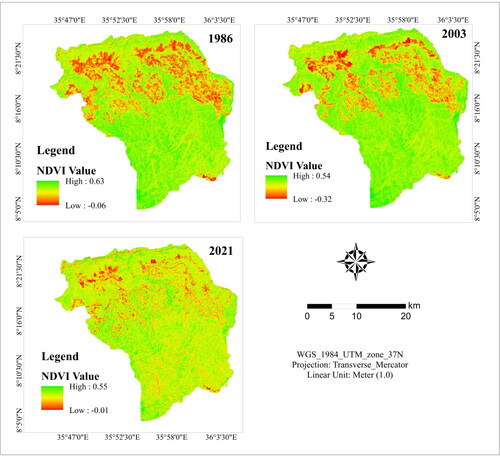
The NDVI was used to evaluate the status of forest cover in the study area. The maximum value of the NDVI implies higher vegetation and vice versa. The result revealed that maximum NDVI values declined from 0.63 in 1986 to 0.54 in 2003 as conservation actions do not get attention by governments until the establishment of Yayo biosphere reserve. Declining of NDVI values are associated with agricultural expansion to forest areas to meet the high demand for agricultural production in the region. After the establishment of biosphere reserve and protection of the forest by the government in the study area, the NDVI value was increased to 0.55 (). The result of this study was more agreement with the previous studies (Li et al. Citation2020; Merga et al. Citation2022; Moisa, Dejene and Gemeda Citation2022; Moisa, Merga, et al. Citation2022). In addition NDVI values, which can provide information on vegetation status of the study area, interviews were conducted with key informants to understand the status of forest cover after the establishment of the Yayo Biosphere Reserve. Thus, key informants interview minimizes uncertainty about the actual status of forest cover on the ground. This is because the NDVI values represent only a few extreme pixels, making it very difficult to draw conclusions about the status of forests in a particular region with a high degree of uncertainty. Results show that the central and southern parts of the study area has higher NDVI values whereas, northern parts has lower NDVI values from 1986 to 2021.
Figure 5. NDVI map of the study area.
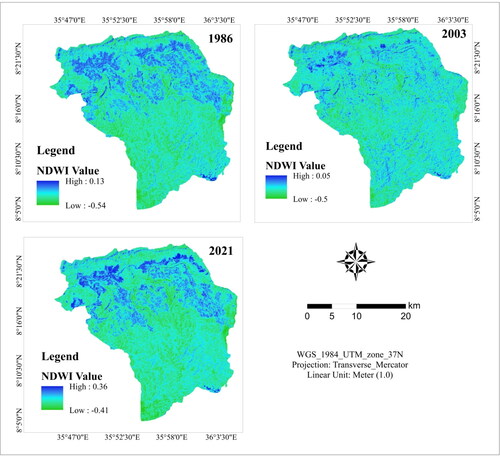
The status of water bodies were determined by NDWI. The results of this study revealed that the maximum values of NDWI were declined from 0.13 to 0.05 in 1986 to 2003 before conservation initiatives. However, the values of NDWI increased by 0.36 after conservation measures and later establishment of Yayo biosphere reserve. This implies the higher deterioration of wetland over the past decades was reversed after the establishment of Yayo Biosphere Reserve. These findings are validated by key informant interviews. Ethiopia government recognized the importance of biosphere reserve in the protection of natural resources in southwestern parts of Ethiopia including Yayo biosphere reserve (Tadese et al. Citation2021). The southern parts of the study area occupied with lower NDWI value while the northern and northwestern parts are characterized with higher NDWI values ().
Figure 6. NDWI map of the study area.
LST in response to LULC change
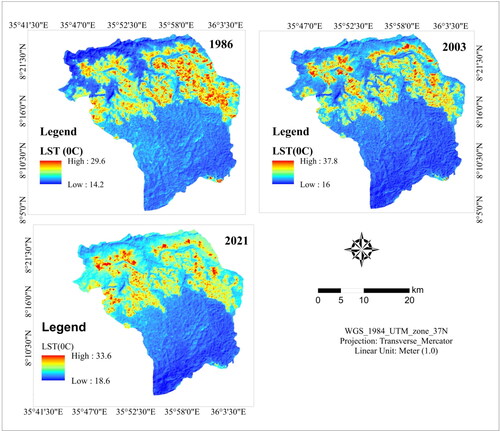
The year selection for this study was depended on the establishment of Yayo biosphere reserve by UNESCO which located in Yayo district. The mean LST directly inter related to status of LULC change in the study area. Results show that the LST of Yayo district was increased from 19 to 21 °C in 1986 to 2003. Before the Yayo Biosphere Reserve is established in 2010, the LST increased by 2 °C from 1986 to 2003. This could be occurred due conversion of forest and wetland to cultivated land which exhibit the status of carbon stock and rises the temperature in the study area. Every country is experiencing the effects of climate change, but depending adaptive capacity, the severity may vary. Temperatures in Ethiopia warmed-up in every region. Climate change has been seen in wettest parts particularly Southwestern Ethiopia (Gemeda et al. Citation2021; Wang et al. Citation2023). Climate change causes for declining of rainfall during the main crop growing season and have an impact on agricultural productions and results in food insecurity. However, between 2003 and 2021 the mean LST decreased from 21 to 17.5 °C due to forest cover enhancement and wetland conservation practices. This conservation measure contributes to the decline of LST by 1.5 °C from 1986 to 2021. The declining of LST over the study period might be due to establishment of Yayo Biosphere Reserve as one of forest conservation mechanisms (Tadese et al. Citation2021). Spatially, central part of the study area was experienced with higher LST while northern and southern parts were mostly encompassing with lower LST due to conservation of forest land and wetland (). The area covered with high and low LST was validated by using ground control points which collected by Google earth and handled GPS. The results of this study are inconsistency with previous studies (Merga et al. Citation2022; Moisa et al. Citation2022b). Contrasting results are due to variations in geographical locations, including the extent of forest and wetland ecosystems. Merga et al. (Citation2022) conducted around Didessa River Sub-basin, while the work of Moisa et al. (Citation2022b) was around the Anger River Sub-basin. Both sites have less forests and wetlands than Yayo.
Figure 7. LST map of the study area.
Correlation between LULC and LST
The relationship between LULC and LST was analyzed over study period. The results show that the mean LST over cultivated land was increased from 22.8 to 27 °C between 1986 and 2003. Similarly, the mean LST over forest declined from 21.1 °C in 2003 to 19.6 °C after forest conservation strategies (). Between 1986 and 2003 the LST over bare land, cultivated land, forest, grassland and wetland were raised by 6.8, 4.2, 3.6, 5.7 and 5.8 °C, respectively. However, from 2003 to 2021, substantial decline of the mean LST has been observed in all LULC classes. The status of LST in bare land, cultivated land, forest, grassland and wetland were decreased by 3, 0.6, 1.5, 1.3 and 2.6 °C, respectively. The declining of LST from 2003 onwards indicates the presence of conservation practies. This result is inconsistency with previous studies (Moisa, Dejene and Gemeda Citation2022; Merga et al. Citation2022) who reported the increasing trend of LST over different LULC classes (Moisa, Dejene and Gemeda Citation2022; Merga et al. Citation2022).
Table 6. Relationship of LULC and LST.
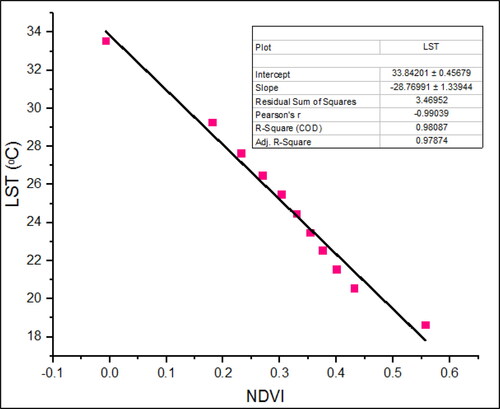
The correlation between LST and NDVI
Results show that LST and NDVI have inverse relationship (). Because an increase in NDVI value leads to a decrease in LST. The Pearson’s r values indicates that LST and NDVI has strong negative correlation (r= −0.99). The adjusted R-square value also indicates strong relation between the two variables (0.978). This implies that higher vegetation density related to lower LST (). The decline of vegetation cover due to expansion of agricultural land was the main causes for increments LST (Moisa, Dejene and Gemeda Citation2022; Merga et al. Citation2022; Yang, Li, et al. Citation2022). In addition, the study more consistence with the previous studies (Yang et al. Citation2021; Zhao et al. Citation2021), LST was increased during vegetation cover was declined and vice versa.
Figure 8. Correlation between LST and NDVI.
The correlation between LST and NDWI
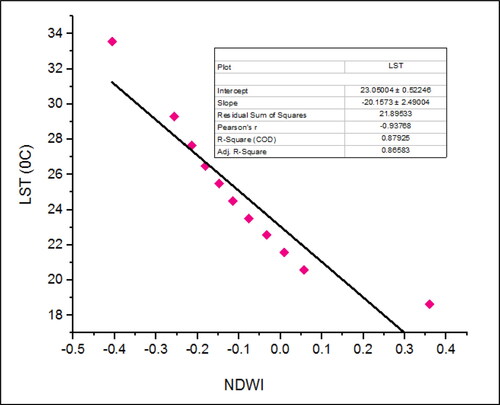
The results show a strong negative association between LST and NDWI. The Pearson’s r values indicate a strong negative correlation between LST and NDWI (r= −0.93). The adjusted R-Square value also shows a strong relation between the two variables (0.86). Degradation of NDWI causes increments of LST and vice versa (). The results of this study are consistent with studies reporting an inverse relationship between LST and NDWI (Zhou and Wang Citation2011; Yang, Dou, et al. Citation2022). In addition, the result of the present study in line with which conducted in mountain in the southeastern Tibetan Plateau and indicated that, LST has strong influence on water resources and glacial changes (Zhao et al. Citation2021).
Figure 9. Correlation between LST and NDWI.
Regression analysis of LST
In this study, inferential statistics were used in the form of a one-way analysis of variance (ANOVA) to examine the effect of LULC on LST (). This regression analysis was performed between independent variable (NDWI and NDVI) and dependent variable (LST). Bala et al. (Citation2018) and Mensah et al. (Citation2020) reported a non-linear relationship between LST with NDVI and NDWI. The LST of the study area was decreased due to increasing values of NDVI and NDWI. Yang et al. (Citation2021) stated that, LST has strong relationship with vegetation cover (NDVI) and water resources in the Tibetan Plateau.
Table 7. Regression analysis of LST with NDVI and NDWI.
Conclusion
Wetlands and forest played a key role in minimizing LST and climate change by absorbing and storing carbon to mitigate atmospheric greenhouse gases effects on ecological balance. In the study area, forest land was increased by an area of 319.4 km2 (39.5%) in 1986 to 488.6 km2 (60.5%) in 2021. Wetland land cover is also increased by 8.8 km2. The mean LST was decreased by 1.5 °C due to conservation initiatives around Yayo district over the past 35 year. The results of this study can be useful for policy makers to invest on forest and wetland conservation to minimize the problem of climate change in general and LST is particularly.
Consequently, the mean LST was increased from 1986 to 2003 by 22.8–27 °C in cultivated land. However, in 2021 the mean of LST decreased to 26.4 °C after conservation measure was taken for Yayo Forest. In addition, the LST was decreased from 2003 to 2021 with the mean of 21.1–19.6 °C after wise use of natural resources. The mean LST in cultivated land increased from 22.8 °C in 1986 to 27 °C in 2003, while 26.4 °C in 2021 due to forest and conservation in the study area. Similarly, mean LST was increased in 2003, but decreased in 2021 due initiation of forest and wetland conservation. The result was validated by using Google earth and GPS ground truth data the area captured with high LST and low LST. In addition, LULC classes were validated by collected ground truth data. To minimize LST, natural resource managers and environmental analyst should increase public awareness on the importance of forest and wetland conservation. Further studies which considers socio economic data about the impacts of wetland and forest degradation on the rising of LST should be conducted in the study area. Moreover, high resolution satellite images can be used to classify LULC classes at five year interval by minimizing uncertainties and soil dryness influence on LST estimation.
Ethical approval
The authors agreed to publish the manuscript on Scandinavian Journal Forest Research.
Author contributions
MBM involved in research design, data collection, data analysis, and draft manuscript writing. YNW, GGN, MDN and BTG involved in data analysis MMG, KTD and DOG participated in methodology, data analysis and manuscript edition. All authors read and approved the final manuscript.
Acknowledgments
The authors would like to acknowledge Wollega University Shambu Campus Faculty of Technology, Faculty of Agriculture, Faculty of Resource Management and Economics, Wollega University Nekemte Campus, Raya University and Jimma University College of Agriculture and Veterinary Medicine for the existing facilities to conduct this study. No funding received for this research.
Disclosure statement
No potential conflict of interest was reported by the author(s).
Data availability statement
Available in this manuscript.
References
- Abera W, Tamene L, Kassawmar T, Mulatu K, Kassa H, Verchot L, Quintero M. 2021. Impacts of land use and land cover dynamics on ecosystem services in the Yayo coffee forest biosphere reserve, southwestern Ethiopia. Ecosyst Serv. 50:101338. doi: 10.1016/j.ecoser.2021.101338.
- Bala R, Prasad R, Yadav VP, Sharma J. 2018. A comparative study of land surface temperature with different indices on heterogeneous land cover using Landsat 8 data. Int Arch Photogramm Remote Sens Spatial Inf Sci. XLII-5:389–394. doi: 10.5194/isprs-archives-XLII-5-389-2018.
- Balew A, Korme T. 2020. Monitoring land surface temperature in Bahir Dar city and its surrounding using Landsat images. Egypt J Remote Sens Space Sci. 23(3):371–386. doi: 10.1016/j.ejrs.2020.02.001.
- Burgund D, Nikolovski S, Galic D, Maravic N. 2023. Pearson correlation in determination of quality of current transformers. Sensors. 23(5):2704. doi: 10.3390/s23052704.
- Carlson TN, Ripley DA. 1997. On the relation between NDVI, fractional vegetation cover, and leaf area index. Remote Sens Environ. 62(3):241–252. doi: 10.1016/S0034-4257(97)00104-1.
- Chander G, Markham BL, Helder DL. 2009. Summary of current radiometric calibration coefficients for Landsat MSS, TM, ETM+, and EO-1 ALI sensors. Remote Sens Environ. 113(5):893–903. doi: 10.1016/j.rse.2009.01.007.
- Chibuike EM, Ibukun AO, Kunda JJ, Abbas A. 2018. Assessment of Green Parks cooling effects on Abuja urban microclimate using geospatial techniques. Remote Sens Appl Soc Environ. 11:11–21. doi: 10.1016/j.rsase.2018.04.006.
- Elmore AJ, Mustard JF, Manning SJ, Lobell DB. 2000. Quantifying vegetation change in semiarid environments: precision and accuracy of spectral mixture analysis and the normalized difference vegetation index. Remote Sens Environ. 73(1):87–102. doi: 10.1016/S0034-4257(00)00100-0.
- Erwin KL. 2009. Wetlands and global climate change: the role of wetland restoration in a changing world. Wetlands Ecol Manage. 17(1):71–84. doi: 10.1007/s11273-008-9119-1.
- Fang Y-K, Wang H-C, Fang P-H, Liang B, Zheng K, Sun Q, Li X-Q, Zeng R, Wang A-J. 2023. Life cycle assessment of integrated bioelectrochemical-constructed wetland system: environmental sustainability and economic feasibility evaluation. Resour Conserv Recycl. 189:106740. doi: 10.1016/j.resconrec.2022.106740.
- Gebre T, Gebremedhin B. 2019. The mutual benefits of promoting rural-urban interdependence through linked ecosystem services. Global Ecol Conserv. 20:e00707. doi: 10.1016/j.gecco.2019.e00707.
- Gemeda DO, Korecha D, Garedew W. 2021. Evidences of climate change presences in the wettest parts of southwest Ethiopia. Heliyon. 7(9):e08009. doi: 10.1016/j.heliyon.2021.e08009.
- Getahun D, Keno ET. 2019. Attitudes and perceptions of the local community towards Yayo coffee forest biosphere reserve, Ilu Abba Bora Zone of Oromia National Regional State. Ethiop J Sci Sustain Develop. 6(1):79–90.
- He M-Y, Dong J-B, Jin Z, Liu C-Y, Xiao J, Zhang F, Sun H, Zhao Z-Q, Gou L-F, Liu W-G, et al. 2021. Pedogenic processes in loess-paleosol sediments: clues from Li isotopes of leachate in Luochuan loess. Geochim Cosmochim Acta. 299:151–162. doi: 10.1016/j.gca.2021.02.021.
- Huang S, Lyu Y, Sha H, Xiu L. 2021. Seismic performance assessment of unsaturated soil slope in different groundwater levels. Landslides. 18(8):2813–2833. doi: 10.1007/s10346-021-01674-w.
- Jackson TJ, Chen D, Cosh M, Li F, Anderson M, Walthall C, Hunt ER. 2004. Vegetation water content mapping using Landsat data derived normalized difference water index for corn and soybeans. Remote Sens Environ. 92(4):475–482. doi: 10.1016/j.rse.2003.10.021.
- Junk WJ, An S, Finlayson CM, Gopal B, Květ J, Mitchell SA, Mitsch WJ, Robarts RD. 2013. Current state of knowledge regarding the world’s wetlands and their future under global climate change: a synthesis. Aquat Sci. 75(1):151–167. doi: 10.1007/s00027-012-0278-z.
- Kattel GR. 2022. Climate warming in the Himalayas threatens biodiversity, ecosystem functioning and ecosystem services in the 21st century: is there a better solution? Biodivers Conserv. 31(8–9):2017–2044. doi: 10.1007/s10531-022-02417-6.
- Kayumba PM, Chen Y, Mind’je R, Mindje M, Li X, Maniraho AP, Umugwaneza A, Uwamahoro S. 2021. Geospatial land surface-based thermal scenarios for wetland ecological risk assessment and its landscape dynamics simulation in Bayanbulak Wetland, Northwestern China. Landscape Ecol. 36(6):1699–1723. doi: 10.1007/s10980-021-01240-8.
- Kumari, B, Tayyab, M, Mallick, J, Khan, MF, Rahman, A, Shahfahad, S. 2018. Satellite-driven land surface temperature (LST) using Landsat 5, 7 (TM/ETM + SLC) and Landsat 8 (OLI/TIRS) data and its association with built-up and green cover over urban Delhi, India. Remote Sens Earth Syst Sci. 1(3–4):63–78. doi: 10.1007/s41976-018-0004-2.
- Li J, Charles LS, Yang Z, Du G, Fu S. 2022. Differential mechanisms drive species loss under artificial shade and fertilization in the alpine meadow of the Tibetan Plateau. Front Plant Sci. 13:832473. doi: 10.3389/fpls.2022.832473.
- Li W, Shi Y, Zhu D, Wang W, Liu H, Li J, Shi N, Ma L, Fu S. 2021. Fine root biomass and morphology in a temperate forest are influenced more by the nitrogen treatment approach than the rate. Ecol Indic. 130:108031. doi: 10.1016/j.ecolind.2021.108031.
- Liu S, Hou J, Suo C, Chen J, Liu X, Fu R, Wu F. 2022. Molecular-level composition of dissolved organic matter in distinct trophic states in Chinese lakes: implications for eutrophic lake management and the global carbon cycle. Water Res. 217:118438. doi: 10.1016/j.watres.2022.118438.
- Liu J, Liu S, Tang X, Ding Z, Ma M, Yu P. 2022. The response of land surface temperature changes to the vegetation dynamics in the Yangtze River Basin. Remote Sensing. 14(20):5093. doi: 10.3390/rs1420509.
- Liu Y, Zhang K, Li Z, Liu Z, Wang J, Huang P. 2020. A hybrid runoff generation modelling framework based on spatial combination of three runoff generation schemes for semi-humid and semi-arid watersheds. Journal of Hydrology (Amsterdam). 590:125440. doi: 10.1016/j.jhydrol.2020.125440.
- Li J, Wang Y, Nguyen X, Zhuang X, Li J, Querol X, Li B, Moreno N, Hoang V, Cordoba P, et al. 2022. First insights into mineralogy, geochemistry, and isotopic signatures of the Upper Triassic high‑sulfur coals from the Thai Nguyen Coal field, NE Vietnam. Int J Coal Geol. 261:104097. doi: 10.1016/j.coal.2022.104097.
- Li J, Wang Z, Wu X, Xu C, Guo S, … Chen X. 2020. Toward monitoring short-term droughts using a novel daily scale, standardized antecedent precipitation evapotranspiration index. Journal of Hydrometeorology. 21(5):891–908. doi: 10.1175/JHM-D-19-0298.1.
- Mensah C, Atayi J, Kabo-Bah AT, Švik M, Acheampong D, Kyere-Boateng R, Prempeh NA, Marek MV. 2020. Impact of urban land cover change on the garden city status and land surface temperature of Kumasi. Cogent EnvironSci. 6(1):1787738. doi: 10.1080/23311843.2020.1787738.
- Merga BB, Moisa MB, Negash DA, Ahmed Z, Gemeda DO. 2022. Land surface temperature variation in response to land-use and land-cover dynamics: a case of Didessa River sub-basin in Western Ethiopia. Earth Syst Environ. 6(4):803–815. doi: 10.1007/s41748-022-00303-3.
- Moat J, Williams J, Baena S, Wilkinson T, Gole TW, Challa ZK, Demissew S, Davis AP. 2017. Resilience potential of the Ethiopian coffee sector under climate change. Nat Plants. 3(7):17081. doi: 10.1038/nplants.2017.81.
- Moisa MB, Dejene IN, Gemeda DO. 2022. Geospatial technology–based analysis of land use land cover dynamics and its effects on land surface temperature in Guder River sub-basin, Abay Basin, Ethiopia. Appl Geomat. 14(3):451–463. doi: 10.1007/s12518-022-00445-z.
- Moisa MB, Dejene IN, Hinkosa LB, Gemeda DO. 2022. Land use/land cover change analysis using geospatial techniques: a case of Geba watershed, western Ethiopia. SN Appl Sci. 4(6):1–10. doi: 10.1007/s42452-022-05069-x.
- Moisa MB, Dejene IN, Merga BB, Gemeda DO. 2022a. Soil loss estimation and prioritization using geographic information systems and the RUSLE model: a case study of the Anger River sub-basin, Western Ethiopia. J Water Climat Change. 13(3):1170–1184. doi: 10.2166/wcc.2022.433.
- Moisa MB, Dejene IN, Merga BB, Gemeda DO. 2022b. Impacts of land use/land cover dynamics on land surface temperature using geospatial techniques in Anger River Sub-basin, Western Ethiopia. Environ Earth Sci. 81(3):1–14. doi: 10.1007/s12665-022-10221-2.
- Moisa MB, Gemeda DO. 2021. Analysis of urban expansion and land use/land cover changes using geospatial techniques: a case of Addis Ababa City, Ethiopia. Appl Geomat. 13(4):853–861. doi: 10.1007/s12518-021-00397-w.
- Moisa MB, Merga BB, Gemeda DO. 2022. Multiple indices-based assessment of agricultural drought: a case study in Gilgel Gibe Sub-basin, Southern Ethiopia. Theor Appl Climatol. 148(1–2):455–464. doi: 10.1007/s00704-022-03962-4.
- Moisa MB, Negash DA, Merga BB, Gemeda DO. 2021. Impact of land-use and land-cover change on soil erosion using the RUSLE model and the geographic information system: a case of Temeji watershed, Western Ethiopia. J Water Climate Change. 12(7):3404–3420. doi: 10.2166/wcc.2021.131.
- Moisa MB, Tiye FS, Dejene IN, Gemeda DO. 2022. Land suitability analysis for maize production using geospatial technologies in the Didessa watershed, Ethiopia. Artif Intell Agric. 6:34–46. doi: 10.1016/j.aiia.2022.02.001.
- Muro J, Strauch A, Heinemann S, Steinbach S, Thonfeld F, Waske B, Diekkrüger B. 2018. Land surface temperature trends as indicator of land use changes in wetlands. Int J Appl Earth Obs Geoinf. 70:62–71. doi: 10.1016/j.jag.2018.02.002.
- Negash DA, Moisa MB, Merga BB, Sedeta F, Gemeda DO. 2021. Soil erosion risk assessment for prioritization of sub-watershed: the case of Chogo Watershed, Horo Guduru Wollega, Ethiopia. Environ Earth Sci. 80(17):1–11. doi: 10.1007/s12665-021-09901-2.
- Neinavaz E, Skidmore AK, Darvishzadeh R. 2020. Effects of prediction accuracy of the proportion of vegetation cover on land surface emissivity and temperature using the NDVI threshold method. Int J Appl Earth Obs Geoinf. 85:101984. doi: 10.1016/j.jag.2019.101984.
- Oostdijk S. 2021. Deforestation and forest fragmentation in Southwestern Ethiopia from 1973 to 2019 [master’s thesis]. Utrecht, Netherlands: Utrecht University.
- Pei Y, Qiu H, Zhu Y, Wang J, Yang D, Tang B, Wang F, Cao M. 2023. Elevation dependence of landslide activity induced by climate change in the eastern Pamirs. Landslides. 20(6):1115–1133. doi: 10.1007/s10346-023-02030-w.
- Seddon N, Chausson A, Berry P, Girardin CA, Smith A, Turner B. 2020. Understanding the value and limits of nature-based solutions to climate change and other global challenges. Philos Trans R Soc Lond B Biol Sci. 375(1794):20190120. doi: 10.1098/rstb.2019.0120.
- Singh P, Kikon N, Verma P. 2017. Impact of land use change and urbanization on urban heat island in Lucknow city, Central India. A remote sensing based estimate. Sustain Cities Soc. 32:100–114. doi: 10.1016/j.scs.2017.02.018.
- Siqi J, Yuhong W. 2020. Effects of land use and land cover pattern on urban temperature variations: a case study in Hong Kong. Urban Clim. 34:100693. doi: 10.1016/j.uclim.2020.100693.
- Srivastava PK, Majumdar TJ, Bhattacharya AK. 2010. Study of land surface temperature and spectral emissivity using multi-sensor satellite data. J Earth Syst Sci. 119(1):67–74. doi: 10.1007/s12040-010-0002-0.
- Šverko Z, Vrankić M, Vlahinić S, Rogelj P. 2022. Complex Pearson correlation coefficient for EEG connectivity analysis. Sensors. 22(4):1477. doi: 10.3390/s22041477.
- Tadese S, Soromessa T, Bekele T, Meles B. 2021. Biosphere reserves in the Southwest of Ethiopia. Adv Agric. 2021:1–7. doi: 10.1155/2021/1585149.
- Tafesse B, Suryabhagavan KV. 2019. Systematic modeling of impacts of land-use and land-cover changes on land surface temperature in Adama Zuria District, Ethiopia. Model Earth Syst Environ. 5(3):805–817. doi: 10.1007/s40808-018-0567-1.
- Van Khuc Q, Tran BQ, Meyfroidt P, Paschke MW. 2018. Drivers of deforestation and forest degradation in Vietnam: an exploratory analysis at the national level. Forest Pol Econ. 90:128–141. doi: 10.1016/j.forpol.2018.02.004.
- Wang F, Harindintwali JD, Wei K, Shan Y, Mi Z, Costello MJ, Grunwald S, Feng Z, Wang F, Guo Y, et al. 2023. Climate change: strategies for mitigation and adaptation. TIG. 1(1):100015–100011. doi: 10.59717/j.xinn-geo.2023.100015.
- Wang H, Liu Y, Yang Y, Fang Y, Luo S, Cheng H, Wang A. 2022. Element sulfur-based autotrophic de nitrification constructed wetland as an efficient approach for nitrogen removal from low C/N wastewater. Water Res. 226:119258. doi: 10.1016/j.watres.2022.119258.
- Wang X, Wang T, Xu J, Shen Z, Yang Y, Chen A, Wang S, Liang E, Piao S. 2022. Enhanced habitat loss of the Himalayan endemic flora driven by warming-forced upslope tree expansion. Nat Ecol Evol. 6(7):890–899. doi: 10.1038/s41559-022-01774-3.
- Wolteji BN, Bedhadha ST, Gebre SL, Alemayehu E, Gemeda DO. 2022. Multiple indices based agricultural drought assessment in the rift valley region of Ethiopia. Environmental Challenges. 7:100488. doi: 10.1016/j.envc.2022.100488.
- Xu Z, Wang Y, Jiang S, Fang C, Liu L, Wu K, Luo Q, Li X, Chen Y. 2022. Impact of input, preservation and dilution on organic matter enrichment in lacustrine rift basin: a case study of lacustrine shale in Dehui Depression of Songliao Basin, NE China. Mar Pet Geol. 135:105386. doi: 10.1016/j.marpetgeo.2021.105386.
- Yan Y, Jarvie S, Liu Q, Zhang Q. 2022. Effects of fragmentation on grassland plant diversity depend on the habitat specialization of species. Biol Conserv. 275:109773. doi: 10.1016/j.biocon.2022.109773.
- Yang Y, Dou Y, Wang B, Xue Z, Wang Y, An S, Chang SX. 2022. Deciphering factors driving soil microbial life-history strategies in restored grasslands. iMeta. 2(1). doi: 10.1002/imt2.66.
- Yang Y, Li T, Pokharel P, Liu L, Qiao J, Wang Y, An S, Chang SX. 2022. Global effects on soil respiration and its temperature sensitivity depend on nitrogen addition rate. Soil Biol Biochem. 174:108814. doi: 10.1016/j.soilbio.
- Yang J, Sun J, Ge Q, Li X. 2017. Assessing the impacts of urbanization –associated green space on urban land surface temperature: a case study of Dalian, China. Urban Forest Urban Green. 22:1–10. doi: 10.1016/j.ufug.2017.01.002.
- Yang M, Zhao A, Ke H, Chen H. 2023. Geo-environmental factors & influence on the prevalence and distribution of dental fluorosis: evidence from Dali County, Northwest China. Sustainability. 15(3):1871. doi: 10.3390/su15031871.
- Yang M, Zhao W, Zhan Q, Xiong D. 2021. Spatiotemporal patterns of land surface temperature change in the Tibetan plateau based on MODIS/Terra daily product from 2000 to 2018. IEEE J Sel Top Appl Earth Observ Remote Sens. 14:6501–6514. doi: 10.1109/JSTARS.2021.3089851.
- Yue W, Xu J, Tan W, Xu L. 2007. The relationship between land surface temperature and NDVI with remote sensing: application to Shanghai Landsat 7ETM + data. Int J Remote Sens. 28(15):3205–3226. doi: 10.1080/01431160500306906.
- Zhang S, Bai X, Zhao C, Tan Q, Luo G, Wang J, Li Q, Wu L, Chen F, Li C, et al. 2021. Global CO2 consumption by silicate rock chemical weathering: its past and future. Earth’s Future. 9(5):e1938E–e2020E. doi: 10.1029/2020EF001938.
- Zhang B, Zhang M, Hong D. 2021. Land surface temperature retrieval from Landsat 8 OLI/TIRS images based on back-propagation neural network. Indoor Built Environ. 30(1):22–38. doi: 10.1177/1420326X19882079.
- Zhao W, Yang M, Chang R, Zhan Q, Li ZL. 2021. Surface warming trend analysis based on MODIS/Terra land surface temperature product at Gongga Mountain in the southeastern Tibetan Plateau. JGR Atmos. 126(22):e2020JD034205. doi: 10.1029/2020JD034205.
- Zhou S, Liu D, Zhu M, Tang W, Chi Q, Ye S, Xu S, Cui Y. 2022. Temporal and spatial variation of land surface temperature and its driving factors in Zhengzhou City in China from 2005 to 2020. Remote Sens. 14(17):4281. doi: 10.3390/rs14174281.
- Zhou X, Wang YC. 2011. Dynamics of land surface temperature in response to LULC. Geograph Res. 49(1):23–36. doi: 10.1111/j.1745-5871.2010.00686.x.
- Zhou J, Wang L, Zhong X, Yao T, Qi J, Wang Y, Xue Y. 2022. Quantifying the major drivers for the expanding lakes in the interior Tibetan Plateau. Sci Bull. 67(5):474–478. doi: 10.1016/j.scib.2021.11.010.
- Zhu G, Liu Y, Wang L, Sang L, Zhao K, Zhang Z, Lin X, Qiu D. 2023. The isotopes of precipitation have climate change signal in arid Central Asia. Global Planet Change. 225:104103. doi: 10.1016/j.gloplacha.2023.104103.