
Abstract
Lingonberries (LB) have been shown to have beneficial metabolic effects, which is associated with an altered gut microbiota. This study investigated whether the LB-induced improvements were associated with altered gut- and neuroinflammatory markers, as well as cognitive performance in ApoE−/− mice fed high-fat (HF) diets. Whole LB, as well as two separated fractions of LB were investigated. Eight-week-old male ApoE−/− mice were fed HF diets (38% kcal) containing whole LB (wLB), or the insoluble (insLB) and soluble fractions (solLB) of LB for 8 weeks. Inclusion of wLB and insLB fraction reduced weight gain, reduced fat deposition and improved glucose response. Both wLB and insLB fraction also changed the caecal microbiota composition and reduced intestinal S100B protein levels. The solLB fraction mainly induced weight loss in the mice. There were no significant changes in spatial memory, but significant increases in synaptic density in the hippocampus were observed in the brain of mice-fed wLB and insLB. Thus, this study shows that all lingonberry fractions counteracted negative effects of HF feedings on metabolic parameters. Also, wLB and insLB fraction showed to potentially improve brain function in the mice.
Introduction
Metabolic syndrome (MetS), a cluster of risk factors for obesity, type II diabetes mellitus and cardiovascular diseases, accompanying with low-grade systemic inflammation, has been associated with cognitive decline and dementiaCitation1,Citation2. Impaired vascular activity, neuroinflammation, oxidative stress, and abnormal brain lipid metabolism negatively affect cognitive performance and brain structureCitation2. Atherosclerosis (ATH) and Alzheimer’s disease (AD), in particular, have been ascribed to share a common aetiology, and are underpinned by genes that affect cholesterol transport and metabolism, as well as the immune system, including different allelic variants of the apolipoprotein E (APOE) geneCitation3.
Westernization of the diet, i.e., increased intake of diets rich in saturated fats, is associated with the ongoing rise in both ATH and ADCitation3. Diet, acting as a shared substrate between the host and the gut microbiota, significantly affects health and disease states of the host both directly and indirectly through the gut microbiotaCitation4. A delicate balance of the gut microbiota is essential for maintaining the healthy status of the host, via optimal immune responsesCitation5 and utilization of beneficial metabolites, including short-chain fatty acids (SCFAs). Dysbiosis of the gut microbiota has been shown to be associated with different metabolic diseases such as obesity, diabetes, chronic systemic inflammation, and atherosclerotic cardiovascular diseaseCitation6. Increasing evidence suggests a possible role of the gut microbiota in neurodegenerative disorders such as Parkinson’s diseaseCitation7,Citation8 and ADCitation9. Thus, acquiring a healthy gut microbial community may serve as an effective strategy to restore or prevent the development of metabolic syndrome and, to a further extent, neurodegenerative diseases.
Interest in certain foods or food components that may provide specific health effects is growing. Experiments in rodents, using tailored prebiotics, have demonstrated the ability to alter the gut microbiota composition. Moreover, these alterations could be linked to lower levels of systemic inflammationCitation10. Lingonberries (Vaccinium vítis-idaéa, LB), wild berries mostly harvested in Nordic countries, have previously been shown to prevent diet-induced obesityCitation11, improve insulin resistanceCitation12, and reduce inflammationCitation13 in animal models and healthy humans. A previous study from our group showed that LB altered the gut microbiota composition in association with reduced ATH plaques in ApoE−/− mice fed a high-fat (HF) dietCitation14. The benefits of LB supplementation in HF setting on ATH could also have positive effects on the brain and cognitive function, however, these had yet to be investigated. Similar to other berries, LB provides good sources of dietary fibre, the indigestible components of plants that serve as substrates for the gut microbiota. LB also contains other bioactive components such as vitamin C and E and polyphenolsCitation15,Citation16. Also, specific fractions or components in LB that may be responsible for their positive metabolic and anti-inflammatory effects are still elusive. Water solubility is one of the characterizations used for characterization of dietary fibre with different nutritional effects and it may be useful to identify the active fraction of LB that exhibits such beneficial effects related to the gut microbiota.
The aim of this study was to test whether soluble and insoluble fractions of LB alter specific group(s) of the gut microbiota responsible for beneficial effects on metabolism and inflammatory status, as well as to examine their possible effects on brain functions and behaviour in mice. Whole LB (wLB) and two fractions of LB, extracted based on the water solubility of the dietary fibre (insoluble LB, insLB and soluble LB, solLB), were tested in ApoE−/− mice fed HF diets. S100B, a cytosolic calcium-binding protein, stimulates inflammatory responses both in enteric glial cells (EGCs)Citation17–19 and astrocytesCitation20 was measured in the gut and the brain. It has been shown to interact differently with pathogenic and beneficial bacteria in the gutCitation21. However, in the brain, nanomolar concentrations of S100B seem to promote neuronal survivals and relates synaptic plasticity and hippocampus-dependent learning and memoryCitation22, while micromolar concentrations are reported to have pro-inflammatory effectsCitation23–26. Spontaneous alternation in a T-maze was performed to assess spatial memory in the miceCitation27. The number of synapses in the hippocampal CA1 area was determined to further assess brain function.
Materials and methods
Preparation of the diets
Freeze-dried LB were provided by Skogsmat i Uddeholm AB (Karlstad, Sweden). The berries were milled into a powder. Insoluble and soluble fractions of the whole LB were separated based on the water solubility of the dietary fibre, following the protocol from Jakobsdottir et al.Citation28. Briefly, freeze-dried LB powder was mixed with distilled water to a final volume of 5 l/kg, pH 2, and heated up to 80°C for 10–15 minutes under constant stirring to solubilize the dietary fibre. The berry solution was then centrifuged and the supernatant (soluble fraction, solLB) was filtered through a sieve and the pellet was collected (insoluble fraction, insLB). Both the pellet and the supernatant were frozen at −20°C prior to freeze-drying. The fractions were milled before dietary fibre content in each LB fraction was determined using an enzymatic-gravimetric methodCitation29. The whole LB and the fractions were shipped to Research Diets, Inc. (New Brunswick, USA) for preparation of rodent pellets with the inclusion of essential macro- and micronutrients for rodents. Information about the composition of each diet is given in .
Table 1 Composition of the experimental dietsa.
Animal experiment
Male ApoE−/− mice (Taconic Biosciences Inc., Silkeborg, Denmark) arrived at the animal facility at the age of 7 weeks, with an initial weight of 21.9±0.2 g. They were randomly allocated into 5 groups of 10 animals (5 animals per cage). Each group was given a HF diet (38% kcal), with the inclusion of either wLB, insLB or solLB (n=10) or cellulose with the same level of dietary fibre in the diet. The mice were allowed to adapt to the environment (22°C, 12 h light-dark cycle) and diets for 1 week prior to starting the experimental period. The initial experimental plan was to include 60 g/kg of dietary fibre from LB, insLB, or solLB into each diet. However, the mice given solLB diet showed rapid weight loss during the acclimatization week, despite a similar feed intake as the other groups, so the amount of dietary fibre in this diet had to be adjusted and fed for shorter period. Hence, the study contains two sets of experiments.
In the first set of the experiments, the HF diets with 60 g/kg dietary fibre from wLB, insLB, or cellulose (HF-control1) were given for 8 weeks, starting when the mice were 8-weeks-old. In the second set of the experiments, solLB diet, which contained 15 g/kg of dietary fibre from solLB fraction and 45 g/kg from cellulose, was given to the mice for a total period of 2 weeks, starting when the mice were 14-weeks-old. As a control in this experiment, a group of mice given the HF control diet for 2 weeks (HF-control2, n=6), was included. Before the solLB and HF-control2 diet feeding, the mice were kept at the animal facility on standard rodent chow (RM1, SDS). All mice in both sets were 16-weeks-old at the end of the experiment and the same analyses were performed in each group, unless stated otherwise. Body weight and food intake (g per cage) were recorded once a week. A schematic layout of the experiment is shown in .
Sample collection
At the end of the experiment, seven mice from each group were anesthetized using Isoflurane (Abbott, Chicago, USA) and samples for analytical assays were collected from these mice, whereas three mice were saved for brain histology of synaptic density. Blood samples in the seven mice were collected from the heart before the mice were terminated. Blood plasma and serum were separated from the collected blood. The mouse brains were quickly dissected out and the different areas (hippocampus, cerebellum, and cerebral hemispheres) were isolated and immediately frozen. Small intestine (SI), caecum, and colon were collected and immediately stored on dry ice. Furthermore, whole wall segments of proximal, middle, and distal SI, as well as the middle part of colon were dissected, rinsed and stored in RNA-later™ (Thermo Fisher Scientific, Sweden) for 24 hours at +4°C prior to protein extraction. Epididymal fat pads, spleen, and liver were weighed. Hearts were embedded with OCT cryomount medium (Histolab Products AB, Gothenburg, Sweden) in Tissue-Tek Cryomold® (Sakura Finetek, Torrance, USA) and frozen on dry ice. All samples were kept at −80°C prior to analyses.
Blood lipid profiles
Total cholesterol and triglycerides levels were measured in blood plasma samples using Infinity™ Cholesterol and Infinity™ Triglycerides Reagents (Thermo Fisher Scientific Inc., Waltham, USA). HDL- and LDL-cholesterol levels were measured using Konelab™ HDL- and LDL-Cholesterol Plus (Thermo Fisher Scientific Inc., Waltham, USA). The protocols from the manufactures were followed.
Atherosclerotic plaque area
Quantification of ATH plaques in the aortic root region of the heart was carried out following Matziouridou et al.Citation14. Briefly, 10 µm thick frozen sections of the aortic root were prepared using a cryostat (LEICA CM 1950, Leica Biosystems, Nussloch, Germany) and stained with Oil Red O (Histolab, Gothenburg, Sweden) and haematoxylin (MAYERS HTX, Histolab, Gothenburg, Sweden). BioPix2.0 software (BIOPIX software, Gothenburg, Sweden) was used to quantify plaque areas with a blinded observer setup. Mean values of three well-oriented root regions were calculated from each mouse.
Oral glucose tolerance test
Oral glucose tolerance test (OGTT) was performed on the day after the behaviour test. Basal glucose levels were measured in the blood collected from tail tips of the mice that have been fasted for 5 hoursCitation30 (morning fast) by HemoCue® Glucose 201+ (Hemocue AB, Ängelholm, Sweden). Glucose solution was orally administered at the dose of 3 g/kg body weight. Blood glucose levels were followed at 15, 30, 45, 60, 90, and 120 minutes after the glucose challenge.
Gut microbiota
DNA from caecal tissue and content was extracted using the QIAamp DNA Stool Mini Kit (Qiagen, Hilden, Germany) with the addition of a bead beating step. V4 region of 16S rRNA genes were amplified using forward and reverse primers containing Illumina overhang adaptors and unique dual indexes. The sequence of the 16S amplicon primersCitation31 were (Forward)-5′ TCGTC GGCAGCGTCAGATGTGTATAAGAGACAGGTGCCAGCMGCCGCGGTAA and (Reverse)-5′ GTCTCGTGGGCTCGGAGATGTGTATAAGAGACAGGGACTACHVGGGTWTCTAAT. Paired-end sequencing with a read length of 2×250 bp using Miseq V2 reagent kit was carried out on a Miseq Instrument (Illumina Inc., San Diago, USA). Sequencing data were analysed using the open-source bioinformatics pipeline Quantitative Insights into Microbial Ecology (QIIME)Citation32. The sequences were grouped into operational taxonomic units (OTUs) by UCLUST at a minimum of 97% sequence similarity. Representative sequences (most abundant) from each OTU were aligned using Python Nearest Alignment Space Termination (PyNAST)Citation33. Taxonomy was assigned using Greengenes database (v.13.8)Citation34.
SCFAs in caecum
The caecal content was diluted with 0.25 M HCl, containing 1 mM 2-ethylbutyric acid as internal standard. The homogenized solution was centrifuged, and the supernatant was collected and injected onto a fused-silica capillary column and subsequently analysed with gas chromatography.Citation35
S100B protein in the gut and the brain
Whole wall segments of proximal, middle, and distal SI as well as colon tissues were weighed and homogenized in RIPA buffer (Thermo Fisher Scientific, Sweden) containing Halt Protease Inhibitor Cocktail (Thermo Fisher Scientific, Sweden). Protein content was measured using Pierce BCA kit according to manufactures protocol (Thermo Fisher Sceintific, Sweden). S100B was evaluated using a commercially available ELISA kit (R&D systems, UK), according to protocol.
The brain tissues were homogenized in 10-volumes of 25 mM Tris-HCl buffer, pH 7.4, containing 1 mM EDTA, 2 mM dithiothreitol, cocktail protein inhibitors (Roche Molecular Systems, Inc., USA), and 0.01% NaN3, at 4°C. The homogenates were centrifuged at 20 000×g for 60 minutes at 4°C. The supernatant containing the water-soluble protein fraction was used to analyse the S100B protein using a commercially available ELISA kit (Abcam, UK).
S100B content was normalized to total protein concentrations and presented per mg protein.
Synaptic density in hippocampal CA1 area
For brain histology, the mice were transcardially perfused with 4% formaldehyde and 0.25% glutaraldehyde in 0.1M phosphate buffer. After perfusion, the brains were isolated and divided into two hemispheres. A hippocampus of from the right hemisphere was cut in 400-μm-thick transverse slices by a tissue chopper (McIlwain, UK). Slices were post-fixed in fixative agents, with 2.5% of glutaraldehyde for 1.5 hours and then in 1% osmium tetroxide (OsO4) for 1 hour. Tissue slices were then dehydrated in an ascending series of ethanol followed by dry acetone and embedded in EPON resin according to the standard protocolCitation36. For electron microscopy, ultra-thin sections (70 nm) from the middle portion of CA1 stratum pyramidale and stratum radiatum were stained with uranyl acetate and lead citrate. The images of hippocampal CA1 area were taken using JEM-100CX (Jeol, Japan) transmission electron microscope. Estimations of synapse density were carried out on photos by counting all asymmetric synapses followed by calculation of the number of synapses per surface unit area.
T-maze spontaneous alternation
T-maze spatial memory in a T-maze test was performed after 7 weeks on wLB, insLB and HF-control1 diets, or after 12 days on solLB and HF-control2 diets. The T-maze memory test, based on spontaneous alternation reflects the operation of spatial working or short-term memory,Citation37 and was carried out following Deacon & Rawlins, 2006Citation27 with some modifications. A T-maze with a start alley dimension of 30×10 cm (length×width) and two goal arms of 30×10 cm (length×width) each was used. Guillotine doors cut to fit the maze were used to separate the start alley, as well as the two arms from the central area. Fresh woodchip bedding was put in the bottom of the maze and changed between each mouse. A mouse was put at the start alley for 10 seconds before the guillotine door was opened to allow the mouse to spontaneously select one of the two arms (no rewarding system). Once the mouse has chosen the arm, the guillotine door to the chosen door was shut to keep the mouse in the chosen arm for 30 seconds to allow arm observation. The second trial was performed within 1 minute following the first, where the mouse was put back to the start alley of the T-maze and allowed to spontaneously choose one of the two arms again. Alternation, i.e. choosing the arm not visited before, was expected in the second trial. Three sets of trials in a day, during morning, afternoon and evening hours, were performed for each mouse. Percentage of alternation was calculated per mouse from the three sets of trial. The trials were recorded and the video tracking software Ethovision XT 13.0 (Noldus Information Technology b.v., Wageningen, The Netherlands) was used to analyse the data. Time a mouse spent to move from the start alley, once the guillotine door was opened, until the middle part of the body has crossed the guillotine door to one of the arms was analysed as time used for making a decision. The test was performed during the light phase in all animals.
Statistical analyses
GraphPad Prism version 7.03 (GraphPad Software, Inc., California, USA) was used to analyse the investigated biomarkers. Mice fed HF diets with inclusion of wLB or insLB were compared to HF-control1 group using one-way ANOVA and subsequent Dunnett’s test for multiple comparisons. Mice fed solLB group was compared with HF-control2 using Student’s t-test. Significant differences were reported when P≤0.05 and tendencies were reported when P≤0.1. The area under blood glucose curves (AUC) during the test period of 2 hours was calculated using GraphPad Prism.
Results
Dietary intake, body and organ weights, and OGTT
As compared to HF-control1 group during 8-week feeding, mice fed HF diets with inclusion of wLB and insLB had a higher dietary intake of feed (P<0.05 and P<0.001, respectively) (A) and energy (P<0.05 and P<0.001, respectively) (B). Despite higher dietary intakes, the body weight gain was lower for these mice (P<0.05 and P<0.01, respectively) (C) at the end of the experiment. Furthermore, mice fed wLB showed significant reduction in epidydimal fat pad weights (P<0.01), while those fed insLB showed a tendency to lower weights (P=0.1) (D). Caecum weight was higher (P<0.01) and spleen weight was lower (P<0.05) in mice fed wLB (F and G), while glucose responses, reported as AUC during 2-hour period following OGTT were lower with both wLB and insLB (P<0.0001 and P<0.01, respectively) (H and I).
Figure 1 Schematic layout of the experiment. Male ApoE−/− mice arrived at the age of 7 weeks and were allowed to adjust to the environment and the diets for one week. Mice fed solLB diet showed signs of intolerance to the diet during the 1-week acclimatization period and were switched back to standard chows before resuming the solLB at the age of 14 weeks. The experiment therefore consisted of two sets; (1) the first set of the experiments, the HF diets with 60 g/kg dietary fibre from wLB (n=10), insLB (n=10) or cellulose (HF-control1, n=10) were given for 8 weeks, starting when the mice were 8-weeks-old 2) the second set of the experiments, solLB diet (n=10), which contained 15 g/kg of dietary fibre from solLB fraction and 45 g/kg from cellulose, was given to the mice for only a total period of 2 weeks, starting when the mice were 14-weeks old. As a control in this experiment, a group of mice given the HF control diet for only 2 weeks (HF-control2, n=6), was included.
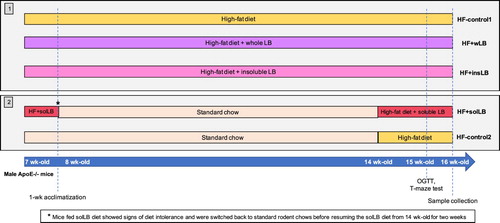
Figure 2 Dietary intake, body and organ weights, and blood glucose levels after OGTT of mice fed a HF diet with cellulose for 8 weeks (HF-control1, n=7) or for 2 weeks (HF-control2), or with whole LB (wLB, n=7) or insoluble fraction of LB (insLB, n=7) for 8 weeks, or with soluble fraction of LB (solLB, n=8) for 2 weeks. (A) Total dietary intake and (B) total caloric intake during 8-week feeding in mice fed HF-control1 and HF diets containing wLB, insLB, or during 2-week feeding in mice fed HF-control2 and HF with solLB. (C) Body weight gain (g) during the feeding periods. (D) epidydimal fat pad, (E) liver, (F) caecum, and (G) spleen weights, relative to the body weight (g/g bw). (H) Blood glucose level and (I) area under curve (AUC) of blood glucose during 120 min following OGTT. Data represent mean±SEM, each dot represents a single mouse. Mice fed HF diets containing wLB or insLB were compared to HF-control1 using one-way ANOVA and Dunnett's multiple comparisons test. Mice fed HF diet with solLB were compared to HF-control2 using a Student’s t-test. *P<0.05, **P<0.01, ***P<0.001, ****P<0.0001.
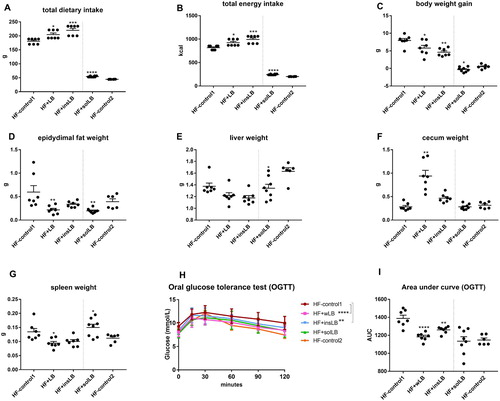
As compared to HF-control2 during 2-week feeding, mice fed solLB had higher total dietary and energy intakes feeding (P<0.0001, A). Although, the period of 2-week feeding did not induce metabolic disturbances (C–2I), there was a significant reduction in weight gain (P<0.05) (C), epidydimal fat pad weights (P<0.01) and liver weight (P<0.05) (D and E), whereas the spleen weight was higher (P<0.05) (G). No significant difference was observed in glucose response in mice fed solLB, as compared to HF-control2 (H and I).
Blood lipid profiles and atherosclerotic plaque area
The mice fed wLB and insLB showed higher plasma levels of HDL cholesterol (P<0.05 and P<0.01, respectively) (B) and triglyceride levels (P<0.05 and P<0.01, respectively) (D) in blood plasma as compared to HF-control1. There were no significant changes in plasma total cholesterol, LDL cholesterol levels, and TG/HDL ratio (A–E). Mice fed insLB also showed a tendency to have lower amount of atherosclerotic plaques (P=0.1) (F).
Figure 3 Blood lipid profiles and percentage lesion of the atherosclerotic plaque in aorta of mice fed a HF diet with cellulose for 8 weeks (HF-control1, n=7) or for 2 weeks (HF-control2), or with whole LB (wLB, n=7) or insoluble fraction of LB (insLB, n=7) for 8 weeks, or with soluble fraction of LB (solLB, n=8) for 2 weeks. Plasma (A) total cholesterol, (B) HDL-cholesterol, (C) LDL-cholesterol, (D) triglycerides (TG), and (E) TG/HDL ratio. (F) percentage atherosclerotic lesion per total aorta vessel area. Data represent mean±SEM, each dot represents a single mouse. Mice fed HF diets containing wLB or insLB were compared to HF-control1 using one-way ANOVA and Dunnett's multiple comparisons test. Mice fed HF diet with solLB were compared to HF-control2 using a Student’s t-test. *P<0.05, **P<0.01.
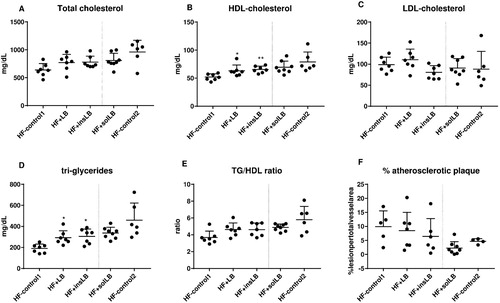
For mice fed solLB, there were no significant differences in blood lipid profiles, but a tendency to lower amounts of atherosclerotic plaques (P=0.08) were observed, as compared to HF-control2 (A–F).
Gut microbiota
At phylum level, the relative abundance of Bacteroidetes increased (P<0.01), while Firmicutes showed a tendency to decrease (P=0.09) in mice fed wLB (A). Deferribacteres decreased in both wLB (P<0.001) and insLB (P<0.01) groups, while there was an increase in Verrucomicrobia (P<0.05 for wLB and P<0.01 insLB, respectively). Furthermore, mice fed insLB also showed an increase in Cyanobacteria (P<0.0001).
Figure 4 Composition of the gut microbiota at (A) phylum and (B) genus levels in the caecum of mice fed a HF diet with cellulose for 8 weeks (HF-control1, n=7) or for 2 weeks (HF-control2), or with whole LB (wLB, n=7) or insoluble fraction of LB (insLB, n=7) for 8 weeks, or with soluble fraction of LB (solLB, n=8) for 2 weeks. Data in (A) represent mean values. Data in (B) represent mean±SEM. Mice fed HF diets containing wLB or insLB were compared to HF-control1 using one-way ANOVA and Dunnett's multiple comparisons test. Mice fed HF diet with solLB were compared to HF-control2 using a Student’s t-test. *P<0.05, **P<0.01, ***P<0.001, ****P<0.0001.
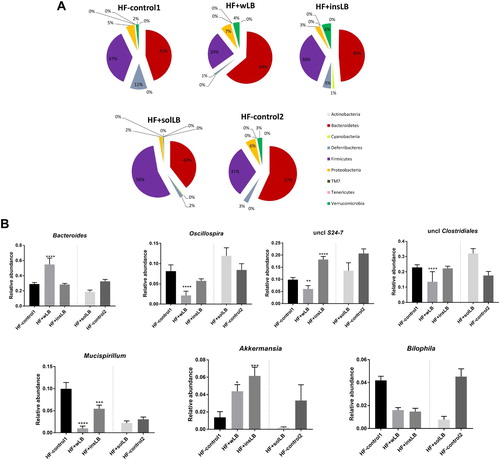
Mice fed solLB showed a distinct gut microbiota profile, including decreases in the relative abundance of Bacteroidetes (P<0.01) and Proteobacteria (P<0.0001) and an increase in Firmicutes (P<0.01) (A), as compared to HF-control2.
At genus level, mice fed wLB had an increase in Bacteroides (P<0.0001) and decrease in Oscillospira (P<0.0001), an unclassified genus in S24-7 (P<0.01) and an unclassified family in Clostridiales (P<0.0001) (B). Both wLB and insLB decreased the relative abundance of Mucispillirum (P<0.0001 and P<0.001, respectively) and increased Akkermansia (P<0.05 and P<0.001, respectively). Furthermore, insLB also decreased an unclassified genus in S24-7 (P<0.0001).
As compared to HF-control2, solLB diet only reduced the relative abundance of Bilophila (P<0.001) (B).
SCFAs in caecum
The amount of total SCFAs formed in the caecum of mice was lower in mice fed insLB (P<0.01) as compared to HF-control1, including lower amount of acetic-, propionic-, and butyric acids (P<0.05) (A–D).
Figure 5 Caecal amounts (µmol) of (A) total SCFAs, (B) acetic-, (C) propionic- and (D) butyric acids of mice fed a HF diet with cellulose for 8 weeks (HF-control1, n=7) or for 2 weeks (HF-control2), or with whole LB (wLB, n=7) or insoluble fraction of LB (insLB, n=7) for 8 weeks, or with soluble fraction of LB (solLB, n=8) for 2 weeks. Data represent mean±SEM, each dot represents a single mouse. Mice fed HF diets containing of wLB or insLB were compared to HF-control1 using one-way ANOVA and Dunnett's multiple comparisons test. Mice fed HF diet with solLB were compared to HF-control2 using a Student’s t-test. *P<0.05, **P<0.01.
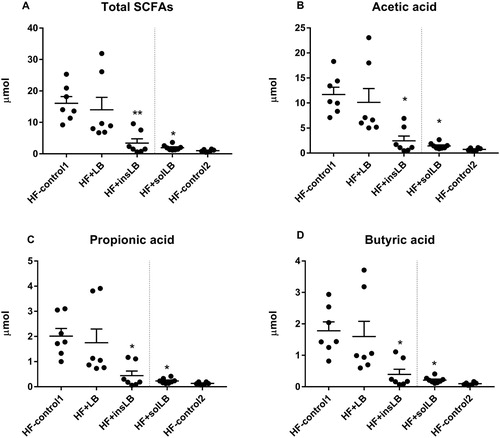
As compared to HF-control2, solLB diet increased total SCFAs, acetic, propionic, and butyric acid in the caecum of the mice (P<0.05) (A–D).
S100B protein in the gut and the brain
S100B protein levels were decreased in the middle part of the SI of mice fed wLB and insLB (P<0.01) (C), while no significant differences were observed in other parts of the gut as compared to HF-control1 (A–D).
Figure 6 S100B protein concentration (pg/µg total protein) in different parts of SI, in colon, and in different parts of the brain of mice fed a HF diet with cellulose for 8 weeks (HF-control1, n=7) or for 2 weeks (HF-control2), or with whole LB (wLB, n=7) or insoluble fraction of LB (insLB, n=7) for 8 weeks, or with soluble fraction of LB (solLB, n=8) for 2 weeks. S100B concentration in (A) proximal, (B) distal and (C) middle part of SI, (D) in colon, and in cerebral (E) hippocampus, (F) cerebellum, (G) hemisphere. Data represent mean±SEM, each dot represents a single mouse. Mice fed HF diets containing wLB or insLB were compared to HF-control1 using one-way ANOVA and Dunnett's multiple comparisons test. Mice fed HF diet with solLB were compared to HF-control2 using a Student’s t-test. *P<0.05, **P<0.01, ***P<0.001.
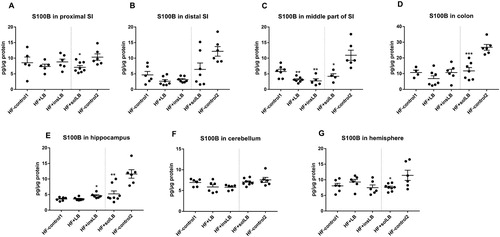
In mice fed solLB, significant reductions in S100B levels were observed in proximal and middle (P<0.05) parts of SI, as well as in the colon (P<0.001). Furthermore, S100B levels decreased close to significance (P=0.05), in distal part of SI as compared to HF-control2 (A–D).
Interestingly, S100B levels were significantly higher in the hippocampus in the brain of mice fed insLB as compared to HF-control1 (P<0.05) (E).
Mice fed solLB showed reductions in S100B level in the hippocampus and hemisphere (P<0.05), as compared to HF-control2 (E and G).
T-maze spontaneous alternation
The average alternation rate in mice fed HF-control1 was 90%. Mice fed wLB and insLB showed slightly higher average alternation rate (both 93%) (A) and spent slightly less time to decide the alternate arm (B), however, none of these differences were significant.
Figure 7 T-maze (A) alternation rate and (B) time spent for making decision of mice fed a HF diet with cellulose for 8 weeks (HF-control1, n=7) or for 2 weeks (HF-control2), or with whole LB (wLB, n=7) or insoluble fraction of LB (insLB, n=7) for 8 weeks, or with soluble fraction of LB (solLB, n=8) for 2 weeks. Data represent mean±SEM. Mice fed HF diets containing wLB or insLB were compared to HF-control1 using one-way ANOVA and Dunnett's multiple comparisons test. Mice fed HF diet with solLB were compared to HF-control2 using a Student’s t-test. No significant difference was detected.
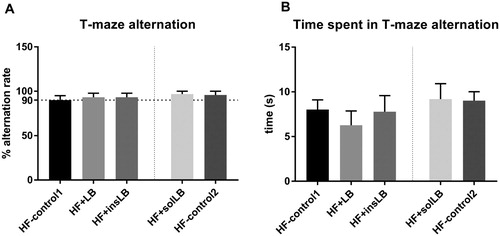
Mice fed solLB showed alternation rate of 97%, while their HF-control2 showed alternation rate of 96% (A).
Synaptic density in the hippocampal CA1 area
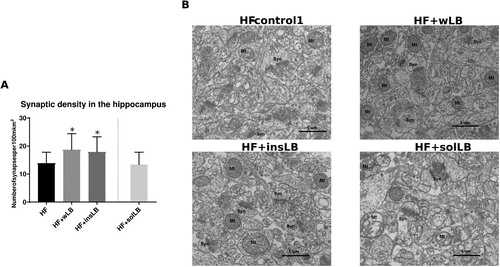
Mice fed wLB and insLB showed a significant increase (P <0.05) in synaptic density (per 100 µm2) in the CA1 area of the hippocampus (A and B), as compared to HF-control1. Mice fed solLB showed similar synaptic density as those fed HF-control1 (no brain histology data obtained from HF-control2 group).
Figure 8 Synaptic density in the CA1 area of the hippocampus of mice fed a HF diet with cellulose for 8 weeks (HF-control1, n=3) or with whole LB (wLB, n=3) or insoluble fraction of LB (insLB, n=3) for 8 weeks, or with soluble fraction of LB (solLB, n=3) for 2 weeks. (A) number of synapses per µm2. (B) Electron microscopic images of the hippocampus, showing synapses (Syn) and mitochondria (Mt). Data in (A) represent mean±SEM. Mice fed HF diets containing wLB or insLB were compared to HF-control1 using one-way ANOVA and Dunnett's multiple comparisons test. No data was obtained from mice fed HF-control2. *P<0.05.
Discussion
The present study suggests that LB have potential to counteract the negative effects of HF feeding on metabolic functions. Furthermore, LB improved gut- and neuro-inflammatory responses, as well as brain function, in relation to changes in the gut microbiota. Two fractions of LB were extracted based on the water solubility of the dietary fibre. Including resistant cellulose in the control HF diets with the same amount of dietary fibre used in the wLB and LB fraction diets controlled for the possibility to focus specifically on the LB dietary fibre’s effects on gut microbiota. The wLB and insLB showed similar effects in the prevention of body weight gain, fat deposition, and improvement of blood lipid profile and glucose responses. Furthermore, wLB and insLB reduced S100B levels in the SI, and increased synaptic density in the hippocampus. Both wLB and insLB also increased the relative abundance of Akkermansia. The solLB fraction showed marked weight loss effects in the shorter experimental period of 2-weeks.
Approximately 70% of total dietary fibre in wLB are insoluble, and 30% are solubleCitation14. Hence, it is plausible that the effects of wLB are more similar to those seen with insLB than with solLB. LB contain high concentration of benzoic acid (0.6–1.3 g/l), giving their low pH (pH 2.6–2.9)Citation38. Benzoic acid is highly soluble in waterCitation39, and most likely present in the solLB fraction. Ingestion of benzoic acid at higher doses than 500 mg/kg (body weight) in rodents, and 5 mg/kg in humans have been reported to cause acute toxicity, gastrointestinal disturbances, and weight lossCitation40. The solLB diet included 15 g/kg dietary fibre from the solLB fraction, which corresponds to approximately 136 g/kg solLB fraction in the diet (). This means that approximately 200 mg/kg benzoic acid was received by each mouse, which was below the tolerance limit. A period of 2-week feeding of solLB in a HF diet prevented weight gain, reduced epidydimal fat pad weight, and improved glucose metabolism, without showing signs of diarrhoea or illness. In humans, it is difficult to obtain the toxic dose of benzoic acid from lingonberries, since approximately 3 kg of lingonberries may have to be consumed in a person with 60 kg body weight to reach the same toxic level of benzoic acid. A low dose of the solLB fraction may be used as a potential weight loss diet, but this needs further evaluation.
Bacteria that may play an important role in diet-induced obesity was Mucispirillum, belonging to Deferribacteres phylum, that has been shown to increase in mice on HF diets, especially in C57N miceCitation41. In this study, including wLB, insLB, or solLB in HF diets decreased the relative abundance of Mucispirillum and its Deferribacteres phylum. Similar results were reported in our previous studyCitation14 where Mucispirillum also decreased when including LB in a HF diet and this bacterium correlated positively with the amount of atherosclerotic plaques. Furthermore, Akkermansia, the main member from Verrucomicrobia phylum, was increased in mice fed wLB or insLB, and may therefore be another important candidate that regulates fat deposition and glucose utilization in mice. Akkermansia muciniphila has been reported to improve insulin resistance and glucose response in both mice and humans and is inversely correlated with body weight and has also anti-inflammatory propertiesCitation14,Citation42–44. In a study of an AD mouse model, Akkermansia was found depleted in APPPS1 mice as compared to healthy wild-type mice, and restoring this bacterium seemed to be one of the parameters associated with a reduction of amyloid-beta pathology in mouse brainCitation9. Prebiotics and diets rich in polyphenols have been shown to increase Akkermansia abundance, in association with improved metabolic profile in miceCitation42,Citation45,Citation46. In this study, both wLB and especially insLB increased Akkermansia abundance, while solLB fraction did not. This suggests that the active components in LB that favour the growth of Akkermansia may be more enriched in the insLB fraction than in solLB fraction, likely because the presence of phenolic components, especially flavonoids, are more enriched in this fraction, as reported for skin in different seedsCitation47,Citation48. However, the exact phenolic components in each fraction of LB need further investigation.
Reduction of S100B protein in the gut was only significant in the middle part of SI of mice fed wLB and insLB fraction and may indicate lower EGCs activation and lower gut inflammatory statusCitation17–19. However, there was a significant increase in S100B in the hippocampus of mice fed insLB. It has been shown that the effect of S100B is concentration dependent, with low concentrations (nanomolar range) being beneficial and higher concentrations (micromolar range) harmfulCitation24. Overexpression of S100B in young 10-week-old mice led to increased density of nerve terminals in the hippocampus but prolonged exposure to 28 weeks led to significant loss of terminalsCitation23. In current study, relatively low S100B concentrations (ng levels) was detected and the increase of S100B in mice fed insLB as compared to HF-control may reflect beneficial effects in serotonin neuronal plasticity in these relatively young mice.
Alternation reflects the motivation of the animals to explore the environment and rodents have the natural tendency to alternate their choice of goal arm. The typical alternation rates are above 75% or up to 85–90% in rodentsCitation27. This model is used to assess spatial memory in rodentsCitation49. All groups of mice in this study showed a minimum alternation rate of 90%. The ability of rodents to perform in the T-maze task is sensitive to the function of the hippocampusCitation50,Citation51. The finding that mice fed wLB and insLB had significantly increased hippocampal synaptic density is intriguing. Although the mice fed wLB and insLB showed a similar result in a T-maze test, slightly higher alternation rate and slightly shorter time was spent for making the decision as compared to their controls. Notably, the mice in this study were relatively young, i.e.,16-week-old at the end of the experiment. A recent study has revealed the lack of spatial memory decline in young ApoE−/− as opposed to C57BL/6J mice, when fed a HF dietCitation52. Studies in older ApoE−/− mice may increase the chance to detect more pronounced differences in this memory test.
This study provides better understanding about the effects of soluble and insoluble fractions of LB on the gut microbiota and their ability to promote beneficial metabolic and anti-inflammatory effects in ApoE−/− mice, as opposed to intact wLB. The solLB fraction seemed to have the greatest influence on weight loss and fat reduction, that may be related to its higher content of benzoic acid which in turn changes specific groups of caecal gut bacteria. Furthermore, the insLB fraction seemed to have similar effects to wLB on the gut microbiota and the investigated metabolic biomarkers, likely because the majority of dietary fibre in wLB is insoluble. Both wLB and insLB induced increased abundance of Akkermansia which may be an important player, contributing to the positive effects of lingonberry to counteract the negative effects of HF feedings on metabolism, ATH and hippocampal brain function. Together, the results in this study further suggest that LB may be included as important components in functional diets designed to prevent metabolic syndrome and possibly also neurodegenerative diseases.
Disclaimer statements
Contributors FFH, OP, MN, NM planned the study; NM, FH and MN prepared different lingonberry fractions; NM, FH, TK, IO performed the experiments; NM, OP, FFH, GU, GS, TK, IO performed material collection; NM, OP, performed sequencing of microbiota; OP, SB performed bioinformatics; UV, GU, NM, GS, TK, IO, FH performed material analysis; FFH, OP, MN, GU, GS, UV, NM interpreted results; NM wrote the manuscript draft; all authors read and approved the final version.
Disclosure of interest FFH is shareholder in ProPrev AB.
Ethics approval The study was approved by the local ethical committee for animal experiment in Lund, Sweden (approval number M114-15).
Funding This study was funded by the Direktör Albert Påhlsson Foundation [grant number 15/12 2015 FF] and the Swedish Research Council Formas [grant number 942-2015-877].
Acknowledgements
Laboratory engineer, Mr Christer Fahlgren at the Food for Health Science Centre, Lund University is greatly acknowledged for help with SCFA analysis. Ms Thao Duy Nguyen is greatly acknowledged for help with sample collection from animal experiment. Finally, Ms Giulia Dallera is greatly acknowledged for help with behaviour analysis.
References
- Yaffe K, Kanaya A, Lindquist K, et al. The metabolic syndrome, inflammation, and risk of cognitive decline. J Am Med Assoc. 2004;292(18):2237–42. doi: 10.1001/jama.292.18.2237
- Yates KF, Sweat V, Yau PL, Turchiano MM, Convit A. Impact of Metabolic Syndrome on Cognition and Brain: A Selected Review of the Literature. Arterioscler Thromb Vasc Biol. 2012;32(9):2060–7. doi: 10.1161/ATVBAHA.112.252759
- Lathe R, Sapronova A, Kotelevtsev Y. Atherosclerosis and Alzheimer - diseases with a common cause? Inflammation, oxysterols, vasculature. BMC Geriatr. 2014;14:36. doi: 10.1186/1471-2318-14-36
- Shen TD. Diet and Gut Microbiota in Health and Disease. Nestle Nutrition Institute Workshop Series. 2017;88:117–26. doi: 10.1159/000455220
- Brestoff JR, Artis D. Commensal bacteria at the interface of host metabolism and the immune system. Nat Immunol. 2013;14(7):676–84. doi: 10.1038/ni.2640
- Festi D, Schiumerini R, Eusebi LH, Marasco G, Taddia M, Colecchia A. Gut microbiota and metabolic syndrome. World J Gastroenterol. 2014;20(43):16079–94. doi: 10.3748/wjg.v20.i43.16079
- Sampson TR, Debelius JW, Thron T, Janssen S, Shastri GG, Ilhan ZE, et al. Gut Microbiota Regulate Motor Deficits and Neuroinflammation in a Model of Parkinson’s Disease. Cell. 2016;167(6):1469–80.e12. doi: 10.1016/j.cell.2016.11.018
- Scheperjans F, Aho V, Pereira PA, Koskinen K, Paulin L, Pekkonen E, et al. Gut microbiota are related to Parkinson's disease and clinical phenotype. Mov Disord. 2015;30(3):350–8. doi: 10.1002/mds.26069
- Harach T, Marungruang N, Duthilleul N, Cheatham V, Mc Coy KD, Frisoni G, et al. Reduction of Abeta amyloid pathology in APPPS1 transgenic mice in the absence of gut microbiota. Sci Rep. 2017;7:41802. doi: 10.1038/srep41802
- Singh RK, Chang H-W, Yan D, Lee KM, Ucmak D, Wong K, et al. Influence of diet on the gut microbiome and implications for human health. J Transl Med. 2017;15:73. doi: 10.1186/s12967-017-1175-y
- Heyman L, Axling U, Blanco N, Sterner O, Holm C, Berger K. Evaluation of Beneficial Metabolic Effects of Berries in High-Fat Fed C57BL/6J Mice. J Nutr Metab. 2014;2014:403041. doi: 10.1155/2014/403041
- Torronen R, Kolehmainen M, Sarkkinen E, Mykkanen H, Niskanen L. Postprandial glucose, insulin, and free fatty acid responses to sucrose consumed with blackcurrants and lingonberries in healthy women. Am J Clin Nutr. 2012;96(3):527–33. doi: 10.3945/ajcn.112.042184
- Heyman-Lindén L, Kotowska D, Sand E, Bjursell M, Plaza M, Turner C, et al. Lingonberries alter the gut microbiota and prevent low-grade inflammation in high-fat diet fed mice. Food & Nutrition Research. 2016;60. 10.3402/fnr.v60.29993. doi: 10.3402/fnr.v60.29993
- Matziouridou C, Marungruang N, Nguyen TD, Nyman M, Fak F. Lingonberries reduce atherosclerosis in Apoe(-/-) mice in association with altered gut microbiota composition and improved lipid profile. Mol Nutr Food Res. 2016;60(5):1150–60. doi: 10.1002/mnfr.201500738
- Maatta-Riihinen KR, Kamal-Eldin A, Mattila PH, Gonzalez-Paramas AM, Torronen AR. Distribution and contents of phenolic compounds in eighteen Scandinavian berry species. J Agr Food Chem. 2004;52(14):4477–86. doi: 10.1021/jf049595y
- Linderborg KM, Järvinen R, Lehtonen H-M, Viitanen M, Kallio HPT. The fiber and/or polyphenols present in lingonberries null the glycemic effect of the sugars present in the berries when consumed together with added glucose in healthy human volunteers. Nutr Res. 2012;32(7):471–8. doi: 10.1016/j.nutres.2012.06.004
- Esposito G, Cirillo C, Sarnelli G, De Filippis D, D'Armiento FP, Rocco A, et al. Enteric glial-derived S100B protein stimulates nitric oxide production in celiac disease. Gastroenterology. 2007;133(3):918–25. doi: 10.1053/j.gastro.2007.06.009
- Cirillo C, Sarnelli G, Esposito G, Grosso M, Petruzzelli R, Izzo P, et al. Increased mucosal nitric oxide production in ulcerative colitis is mediated in part by the enteroglial-derived S100B protein. Neurogastroenterol Motility. 2009;21(11):1209-e112. doi: 10.1111/j.1365-2982.2009.01346.x
- Cirillo C, Sarnelli G, Esposito G, Turco F, Steardo L, Cuomo R. S100B protein in the gut: The evidence for enteroglial-sustained intestinal inflammation. World J Gastroenterol. 2011;17(10):1261–6. doi: 10.3748/wjg.v17.i10.1261
- Piazza O, Leggiero E, De Benedictis G, Pastore L, Salvatore F, Tufano R, De Robertis E. S100B induces the release of pro-inflammatory cytokines in alveolar type I-like cells. Int J Immunopathol Pharmacol. 2013; 26(2):383–91. doi: 10.1177/039463201302600211
- Turco F, Sarnelli G, Cirillo C, Palumbo I, De Giorgi F, D'Alessandro A, et al. Enteroglial-derived S100B protein integrates bacteria-induced Toll-like receptor signalling in human enteric glial cells. Gut. 2014;63(1):105–15. doi: 10.1136/gutjnl-2012-302090
- Nishiyama H, Knopfel T, Endo T, Itohara S. Glial protein S100B modulates long-term neuronal synaptic plasticity. PNAS. 2012; 99(6):4037–4042. doi: 10.1073/pnas.052020999
- Shapiro LA, Bialowas-McGoey LA, Whitaker-Azmitia PM. Effects of S100B on serotonergic plasticity and neuroinflammation in the hippocampus in Down syndrome and Alzheimer's disease: studies in an S100B overexpressing mouse model. Cardiovasc Psychiatry Neurol. 2010;2010:153657. doi: 10.1155/2010/153657
- Thelin EP, Nelson DW, Bellander B-M. A review of the clinical utility of serum S100B protein levels in the assessment of traumatic brain injury. Acta Neurochirurgica. 2017;159(2):209–25. doi: 10.1007/s00701-016-3046-3
- Van Eldik LJ, Wainwright MS. The Janus face of glial-derived S100B: beneficial and detrimental functions in the brain. Restorative Neurol Neurosci. 2003;21(3–4):97–108.
- Rothermundt M, Peters M, Prehn JHM, Arolt V. S100B in brain damage and neurodegeneration. Microscopy Res Tech. 2003;60(6):614–32. doi: 10.1002/jemt.10303
- Deacon RMJ, Rawlins JNP. T-maze alternation in the rodent. Nat Protocols. 2006;1(1):7–12. doi: 10.1038/nprot.2006.2
- Jakobsdottir G, Nilsson U, Blanco N, Sterner O, Nyman M. Effects of Soluble and Insoluble fractions from bilberries, black currants, and raspberries on short-chain fatty acid formation, anthocyanin excretion, and cholesterol in rats. J Agr Food Chem. 2014;62(19):4359–68. doi: 10.1021/jf5007566
- Asp NG, Johansson CG, Hallmer H, Siljestroem M. Rapid enzymic assay of insoluble and soluble dietary fiber. J Agr Food Chem. 1983;31(3):476–82. doi: 10.1021/jf00117a003
- Ayala JE, Samuel VT, Morton GJ, Obici S, Croniger CM, Shulman GI, et al. Standard operating procedures for describing and performing metabolic tests of glucose homeostasis in mice. Dis Models Mech. 2010;3(9–10):525–34. doi: 10.1242/dmm.006239
- Kozich JJ, Westcott SL, Baxter NT, Highlander SK, Schloss PD. Development of a dual-index sequencing strategy and curation pipeline for analyzing amplicon sequence data on the MiSeq illumina sequencing platform. Appl Environ Microbiol. 2013;79(17):5112–20. doi: 10.1128/AEM.01043-13
- Caporaso JG, Kuczynski J, Stombaugh J, Bittinger K, Bushman FD, Costello EK, et al. QIIME allows analysis of high-throughput community sequencing data. Nat Methods. 2010;7(5):335–6. doi: 10.1038/nmeth.f.303
- Caporaso JG, Bittinger K, Bushman FD, DeSantis TZ, Andersen GL, Knight R. PyNAST: a flexible tool for aligning sequences to a template alignment. Bioinformatics. 2010;26(2):266–7. doi: 10.1093/bioinformatics/btp636
- DeSantis TZ, Hugenholtz P, Larsen N, Rojas M, Brodie EL, Keller K, et al. Greengenes, a chimera-checked 16S rRNA gene database and workbench compatible with ARB. Appl Environ Microbiolol. 2006;72(7):5069–72. doi: 10.1128/AEM.03006-05
- Zhao G, Nyman M, Jonsson JA. Rapid determination of short-chain fatty acids in colonic contents and faeces of humans and rats by acidified water-extraction and direct-injection gas chromatography. BMC. 2006;20(8):674–82.
- Ellis RA. Principles and techniques of electron microscopy: Biological Applications, Volume 9. Cell. 1979;17(1):235–6. doi: 10.1016/0092-8674(79)90312-X
- Hughes RN. The value of spontaneous alternation behavior (SAB) as a test of retention in pharmacological investigations of memory. Neurosci Biobehav Rev. 2004;28(5):497–505. doi: 10.1016/j.neubiorev.2004.06.006
- Visti A, Viljakainen S, Laakso S. Preparation of fermentable lingonberry juice through removal of benzoic acid by Saccharomyces cerevisiae yeast. Food Res Int. 2003;36(6):597–602. doi: 10.1016/S0963-9969(03)00007-3
- Benzoic Acid [Internet]. [cited Feb. 6, 2018]. Available from: https://pubchem.ncbi.nlm.nih.gov/compound/benzoic_acid#section=Solubility.
- Toxicological evaluation of some food additives including anticaking agents, antimicrobials, antioxidants, emulsifiers and thickening agents: Benzoic Acid and Its Potassium and Sodium Salts [Internet]. [cited February 6, 2018]. Available from: http://www.inchem.org/documents/jecfa/jecmono/v05je06.htmm
- Walker A, Pfitzner B, Neschen S, Kahle M, Harir M, Lucio M, et al. Distinct signatures of host-microbial meta-metabolome and gut microbiome in two C57BL/6 strains under high-fat diet. Int Soc Microb Ecol J. 2014;8(12):2380–96.
- Everard A, Belzer C, Geurts L, Ouwerkerk JP, Druart C, Bindels LB, et al. Cross-talk between Akkermansia muciniphila and intestinal epithelium controls diet-induced obesity. Proc Natl Acad Sci U S A. 2013;110(22):9066–71. doi: 10.1073/pnas.1219451110
- Shin N-R, Lee J-C, Lee H-Y, Kim M-S, Whon TW, Lee M-S, et al. An increase in the Akkermansia spp. population induced by metformin treatment improves glucose homeostasis in diet-induced obese mice. Gut. 2014;63(5):727–35. doi: 10.1136/gutjnl-2012-303839
- Schneeberger M, Everard A, Gómez-Valadés AG, Matamoros S, Ramírez S, Delzenne NM, et al. Akkermansia muciniphila inversely correlates with the onset of inflammation, altered adipose tissue metabolism and metabolic disorders during obesity in mice. Scientific Reports. 2015;5:16643. doi: 10.1038/srep16643
- Anhê FF, Pilon G, Roy D, Desjardins Y, Levy E, Marette A. Triggering Akkermansia with dietary polyphenols: A new weapon to combat the metabolic syndrome? Gut Microbes. 2016;7(2):146–53. doi: 10.1080/19490976.2016.1142036
- Collins B, Hoffman J, Martinez K, Grace M, Lila MA, Cockrell C, et al. A polyphenol-rich fraction obtained from table grapes decreases adiposity, insulin resistance and markers of inflammation and impacts gut microbiota in high-fat-fed mice. J Nutr Biochem. 2016;31(Supplement C):150–65. doi: 10.1016/j.jnutbio.2015.12.021
- Fernandez de Simon B, Perez-Ilzarbe J, Hernandez T, Gomez-Cordoves C, Estrella I. Importance of phenolic compounds for the characterization of fruit juices. J Agr Food Chem. 1992;40(9):1531–5. doi: 10.1021/jf00021a012
- Pandey KB, Rizvi SI. Plant polyphenols as dietary antioxidants in human health and disease. Oxidative Med Cell Longevity. 2009;2(5):270–8. doi: 10.4161/oxim.2.5.9498
- Wenk GL. Assessment of spatial memory using the T maze. Current Protocols in Neuroscience. 2001;Chapter 8:Unit 8.5B.
- White SR. Atropine, scopolamine and hippocampal lesion effects on alternation performance of rats. Pharmacol Biochem Behav. 1974;2(3):297–307. doi: 10.1016/0091-3057(74)90073-2
- Lalonde R. The neurobiological basis of spontaneous alternation. Neurosci Biobehav Rev. 2002;26(1):91–104. doi: 10.1016/S0149-7634(01)00041-0
- Janssen CIF, Jansen D, Mutsaers MPC, Dederen PJWC, Geenen B, Mulder MT, Kiliaan AJ. The Effect of a High-Fat Diet on Brain Plasticity, Inflammation and Cognition in Female ApoE4- Knockin and ApoE-Knockout Mice. PLoS ONE 11(5): e0155307. doi: 10.1371/journal.pone.0155307